Logging and Monitoring
- Logging options in AWS
- Amazon CloudWatch
- AWS CloudTrail
- AWS Config
- AWS Inspector
- Athena
- AWS GuardDuty
- AWS Trusted Advisor
Logging options in AWS
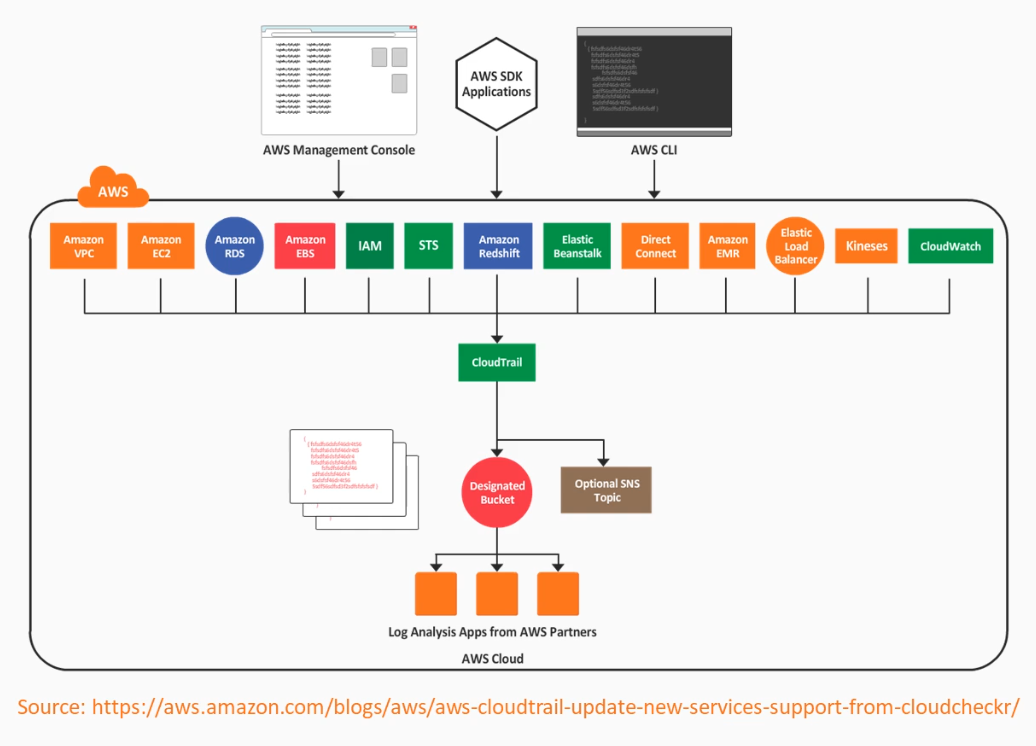
- AWS CloudTrail - user activity and API calls
- AWS Config - Records configuration
- AWS VPC Flow Logs - Network traffic in VPCs
- AWS CloudWatch - Application logging and metrics
Amazon CloudWatch
CloudWatch provides centralized logging and metrics for resources and applications.
- enables actions triggered by events
- stored permanently without using AWS S3, but can be exported
- CloudWatch agent can be installed and used for your application logging
- IAM policies can be used to restrict user actions in CloudWatch
Main components
-
CloudWatch Dashboards, alarms, emtrics (both pre-defined and custom), and Notifications
-
CloudWatch Logs Logs from certain AWS services and your own applications
-
CloudWatch Events Trigger actions based on rules created from system event data like API calls, AWS resources state, and Scheduled
-
CloudWatch Insights Insight can be leveraged to search and analyze log data
Getting started with CloudWatch
- Install CloudWatch agent in EC2
- Create a Log group in CloudWatch logs
- Configure the CloudWatch agent to send logs into that log group
CloudWatch Dashboards
We can build and customize a CloudWatch dashboard page using different visual widgets displaying metrics and alarms relating to your resources to form a unified view. This can be done through any of the methods below:
- AWS Management console
- AWS CLI
- PutDashboard API
These dashboards can then be viewed from within the AWS Management Console. The resources within your customized dashboard can be from multiple different regions making this a very useful feature. In addition:
- quickly and easily design and configure different dashboards
- creates view for performance metrics and alarms from resources relating to a project
- create a different dashboard for a specific region or application deployment.
Once you have built your Dashboards, you can easily share them with other users, even those who may not have access to your AWS account. This allows you to share the findings gathered by CloudWatch with those who may find the results interesting and beneficial to their day-to-day operational role, but don’t necessarily require the need to access your AWS account.
Dashboards and Widgets
There are two ways that you can create a dashboard.:
- Create visually through the editor
- Create dashboards programmatically (can be used inside CloudFormation templates)
Both methods allow you to pick from many different media types called widgets. There are currently 8 flavors of these widgets and they are as follows:
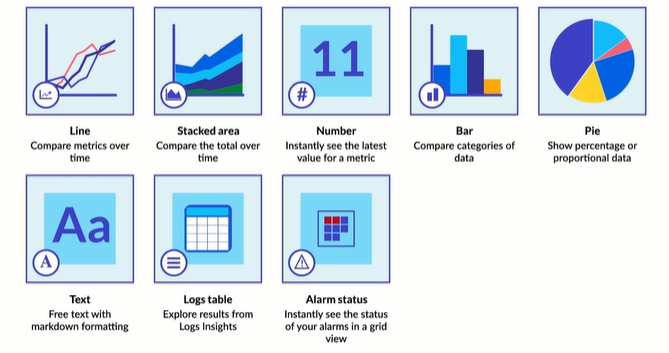
Line charts - A line chart is a type of chart which displays information as a series of data points connected by straight line segments. It is a basic type of chart common in many fields.
Stacked area chart -This type of chart compares the totals of many different subjects within the same graph
Number Widget - Allow you to instantly see the value for a certain metric that you’re particularly interested in - this could be as simple as displaying the current number of online instances.
Bar Charts - Compares values of multiple types of data within the same graph.
Pie charts - Proportional data in direct relationship to other information fitted within a circle.
Text widget - Free text with markdown formatting allowing you to add useful information to your dashboards as you see fit
Log tables - Explore results from log insights. Logs Insights enables you to interactively search and analyze your log data in Amazon CloudWatch
Alarm statuses - In case you have an alarm set up that you’d like to know immediately if something is going wrong right on this dashboard
Dashboard Features
One extremely cool feature of CloudWatch dashboards is they allow you to perform math on the metrics you want to display. So if you wanted to see how a graphed metric looked when applying normalization techniques or filters to your data you have the power to do so.
Additionally when working with dashboards are also allowed to aggregate data across multiple sources, like an auto scaling group for example, so if you were interested in seeing how the CPU load was handling overtime across your entire fleet you could create a dashboard that would display that.
Create visually
It is fairly painless to create dashboards with the visual dashboard creation tools provided by AWS within the CloudWatch console. Creating dashboards in the editor is as simple as drag and dropping and adding new widgets onto a blank canvas. The editor allows you to pick any of the previously mentioned different types of media widgets and place them where you please. Pieces are rearrangeable and can be placed with as much finite controls as you desire. all widgets have a stretchable window view that you can position into specific sizes.
Create programmatically
Dashboards can also be written as code giving you programmatic access to all the same information and tools. This means you can also put these code snippets inside cloud formation templates for easy dashboard creation on new accounts or projects. Creating these codified dashboards however is not as easy as it may sound at first. There is a lot of work that goes into testing and making sure your creation functions well.
Your dashboard code is written as a string in JSON formatting and can include anywhere between 0 to 100 separate widget objects. You have to specifically note down the x,y location of your widgets as well as the width and height of each element. That can be a little tedious to set up for the first time, but if you already have a functional blueprint, you can modify that fairly easily.
Annotations
When you’re building your charts and after you have them completed you have the ability to add annotations to your graphs. This is helpful for displaying when a certain event has taken place in the past which could help give other members of your team insight and exposure to certain peaks and valleys in your information. Just like writing good code requires comments it’s especially important to make sure your graphs and charts also have that advantage.
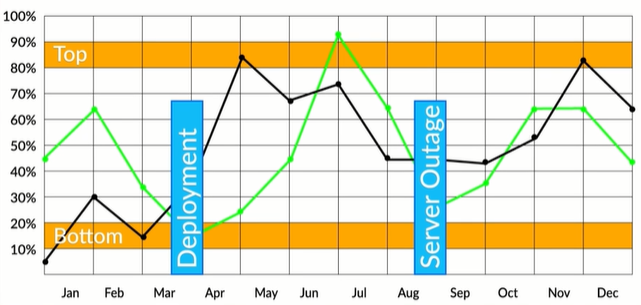
You can have both horizontal and vertical annotations in your graphs - each having their own purpose. For example, horizontal annotations can denote reasonable top and bottom bounds for a service’s CPU load while vertical annotations are great for noting when a specific event happened in the past.
Linking Dashboards
You also have the ability to link to other dashboards within your own systems or even across accounts. These dashboards don’t have to be in the same region either. This is a very powerful tool that helps to centralize operations teams, DevOps, and other service owners who all need to have visibility into the status of your applications.
In order to allow cross-account and cross-region access, you need to enable it within the CloudWatch settings for your account as well as each of the accounts you wish to connect to. You can then link your accounts together, to share CloudWatch data between. These settings can also be activated within the AWS SDK and CLI.
Few options on sharing:
-
Share a single dashboard and designate specific email addresses and passwords of the people who can view the dashboard.
-
Share a single dashboard publicly, so that anyone who has the link can view the dashboard.
-
Share all the CloudWatch dashboards in your account and specify a third-party single sign-on (SSO) provider for dashboard access. All users who are members of this SSO provider’s list can access the dashboards in the account. To enable this, you integrate the SSO provider with Amazon Cognito.
Limits
CloudWatch Dashboards allow you to have up to three dashboards - each containing up to 50 metrics at no charge. This is more than enough for anyone just practicing or having a few applications they want to monitor. For any more than that however, you will be charged $3 per month per new dashboard you wish to create.
For an enterprise company, that is not too much to spend. However If you are a solo developer or a small shop just starting off - those little 3 dollar charges can add up.. So make sure you use your resources appropriately when building dashboards for your services.
Best Practices
-
Use larger graphs for the most important display metrics - It’s important to keep in mind that humans are visual creatures. If you want them to pay attention to something, make it big and obvious.
-
Layout your dashboards and graph for the average minimum display resolution of your users - this can help make sure that all relevant data is on screen at one time. This prevents users from missing key information that might be off-screen, which in the case of time-sensitive issues or events could be catastrophic. Most screens these days are able to handle 1920 by 1080 fairly well, however if you know your support staff all look at things on their phones, maybe you can design your dashboards around that instead.
-
Display time zones within your graphs for time-based data and if multiple operators are expected to be using the same dashboard simultaneously keep the time zone in UTC - This allows people to know at a glance, when an event took place. Its also important during an emergency that all users are working on the same premise in regards to the time the event happened, having to calculate differences in time zones can be frustrating when your customers’ satisfaction and your business is on the line.
-
Default your time interval and datapoint period to whatever is the most common use case.
-
Avoid plotting too many datapoints within your graphs - Having too much data can slow the dashboard loading time and might reduce the visibility of anomalies.
-
Annotate your graphs with the relevant alarm thresholds for your services - this allows your users to understand at a glance if one of your services is about to go over its SLA times or when something terrible is about to happen. Having alarms is great, but never triggering them because you knew something was wrong ahead of time is way better.
-
Don’t assume your users will know what each metric means - be aggressive with tagging and having descriptions right in the dashboard using text widgets.
CloudWatch Metrics
Metrics are a key component and fundamental to the success of Amazon CloudWatch, they enable you to monitor a specific element of an application or resource over a period of time while tracking these data points. Example of metrics include:
- number of DiskReads or DiskWrites on an EC2 instance
- NumberOfObjects, which tracks the number of objects in a specified S3 bucket.
By default when working with Amazon CloudWatch, everyone has access to a free set of Metrics, and for EC2, these are collated over a time period of 5 minutes. However, for a small fee, you can enable detailed monitoring which will allow you to gain a deeper insight by collating data across the metrics every minute.
In addition to detailed monitoring, you can also create your own custom metrics for your applications, using any time-series data points that you need, but be aware that when you create a metric they are regional, meaning that any metrics created in 1 region will not be available in another.
Anomaly Detection
CloudWatch metrics also allow you to enable a feature known as anomaly detection. This allows CloudWatch to implement machine learning algorithms against your metric data to help detect any activity that sits outside of the normal baseline parameters that are generally expected. Advance warning of this can help you detect an issue long before it becomes a production problem.
CloudWatch Alarms
Amazon CloudWatch Alarms tightly integrate with Metrics and they allow you to implement automatic actions based on specific thresholds that you can configure relating to each metric. Examples include:
- set an alarm to activate an auto scaling operation
- provisioning another instance if your CPUUtilization peaked at 75% for more than 5 minutes
- send a message to an SNS Topic when the same instance drops back below the 75% threshold
Alarm States
There are 3 different states for any alarm associated with a metric:
-
OK – The metric is within the defined configured threshold
-
ALARM – The metric has exceeded the thresholds set
-
INSUFFICIENT_DATA – The alarm has just started, the metric is not available, or not enough data is available for the metric to determine the alarm state.
Integration
CloudWatch alarms are also easily integrated with your dashboards as well, allowing you to quickly and easily visualize the status of each alarm. When an alarm is triggered into a state of ALARM, it will turn red on your dashboard, giving a very obvious indication.
CloudWatch EventBridge
CloudWatch EventBridge is a feature that has evolved from an existing feature called Amazon Events. CloudWatch EventBridge provides a means of connecting your own applications to a variety of different targets, typically AWS services, to allow you to implement a level of real-time monitoring, allowing you to respond to events that occur in your application as they happen.
But what is an event? Basically, an event is anything that causes a change to your environment or application.
Benefits of using CloudWatch EventBridge:
- implement a level of event-driven architecture in a real-time decoupled environment.
- establishes a connection between applications and specified targets to allow a data stream of events to be sent.
Rules
A rule acts as a filter for incoming streams of event traffic and then routes these events to the appropriate target defined within the rule. The rule itself can route traffic to multiple targets, however the target must be in the same region.
Targets
Targets are where the events are sent by the rules. All events received by the target are done in a JSON format. Here are a few targets that can be used as a destination for events:
- Lambda functinos
- Amazon EC2 instances
- Streams in Amazon Kinesis Data Streams
- Delivery Streams in Amazon Kinesis Data Firehose
- Log groups in Amazon CloudWatch Logs
- Amazon ECS KodeKloud_Tasks
- System Manager Run Command
- System Manager Automation
For the latest list of targets, please see the relevant documentation here: https://docs.aws.amazon.com/eventbridge/latest/userguide/eventbridge-targets.html
Event Buses
An Event Bus is the component that actually receives the Event from your applications and your rules are associated with a specific event bus. CloudWatch EventBridge uses a default Event bus that is used to receive events from AWS services, however, you are able to create your own Event Bus to capture events from your own applications.
CloudWatch Logs
CloudWatch Logs gives you a centralized location to house all of your logs from different AWS services that provide logs as an output, such as CloudTrail, EC2, VPC Flow logs, etc, in addition to your own applications.
When log data is fed into Cloudwatch Logs, you can utilize CloudWatch Log Insights to monitor the logstream in real time and configure filters to search for specific entries and actions that you need to be alerted on or respond to. This allows CloudWatch Logs to act as a central repository for real-time monitoring of log data.
Unified CloudWatch Agent
This be installed to collect logs and additional metric data from EC2 instances as well from on-premise services running either a Linux or Windows operating system. This metric data is in addition to the default EC2 metrics that CloudWatch automatically configures for you.
CloudWatch Insights
CloudWatch Insights provide the ability to get more information from the data that CloudWatch is collecting. There are currently three different types of insights within CloudWatch:
- Log Insights
- Container Insights
- Lambda Insights.
Log Insights
This is a feature that can analyze your logs that are captured by CloudWatch Logs at scale in seconds using interactive queries delivering visualizations that can be represented as:
- bar
- line
- pie
- stacked area charts
The versatility of this feature allows you to work with any log file formats that AWS services or your applications might be using.
Using a flexible approach, you can use Log insights to filter your log data to retrieve specific data allowing you to gather insights that you are interested in. Also using the visual capabilities of the feature, it can display them in a visual way.
Container Insights
Much like Log insights, Container Insights allow you to collate and group different metric data from different container services and applications within AWS, for example, the Amazon Elastic Kubernetes Service, (EKS) and the Elastic Container Service (ECS).
- capture and monitor diagnostic data giving y
- these insight data can be analyzed at the cluster, node, pod, and task level
Lambda Insights
This feature provides you the opportunity to gain a deeper understanding of your applications using AWS Lambda. It gathers and aggregates system and diagnostic metrics related to AWS Lambda to help you monitor and troubleshoot your serverless applications.
To enable Lambda Insights, you need to enable the feature per Lambda function that you create within Monitoring Tools section of your function:

This ensures that a CloudWatch extension is enabled for your function allowing it to collate system-level metrics which are recorded every time the function is invoked.
AWS CloudTrail
CloudTrail automatically records user activity and deliver those logs for you.
- Enable auditing, incident investigation, intrusion detection, and compliance
- almost all AWS services are supported, except AWS Sumerian
- can be enabled for the entire account
- aggregation is possible across regions and accounts
- usual S3 functionalities are possible
- Notifications
- Server Side Encryption (SSE)
- Bucket Policies
- Lifecycle
Who did what and when
- records metadata around API calls
- identifying the caller (user and source IP)
- date and time of events
- request/response data
Log File Integrity
We can verify that log files have remain unchanged since CloudTrail delivered them to the S3 bucket.
- log file validation can be configured during the Trail creation.
- a hash value is created for each log file
- log files can be shipped with a digest file
- digest files contain details of all logs delivered within the last hour
- digest files can be used to validate the integrity of log file
- digest fiels are stored in the same bucket as log files
- these digests are signed by private key of a public and private keypair
Note that verification of the log file integrity can only be achieved via programmatic access and not through the console. This can be done through AWS CLI:
aws cloudtrail validate-logs --trail-arn <trailARN> --START-TIME <start-time>
We can also add additional parameters:
aws cloudtrail validate-logs --trail-arn <trailARN> --START-TIME <start-time> \
--end-time <end-time> \
--s3-bucket <bucket-name> \
--s3-prefix <prefix> \
--verbose
Digest file folder structure in the S3 bucket:
S3-bucket-name/AWSLogs/accounID/CloudTrail-Digest/Region/digest-end-year/digest-end-month/digest-end-date/
CloudTrail Process Flow
- Create a Trail.
- Specify an S3 bucket for log storage.
- Optional - Encrypt log files with KMS.
- Optional - Notifications of new log files via SNS.
- Optional - Enable log file validation.
- Once trail is created, we can add configuration change.
- Optional - Deliver CloudTrail logs to CloudWatch for monitoring.
- Optional - Configure Event Selector for Management/Data
- Optional - Add any required tags.
- Configuration is complete.
Once data is captured, we can find particular events quickly through the use of API Activity Filters.
Lifecycle of an API call in CloudTrail
- IAM user or service calls an API.
- CloudTrails checks if the API call matches any configured trail.
- If a match is found, API call is recorded as an event on the log file.
- Event on log file can be delivered to an S3 bucket or CloudWatch Logs.
- In the 3 bucket, log files are sotred and encrypted by default by SS3 unless KMS is configured.
- If lifecycle rules are configured, log files may be stored on a different storage class or AWS Glacier.
CloudTrail Permissions
Currently there are two AWS Managed policies for CloudTrail:
- AWS CloudTrailFullAccess
- AWSCloudTrailReadOnlyAccess
Custom permissions can be created by creating a new IAM policy and applying some of the permissions instead fo providing full access to CloudTrail.
KMS adds another layer of ecnryption to Log files, in addition to the default encryption that uses SS3-S3 encryption. If the logs in the S3 bucket have been encrypted using KMS, specific permissions are needed to decrypt the logs:
- Decrypt permissions must be given to the CMK policy
- S3 read permissions
Note that the KMS key and bucket needs to be in the same region.
CloudTrail Logs
- Logs all API Calls as “event”
- Logs can be delivered to an S3 bucket
- Requests can be initiated from:
- Software Development Kits (SDKs)
- AWS CLI
- AWS Management Console
- Another AWS service
- New log files are created every 5 mins
- Log files can be stored for as long as required
- Log files can also be delivered to CloudWatch Logs for metric monitoring and alerting via SNS
CloudTrail Trails
Without a Trail, AWS CloudTrail is unable to capture API calls.
- trails hold the config information for capturing API calls
- can be created through the AWS Management console
CloudTrail Log Files
Log Files are written in JSON format and new log files are created every 5 mins.
- everytime a new event is captured, it is recorded to the log file
- a new event is written for each API call
- logs are delivered approximately after API was initiated
- log files are held in CloudTrail for processing and then delivered to the S3 bucket
Log file naming convention:
AccountID_CloudTrail_RegionName_YYYYMMDDTHHmmZ_UniqueString.FilenameFormat
- Note that the “THHmmZ” is the time and the “Z” means the time is in UTC.
- the “UniqueString” is a random 16-digit alphanumeric character as identifier
- default format is json.gz
As for the S3 bucket where the log files are stored, it also follows an S3 Bucket structure:
BucketName/prefix/AWSLogs/AccountID/CloudTrail/RegionName/YYYY/MM/DD
Log Aggregation to a Single Account
Logs from multiple accounts can be aggregated to a single S3 bucket in one of the accounts.
- Configure a new Trail in your primary AWS account.
- Apply permissions to S3 bucket allowing cross-account access.
-
Edit the resource attribute of bucket policy and add the accounts that need access to the bucket.
"Resource": { "arn:aws:s3:::bucket-name/[optional]logFilePrefix/AWSLogs/111111111111", "arn:aws:s3:::bucket-name/[optional]logFilePrefix/AWSLogs/222222222222", "arn:aws:s3:::bucket-name/[optional]logFilePrefix/AWSLogs/333333333333" } -
Create a new trail in the secondary AWS account and use a bucket from a different account.
- Once trail is created, logs will now be delivered to the same S3 bucket in your primary account.
Accessing Cross-Account Log Files
For users/administrators in the secondary accounts to access the log files that are aggregated to the S3 bucket in the primary account, we need to configure a few elements in IAM:
- In the primary account. create IAM roles for each of the AWS account.
- Assign access policy to each Role that allows only a specific Account access.
- Users in the requesting account will need to assume one of these Roles for their corresponding AWS account log files.
Monitoring
Common monitoring use-cases:
- starting, stopping, rebooting, and terminating EC2 instances
- changes to security policies within IAM and S3
- failed login attempts to the Management Console
- API calls that result in failed authorization
CloudTrail + CloudWatch Process:
- Log file sent to S3 and CloudWatch log group (if configured)
-
CloudTrail assumes Role with permission to run two CloudWatch APIs:
- CreateLogStream
- PutLogEvents
Default IAM role created by cloudtrail:
CloudTrail_CloudWatchLogs_Rule
CloudWatch Configuration:
- CloudWatch Log Events have a size limitation of 256KB
- Metric Filters can be added to allow search of the logs
- Each metric filter requires customizable Filter pattern
- Filter patters determines what data is monitored by CloudWatch
Similarities with other AWS services
- CloudTrail, Config, and VPC flow logs are AWS managed services
- all can be delivered to an S3 bucket
- their differences:
- AWS CloudTrail - User activity and API calls
- AWS Config - Configuration of your environment
- AWS VPC Flow Logs - Network traffic in VPCs
AWS Config
Common resource management questions:
- What resources do we have?
- Which devices are performing functions?
- Do we have resources that are no longer needed and can we switch them off?
- What are the status of the current configurations?
- Are there any security vulnerabilities?
- How are the resources linked within the environment?
- Do we have a history of the changes in the resources?
- Is the infrastructure compliant with specific governance controls?
- Do we have accurate auditing information?
AWS Config is designed to record and capture resource changes within your environment, allowing you to perform a number of actions against the data that helps to find answers to the questions that we highlighted previously. Main features include:
- Capture resource changes
- Act as a resource inventory
- Store configuration history
- Provide a snapshot in time of configurations
- Notifications about changes
- Provide AWS ClousTrail integration
- Rules to check compliancy
- Perform security analysis
- Identify relationship between resources
AWS Config is region-specific, which means that if you have resources in multiple regions, you will have to configure AWS Config for each region you want to record resource changes for. When doing so, you are able to specify different options for each region.
For services that are not region-specific such as IAM, there is also an option to record global-scoped resources.
Use Cases
Security Compliance. AWS Config can be a great tool, when enforcing strict compliance against specific security controls.
- Be notified of noncompliant resources to protect internal and external customer data.
- Services are continually monitor and checked to remain compliant throughout its life cycle.
Discovery of Resources. When you first activate AWS Config, or run the configuration recorder, AWS Config will discover all supported resources types, allowing you to view them from within the AWS Config dashboard.
- A configuration item will be recorded for each
- Resources could also be found in the configuration history file on S3
- Allows you to perform some essential housekeeping within your network and VPC
Audit Compliance. As well as using AWS Config for being compliant for internal security standards, there are also many external audit and governance controls, where the service can also enforce specific controls on resources to maintain compliance.
- Health Insurance Portability and Accountability Act, known as HiPAA
- Payment Card Industry Data Security Standard, known as PCI DSS.
These programs require strict controls in many different areas. Being able to set custom and manage configurals in place help adhere to these external governance controls. In addition to this, you could show the auditors all of your configuration history files, which will allow them to go back to any point in time to check the configuration of any of your supported resources.
Resource Change Management. When planning changes within your infrastructure, it’s often required that you have an understanding of what affect the change will have on other resources.
- Resource relationshipd is not always known
- We are able to use the dashboard to list all related resources of a particular resource,
- Allows us to plan our changes more effectively
- Prevent outages and configurational mistakes being made by having an overall better visual awareness of the environment.
Troubleshooting and Problem Management. AWS Config is a great tool to help you troubleshoot issues, that may arise within your environment.
- See a timeline of events allowing you to go back to any point in time
- Understand what changes happened on your supported resources.
- See the changes made to the resource and make any amendments to resolve the issue
- Through AWS CloudTrail, we can see who or what triggered the change, via which API call
Key Components
The following identifies the main components to the AWS Config service:
- AWS resources
- Configuration Items
- Configuration Streams
- Configuration History
- Configuration Snapshots
- Configuration Recorder
- Config Rules
- Resource Relationships
- SNS Topics
- S3 Bucket
- AWS Config Permissions
AWS resources
These are objects that can be created, updated, and deleted from within the Management console or programmatically through the AWS CLI or SDKs.
Configuration Items
A configuration item or CI is comprised of a JSON file that holds the configuration information, relationship information, and other metadata as a point-in-time snapshot view of a supported resource.
- All the information that AWS Config can record for a resource is captured within the CI.
- Created every time a supported resource has a change made to its configuration in any way.
- Record CIs for directly related resources to ensure change doesn’t affect those resources too.
- CI is then sent to configuration stream

Sections of a Configuration Item:
- Metadata - Version ID, Configuration ID, Time of capture, MD5 hash
- Attributes - Unique Resource ID, Key-value tags, Resource type, ARN
- Relationships - relationship of the recorded resource to the other resources
- Current Configuration - information for the resource
- Related Events - related AWS CloudTrail event ID
Configuration Streams
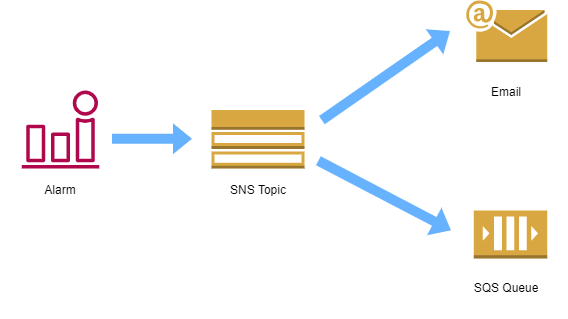
When new CIs are created, they are sent to a Configuration Stream which is in a form of an SNS topic. This stream is used on events like:
- When configuraiton history files are delivered
- When configuration snapshots are started
- When state of compliance changes for a resource
- When evaluations for rules are started
- When AWS Config fails to dleiver notifications
The SNS topic can have different notification endpoints;
- Email notification
- SQS
Configuration History
The configuration history uses configuration items to collate and produce a history of changes to a particular resource. This allows you to see the complete set of changes made to a resource over a set period of time.
The information can be accessed AWS CLI using the following command:
aws configservice get-resource-config-history
This could also be accessed via the AWS Management Console. A configuration history file for each resource type is sent to a S3 bucket that is selected during the set up of AWS Config.
- Typically delivered every six hours
- Contains all CI changes for all resources of a particular type.
Configuration Snapshots
The configuration snapshot takes a point-in-time snapshot of all supported resources configured for that region. It will then generate CIs for each resource in your AWS account for a specific region, and this configuration snapshot can then be sent to an S3 bucket. Alternatively, this information can be viewed via the AWS Management Console.
Configuration Recorder
This can be seen as the engine of the service as it is responsible for recording all of the changes to the supported resources and generating the configuration items.
- Automatically enabled by default and started when you first configure AWS Config.
- Can be stopped and then restarted again at a later point.
- When stopped, AWS Config will no longer track and record changes to your supported resources.
Config Rules
AWS config rules enforce specific compliance checks and controls across your resources, and allows you to adopt an ideal deployment specification for each of your resource types.
- Each rule is a lambda function that evaluates resources and carries out some simple logic to determine the compliance result with the rule.
- Each time a change is made to one of your supported resources, AWS Config will check the compliance against any config rules that you have in place.
- If there was a violation against these rules, then AWS Config will send a message to the configuration stream via SNS and the resource will be marked as non-compliant.
It’s important to note that marking a resource as non-compliant does not mean the resource will be taken out of service or it will stop working. It will continue to operate exactly as it is with its new configuration.
AWS Config simply alerts you that there is a violation, and it’s up to you to take the appropriate action.
- Rules can be custom defined, or selected from a predefined list of AWS managed rules
- Custom-defined rules allows you to adopt internal best practices
- Predefined rules can also be modified to make subtle parameter changes as needed
- 50 config rules per region, but can raise a request to AWS to increase limit
Examples of predefined rules that AWS have created:
-
Rds-storage-encrypted This checks whether storage encryption is activated by your RDS database instances.
-
Encrypted-volumes This checks to see if any EBS volumes that have an attached state are encrypted. Optionally you can specify the ID of a KMS key to use to encrypt the volume.
-
Root-account-mfa-enabled This checks whether your root account of your AWS account requires multifactor authentication for console sign in.
-
IAM-user-no-policy-check This checks that none of your IAM users have policies attached. Best practice dictates that permissions should be provided via roles or groups.
When creating or modifying rules:
- Identify the compliance and standards that we need to adhere to
- Define requirements from all parties
- Create/modify the rules
Resource Relationships
AWS Config identifies relationships with other resources from a specific resource. As an example, it might be the EC2 instance that the volume is attached to.
- Builds a logical mapping of resources and how they connect.
- Allows you to see linked resources to view their configuration history and CI data.
- Useful if you’re trying to troubleshoot an issue and pinpoint where the source
SNS Topics
An SNS topic is used as a configuration stream for notifications of various events triggered by AWS Config. You can have various endpoints associated to the SNS stream. Best practice indicates that you should use SQS and then programmatically analyze the results via SQS.
S3 Bucket
The S3 bucket that was selected at the time of configuration is used to store all the configuration history files that are generated for each resource type, which happens every six hours. Also, any configuration snapshots that are taken are also stored within the same S3 bucket.
The configuration details used for both SNS and S3 are classed as the AWS Config delivery channel by which data can be sent to other services.
AWS Config Permissions
When setting up AWS Config, you’re required to select an IAM role. This role is required to allow AWS Config to obtain the correct permissions to carry out and perform a number of functions.
For example, AWS Config will need read-only access to all the supported resources within your account so it can retrieve data for the configuration items. Also, we now know that AWS Config uses SNS and S3 both for streams and storage of the configuration history files and snapshots. So AWS Config requires the relevant permission to allow it to send data to these services.
AWS Inspector
It is an automated security assessment service that can help you improve the security and compliance of applications deployed in AWS.
- automatically discovers vulnerabilities and deviations from best practices
- assessment templates can be created based on rule packages
- these rules tell Inspector what it needs to test your resources against
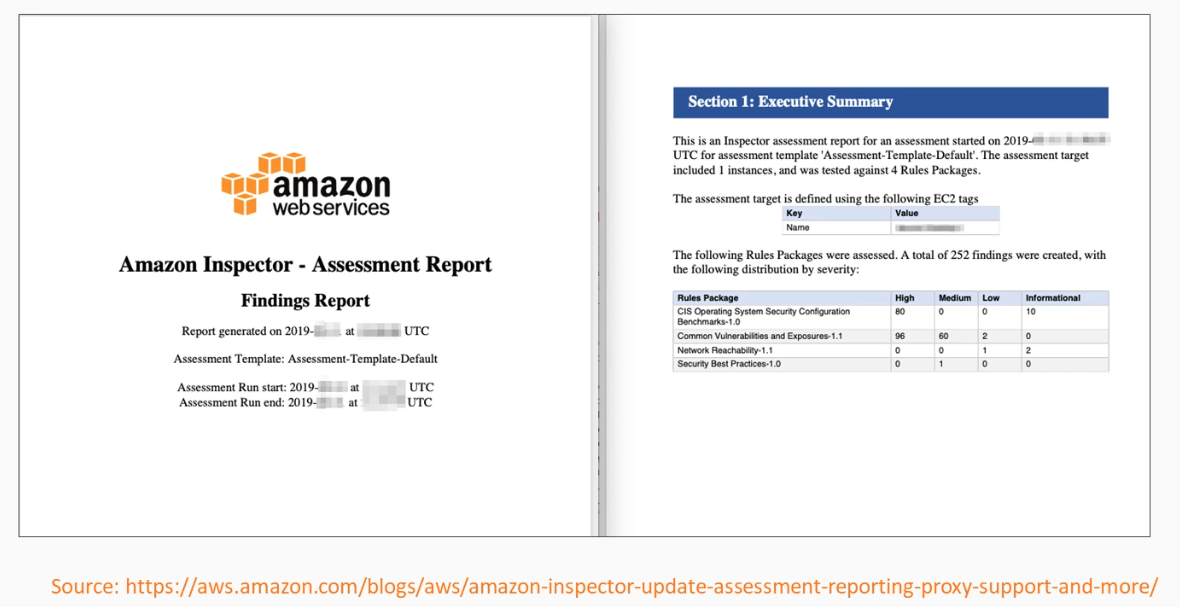
- assessement report can be downloaded in either HTML or PDF format
Assessments are based on best practices and known security weaknesses covering:
- Common vulnerabilities and Exposures (CVEs)
- Center for Internet Security (CIS) Benchmarks
- Security Best Practices
- Runtime Behavior Analysis
Agent Based
Amazon Inspector requires software agents to be installed on any EC2 instance that you want to assess. This makes it an easy service to be configured and added at any point to existing resources already running within your AWS infrastructure. This helps Amazon Inspector to become a seamless integration with any of your existing security processes and procedures as another level of security.
Types of assessments
- Network assessments - check for ports reachable from outside the VPC
- Host assessments - check for vulnerabilities in software (CVE)
- Security best practices for configuration
Assessment report sample
How to get started
- Install the AWS Inspector agent in your EC2 instances
- Create an assessment target using tags (which to inspect?)
- Create an assessment template (What rules to run?)
- Execute the assessment run
- Review all findings
Key Components
Amazon Inspector has the following components and elements:
- Amazon Inspector Role
- Assessment Targets
- AWS Agents
- Assessment Templates
- Rule Packages
- Assessment Runs
- Telemetry
- Assessment Reports
- Findings
Amazon Inspector Role
When you first start using Amazon Inspector, you are required to create or select a role to allow Amazon Inspector to have read-only access to all of your EC2 instances. Without this role, the service would not have the relevant permissions to be able to gather the telemetry data of the instance during any assessment runs.
If you allow Amazon Inspector to create a role, then it will have a policy attached as detailed below:
{
    "Version": "2012-10-17",
    "Statement": [
        {
            "Effect": "Allow",
            "Action": [
                "ec2:DescribeInstances"
            ],
            "Resource": [
                "*"
            ]
        }
    ]
}
This allows the role to have read-only access to all EC2 instances within your AWS account. For more information on IAM and IAM roles, please see our existing course here. Assessment Targets.
Assessment Targets
An Assessment Target is a grouping of AWS EC2 instances that you want to run an assessment against. This grouping of EC2 instances are managed and defined by the tags that are associated to your EC2 instance. Tagging is simply a way of adding metadata to your instances to help with management and organization, consisting of a key value pair.
When creating an assessment target, you are asked to select which keys from your tags that you would like to include within your Assessment Target. You can also refine your selection even further by providing the values for each of those keys, too.
The EC2 instances are not required to contain both keys to be included within this Assessment Target. Only a match of one key is necessary. AWS Agents.
AWS Agents
AWS Agents are software agents that must be installed on EC2 instances that you with to monitor and run the assessments on. Without this agent, Amazon Inspector would not be able to perform the analysis that it needs to.
Once installed, the agent will be able to track and monitor data across the network file system, and any process activity of the instance. This data is then recorded as telemetry data, and is fed back to the Amazon Inspector service via the public endpoint of the service over a TLS-protected channel (Transport Layer Security).
A regular heartbeat is sent from the agent to Inspector, which the Inspector service will respond to with instructions, such as to perform an assessment at a particular time.
As the Agent is software-based, it is necessary from time to time to update the agent with the latest version. These new updates are managed and automatically installed by AWS, and so you don’t need to worry about the latest Agent software version.
Assessment Templates
An assessment template defines a specific configuration as to how an assessment is run on your EC2 instances. These configurable items within the template include the following.
- Rules packages to be used during the assessment
- Duration of the assessment run, which can be:
- 15 minutes
- 1 hour (recommended)
- 8 hours
- 12 hours
- 24 hours
- Specific SNS topics notifications
- when assessment starts
- when it finishes
- when it changes state
- when findings are reported.
- Attributes that can be assigned to findings generated by the assessment.
Once your assessment template is created, you are not able to modify it again to make changes. You can, however, tag your assessment templates to help with the organization and management of your assessment runs.
Rules Packages
When Amazon Inspector gathers telemetry during an assessment run, it will then compare this data against specific security rules to ascertain its compliance. And these rules are grouped together in what is known as a rules package. A rules package contains a number of individual rules that are each checked against the telemetry data back from the EC2 instance.
Each rule will also have an associated severity which will be one of the following:
-
High - Highest severity level, should be looked at immediately and rectified
-
Medium - Should be attended to in a timely manner
-
Low - Need to be rectified, but the urgency is not as severe as medium or high.
-
Informational - Describes a particular security configuration within your assessment target
The rule packages themselves are split across four different categories, these being:
- Common Vulnerabilities and Exposures
- Center for Internet SecurityBenchmarks
- Security Best Practices
- Runtime Behavior Analysis
Common Vulnerabilities and Exposures The CVE is a publicly-known reference list of security threats that are well-documented. The rules used within this package will check the Assessment Target for exposure to any known security holes that would compromise the integrity, confidentiality, and availability of your EC2 instance.
Should any findings from an assessment be found against a CVE, it’s recommended you visit this site and search for specific vulnerability ID to gather additional detailed information to help you resolve and mitigate the issue. To check which CVEs the rules within the rules package are performing an assessment against, you can visit the following link.
https://cve.mitre.org/
As new CVEs are found, they are added to this list by AWS, and the corresponding rules added to the rules package, preventing the need for you to stay up-to-date with the latest known security issues.
Center for Internet Security Benchmarks These benchmarks are continuously refined and used as global standards for best practices for protecting data and IT resources. AWS is a CIS Benchmarks member company, and Amazon Inspector’s associated certifications can be found here:
https://www.cisecurity.org/partner/amazon-web-services/
The rules within this rule package help to assess security for the various operating systems. If any findings are made against this rules package, then similarly to the CVE list, you can visit the provided link to download the detailed description, explanation, and advice on how to mitigate the security issue found.
Security Best Practices This rules package looks for weaknesses in common security best practices. However, this only applies to Assessment Targets that are running the Linux operating system. At this stage, it’s not possible to run this rules package on any target that has the marks of Windows OS. The following security checks are covered within this rules package.
-
Disable root login over SSH. Checks if the SSH daemon is configured to allow login into your instances root.
-
Support SSH version two only. Checks if the instance is configured to run SSH protocol version one.
-
Disable password authentication over SSH. Checks if password authentication over SSH is configured.
-
Configure password maximum age. Checks if a maximum age for a password has been configured on the instance.
-
Configure password minimum length. Checks if a minimum password length has been configured on the instance.
-
Configure password complexity. Checks if the instance is using a password complexity mechanism for passwords.
-
Enable ASLR. Checks if address space layout randomization is enabled.
-
Enable DEP. Checks if data execution prevention is enabled on the instance.
-
Configuration permissions for systems directories. Ensures that only the root user has right access to system directories.
Assessment Run
As assessment run can happen once you have configured your Amazon Inspector role, installed the agents and configured your Assessment Target and Assessment Templates. Once these components are in place, you are then able to run the configured assessment on your assessment targets. This process is known as the assessment run.

During this time, telemetry data will be sent back to Amazon Inspector and S3 to assess the data against the specified rules packages defined within the assessment template
-
Multiple assessment runs can be run at the same time, but only if the assessment targets do not have any duplicated EC2 instances within them.
-
It is possible to view the progress of the run in addition to stopping, starting, and deleting the run.
Telemetry
Telemetry is a data that is collected from an instance, detailing its configuration, behavior and processes during an assessment run.
Once collected, the data is then sent back to Amazon Inspector in near-real-time over TLS where it is then stored and encrypted on S3 via an ephemeral KMS key. Amazon Inspector then accesses the S3 Bucket, decrypts the data in memory, and analyzes it against any rules packages used for that assessment to generate the findings.
After 30 days, this telemetry data is then deleted using a lifecycle policy attached to the dedicated Amazon Inspector S3 Bucket.
Assessment Reports
On completion of an assessment run, it is possible to generate an assessment report which provides details on what was assessed, and the results of that assessment.
As this feature was only released at the end of April 2017, It’s only possible to generate these reports for any assessment runs that were completed on or after the 25th of April, 2017. There are two different types of reports that you can generate:
-
Findings report - Contains only a subset of the full report.
- summary of the assessment that took place
- list of the EC2 instances that were within the assessment targets
- rules packages that were used from within the assessment template
- detailed report on any findings that occurred.
-
Full report - Contains all of the information from the findings report, in addition to a list of rules that were passed successfully for all the instances within the assessment target.
Findings
Findings are generated from the results of an assessment run. A finding is a potential security issue or risk against one of your EC2 instances within the assessment target. For each finding, an explanation of the issue is given, along with guidance on how to remediate the problem.
Service Limitatins
These are the service limitations per account. Note that you can raise a request to AWS to increase the limits .
- 500 Agents per assessments
- 50,000 Assessment Runs
- 500 Assessment Templates
- 50 Assessment Targets
Athena
Athena is a serverless interactive query service which makes it easy to search and analyze data in AWS S3 using SQL.
- integrated with AWS Glue (data catalog)
- pay per query and per TB of data scanned
- built on top of PrestoDB
- can query data stored in AWS S3
- CloudTrail Logs
- Application Logs
- Business data
- supported data format
- CSV
- JSON
- ORC
- Avro
- Parquet
- Typical use cases:
- enable data-driven decision making
- generate reports
- analuze data without operatino overheads (serverless)
How to get started
- Create an S3 bucket with data in a supported format
- Create an Athena database
- Create an Athen external table pointing to the S3 bucket
- Search data in Athena using normal SQL (Select)
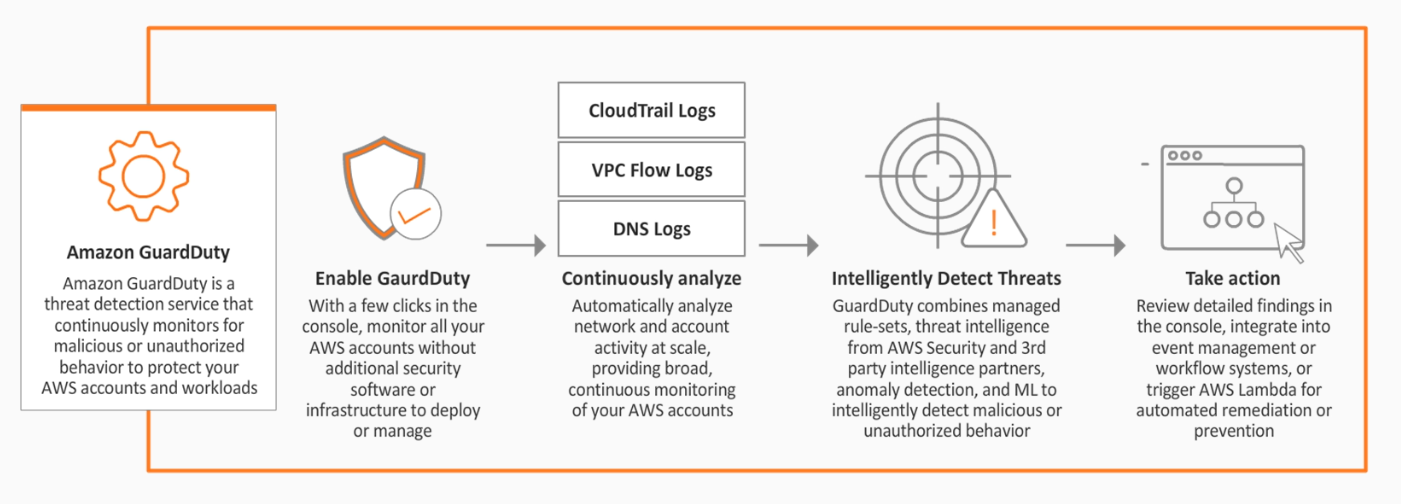
AWS GuardDuty
It is an intelligent threat detection service that uses AI/Machine Learning to monitor one or more AWS accounts for malicious behavior.
- leverages third-party feeds from cybersecurity partners
- automate response and alerting using CloudWatch and Lamdba
- monitors different sources of data:
- CloudTrail
- DNS
- VPC Flow logs
Use-cases
- Reconnaissance
- unusual API activity
- unusual patterns of failed login requests
- Instance compromise
- backdoor command and control (C&C) activity
- Outbound instance communication with known malicious IP
- Account compromise
- Attempts on disabling AWS CloudTrail logging
- unusual instances/infrastructure launches
How to get started
- Easy activation via console
- If threat is detected, it will appear in GuardDuty dashboard and CloudWatch events
- takes 7-14 days to set a baseline
- prices varies according to volume of data
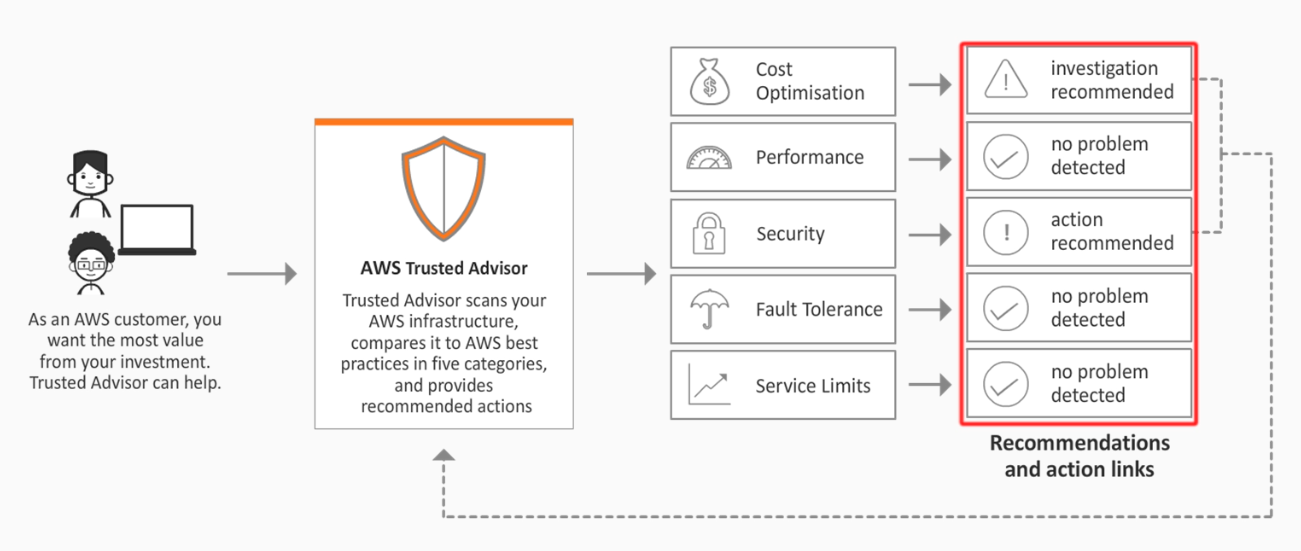
AWS Trusted Advisor
This AWS service provides guidance on how to provision resources following AWS best practices.
- help to reduce cost, increase performance, and improve security
- seven core checks and recommendations by default
- full set of checks only for business and enterprise support plans
The type of AWS account support plan in place determines how many checks AWS Trusted Advisor will perform. All AWS accounts benefit from six Trusted Advisor checks, while accounts with Business or Enterprise support plans have access to over 50 Trusted Advisor checks. Business support plans start at $100 per month.
In the Trusted Advisor, we can see the recommendations in each of the four categories checked by Trusted Advisor.
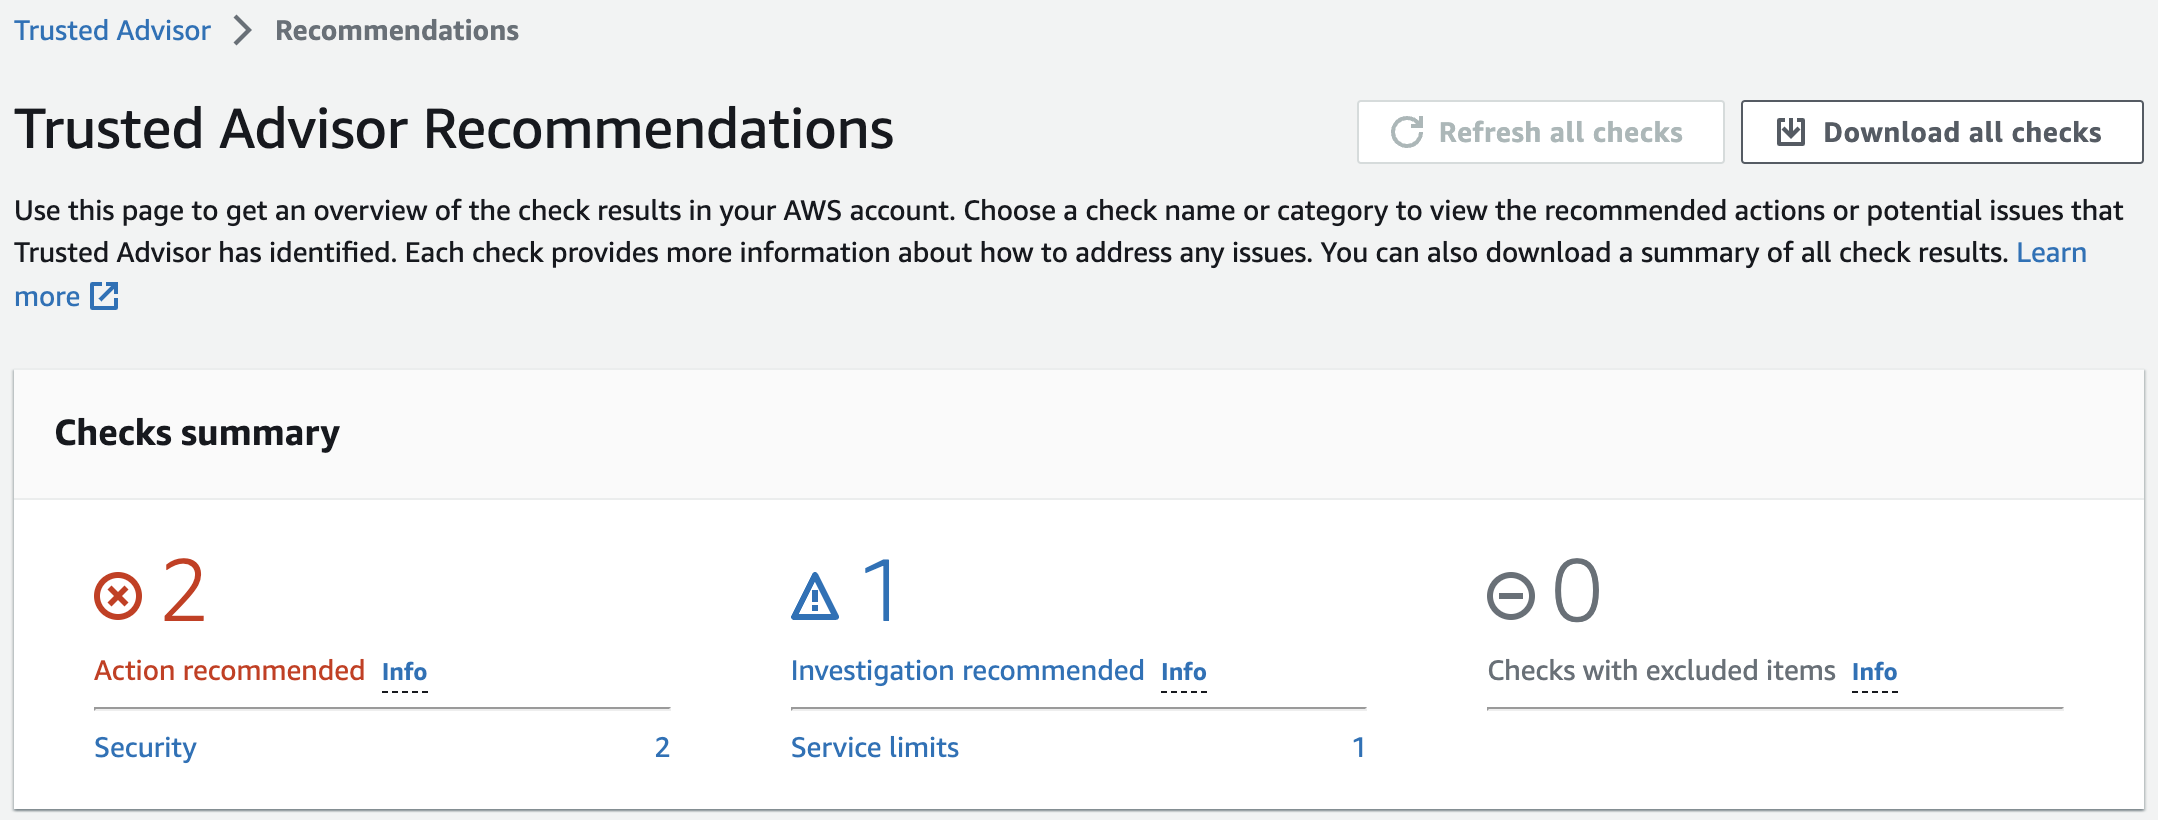
The six checks included without a support plan fall under the Performance and Security categories. Under each category, the number of checks that fall into each recommendation status category are shown. The recommendation statuses by color are:
- Red: Action recommended
- Yellow: Investigation recommended
- Gray : Excluded items
We can also see the recommended actions (if there are any):
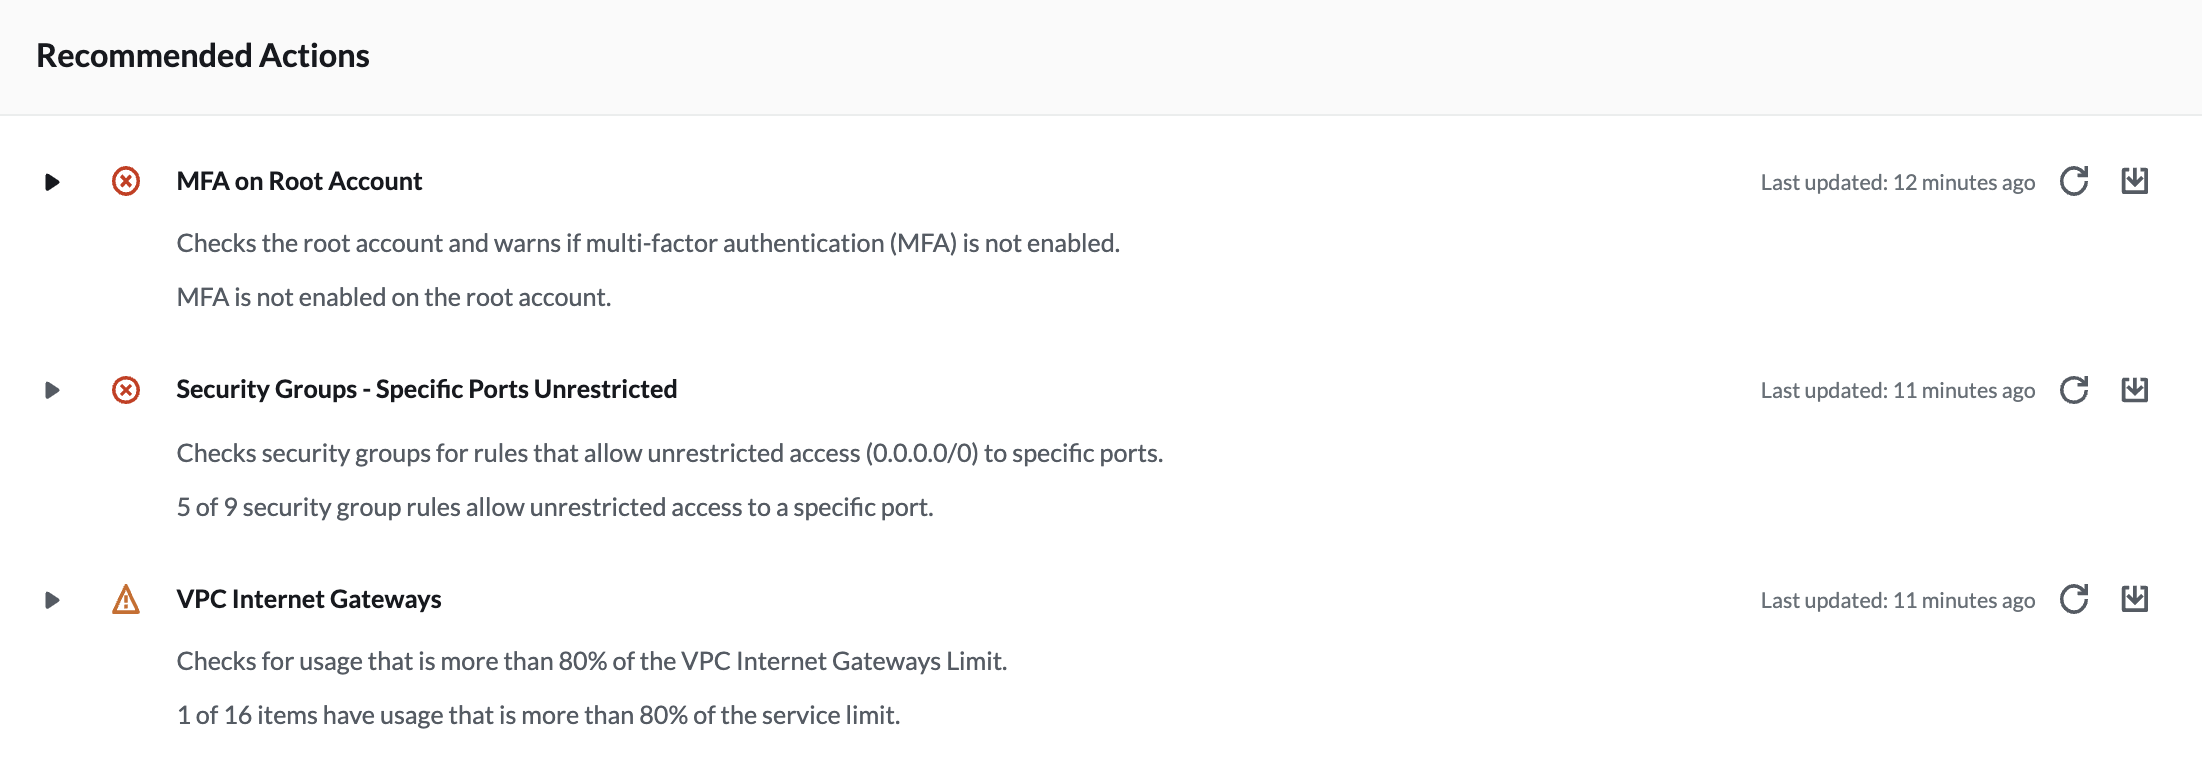
Trusted Advisor will automatically perform all of the checks without manual intervention. This feature is useful because we can trigger CloudWatch Events to send us emails when the status of a check changes. However, the intervals for each check vary greatly.
We can easily get the latest check results in the AWS Management Console by clicking the refresh all button.
Similarly, if we want to export a report with all check results at once, the download all results button is available.
Categories
-
Cost optimization - Helps to identify ways in which you could optimize your resources to help you reduce costs by implementing features such as reserved capacity and removing unused capacity
-
Performance - This reviews your resources to highlight any potential performance issues across your infrastructure, determining if you could take benefits from performance-enhancing capabilities such as provisioned throughput
-
Security - This analyses your environment for any potential security weaknesses or vulnerabilities that could potentially lead to a breach.
-
Fault Tolerance - This helps to suggest best practices to maintain service operations by increasing resiliency, should a fault or incident occur across your resources.
-
Service Limit - This identifies and warns you when your resources reach 80% capacity of their service limit quota.
Security Core checks:
- Security Groups - specific ports unrestricted
- EBS Public Snapshots
- RDS Public Snapshots
- IAM use
- MFA on root account
Features
- Trusted Advisor Notifications - This tracks your resource check changes and cost-saving estimates over the course of a week and e-mail you a report
- Exclude Items - This allows you to select specific resources to be excluded from appearing in the console within a specific check.
- Action Links - Action Links lead you on to remediate any issue identified
- Access Management - Using IAM you can grant different levels of access to Trusted Advisor:
- Full Access
- Read-only
- Restrict access to specific categories, checks, and actions
- Refresh - You can perform a manual refresh 5 minutes after the previous refresh against either individual checks or against all checks
For every check that Trusted Advisor provides, you will see:
- A description
- Alert Criteria
- Recommended Action
- Additional Resources
Security Groups - Specific Ports Unrestricted
The check looks for unrestricted access to ports on inbound traffic. Any unrestricted port is given a status according to the following rules:
-
No action is recommended for web traffic ports 80 (HTTP) and 443 (HTTPS), and mail ports 25 (SMTP) and 465 (SMTPS). That is due to the nature of the web and email which are expected to be accessed from anywhere.
-
Action is recommended for certain file transfer and database ports. It is highly possible these services contain sensitive information and should be secured.
-
Investigation is recommended for all other ports.