Lab: Auto-Instrumentation
Overview
This lab demonstrates how to monitor the performance and availability of a web application. By deploying the app with Application Insights auto-instrumentation enabled, you can automatically collect telemetry data, such as response times, dependencies, and errors—without adding manual instrumentation code.
Deploy the Web App
-
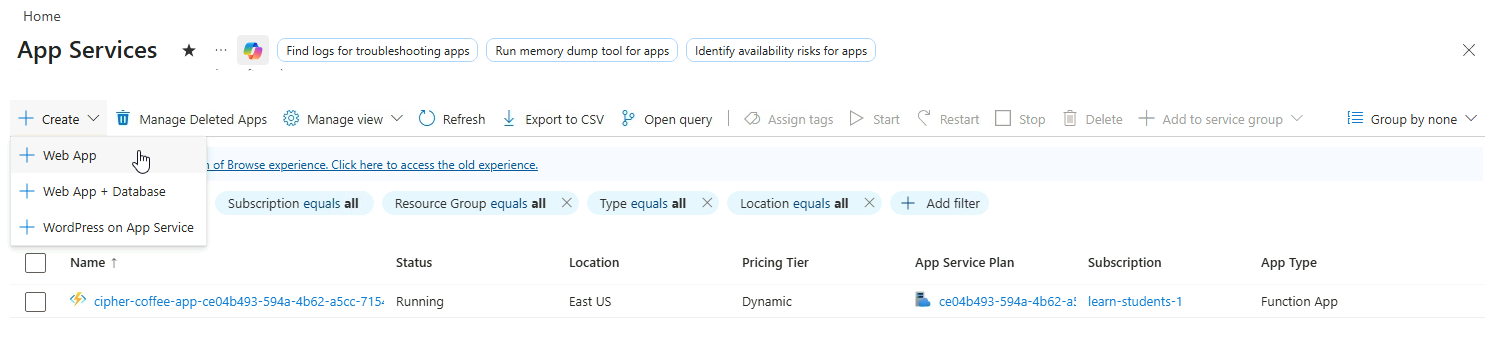
Navigate to App Services in Azure Portal
-
Click Create ➔ Web App
-
Provide a unique name for your web app and fill in the details.
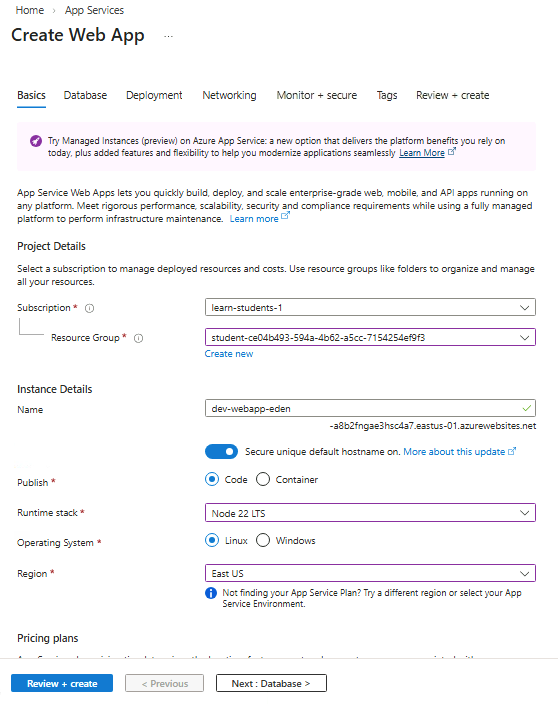
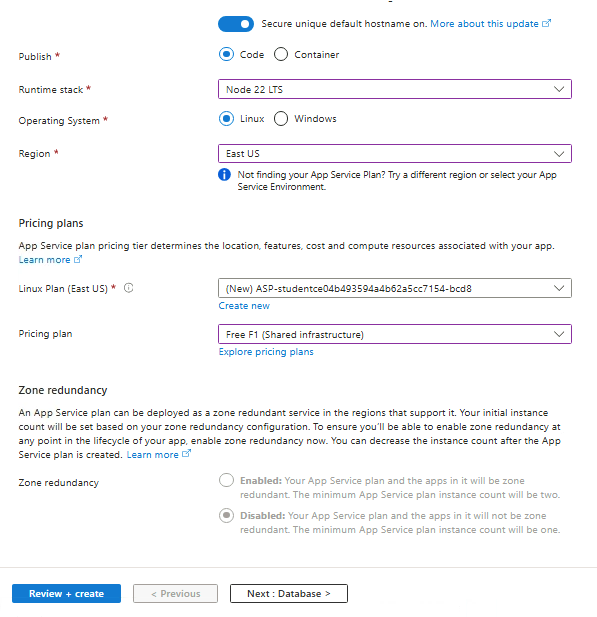
Optional: You can also set the pricing plan to use at the bottom of the page.
-
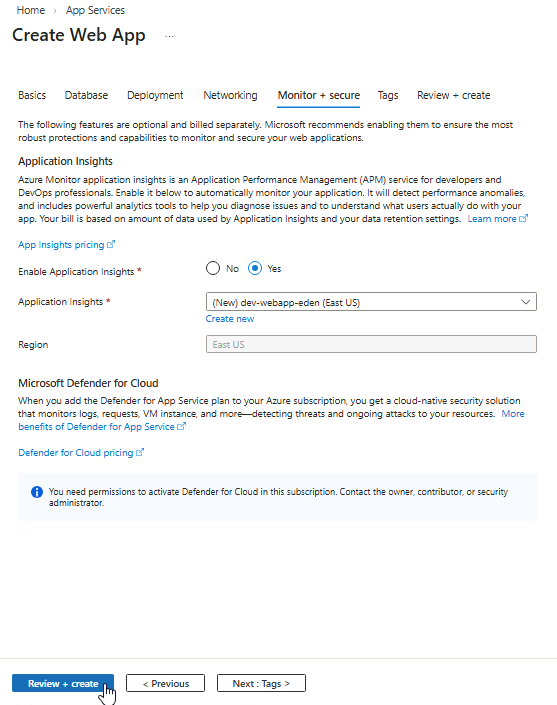
Under Monitor + secure, enable Application Insights to automatically collect telemetry data.
Click Review + create then Create.
-
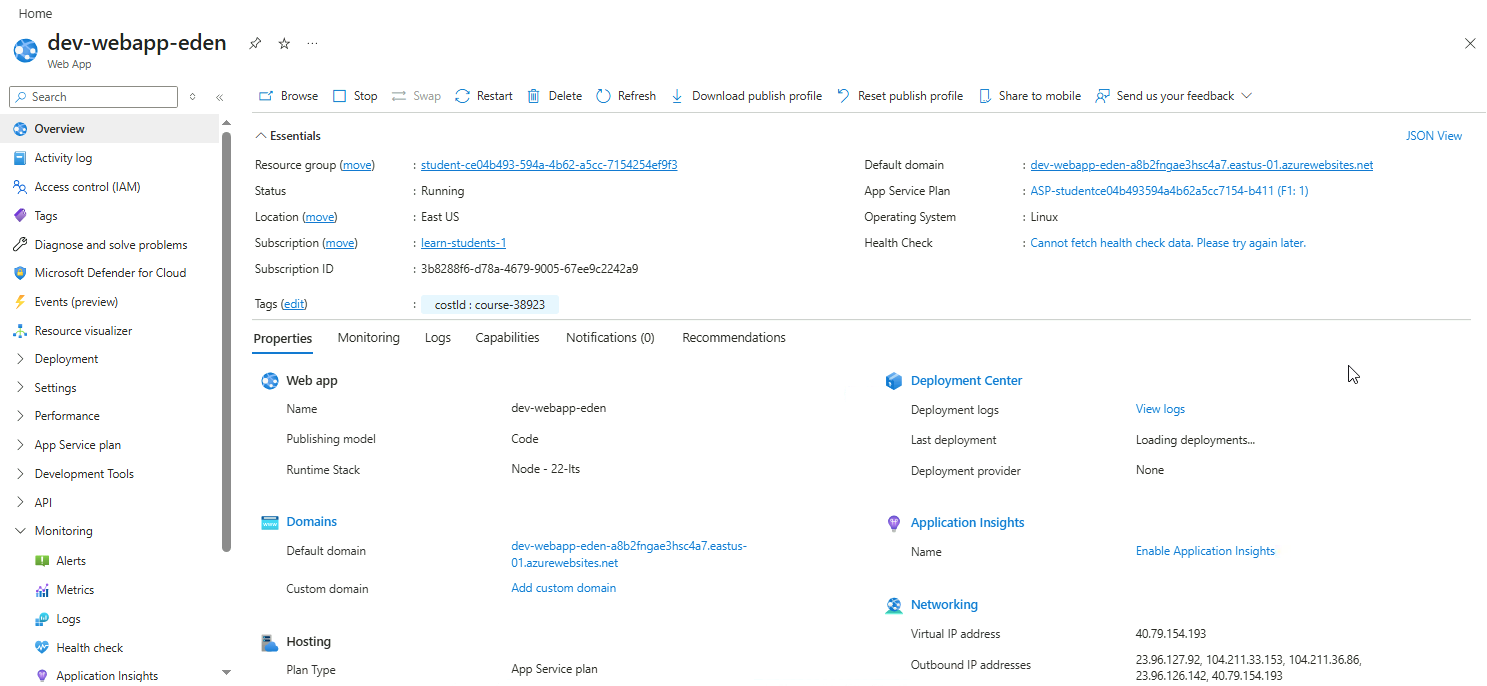
Once deployment completes, navigate to the newly created web app.
Exploring Metrics
-
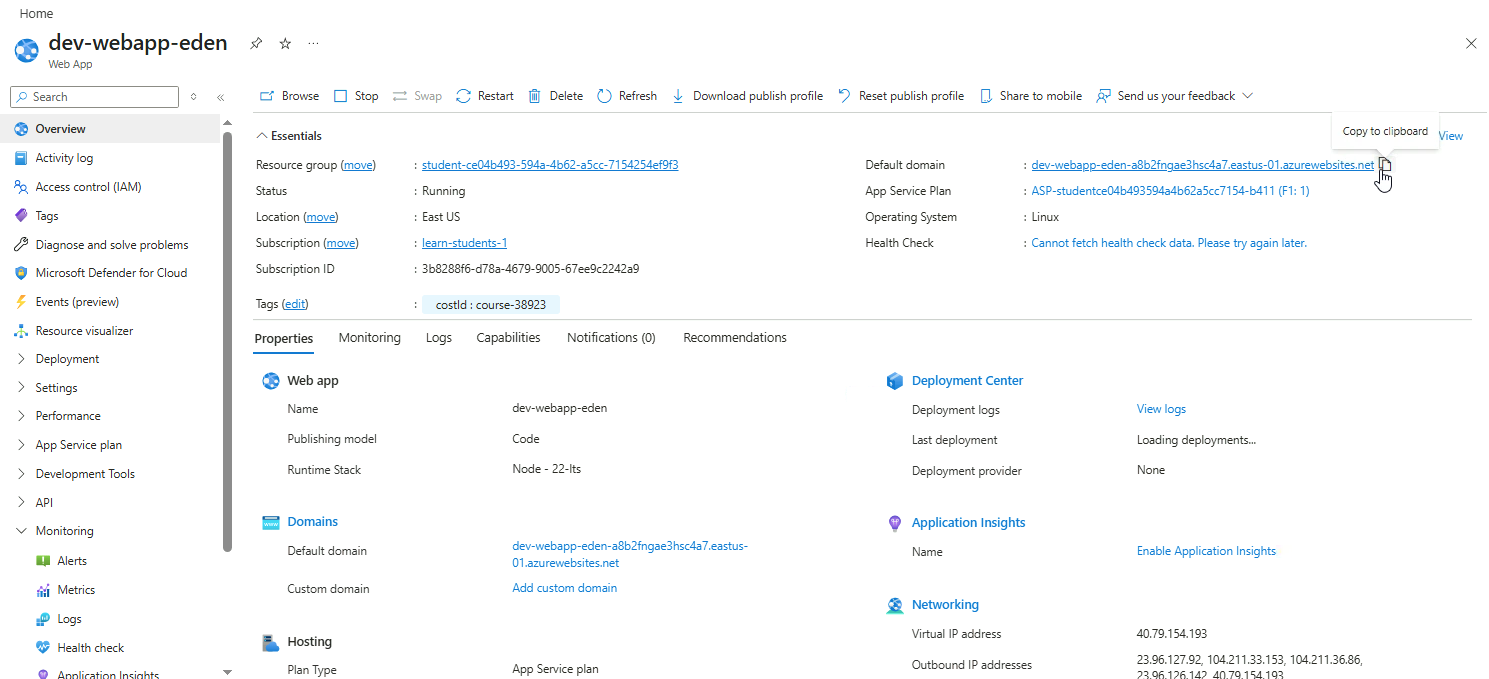
Open you web app and copy the defaul domain URL.
-
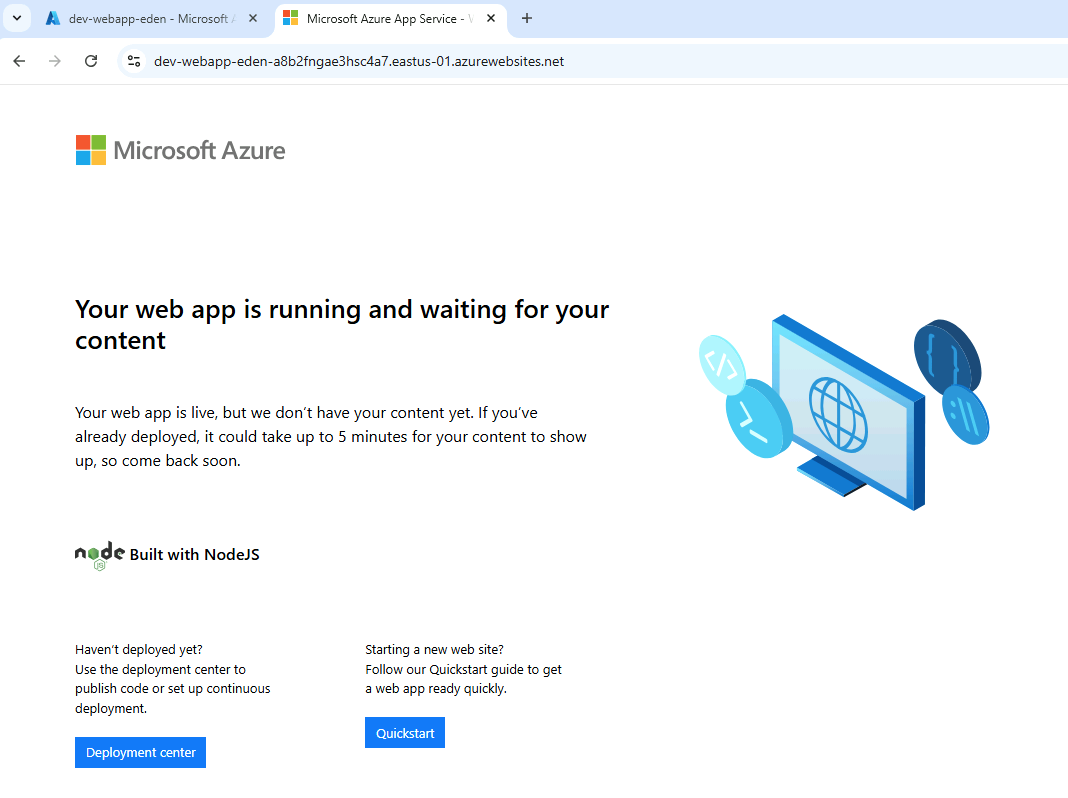
Open the web app URL in a separate tab.
Refresh the page a few times to generate traffic.
-
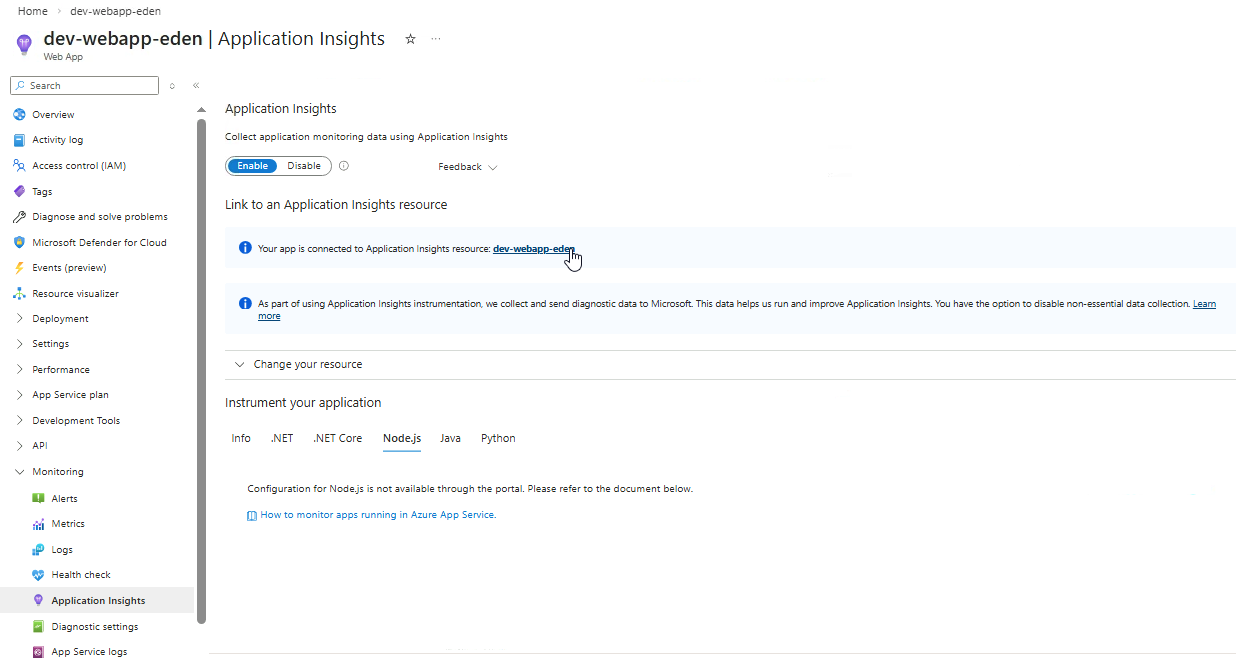
Go back to your web app in Azure portal and go to Monitoring ➔ Application Insights
Click the linked application insights.
-
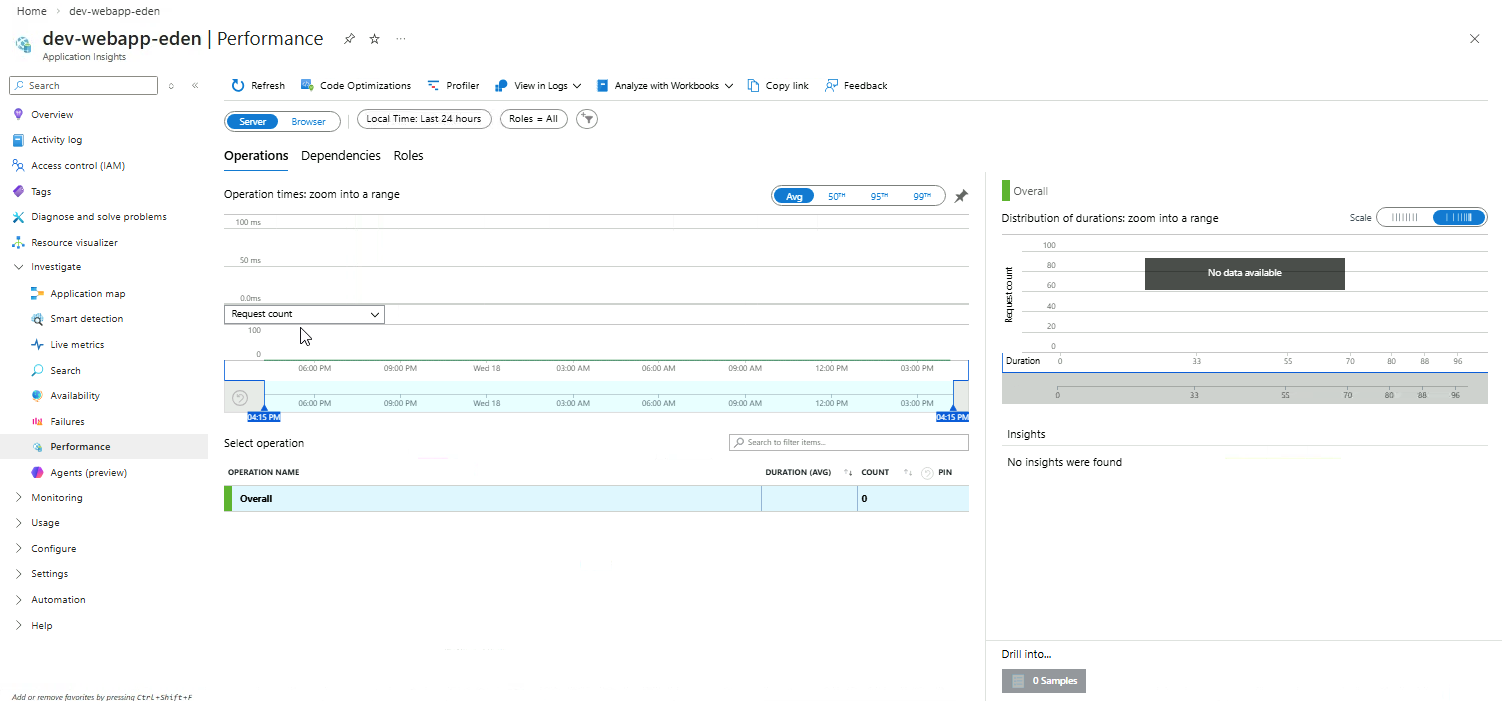
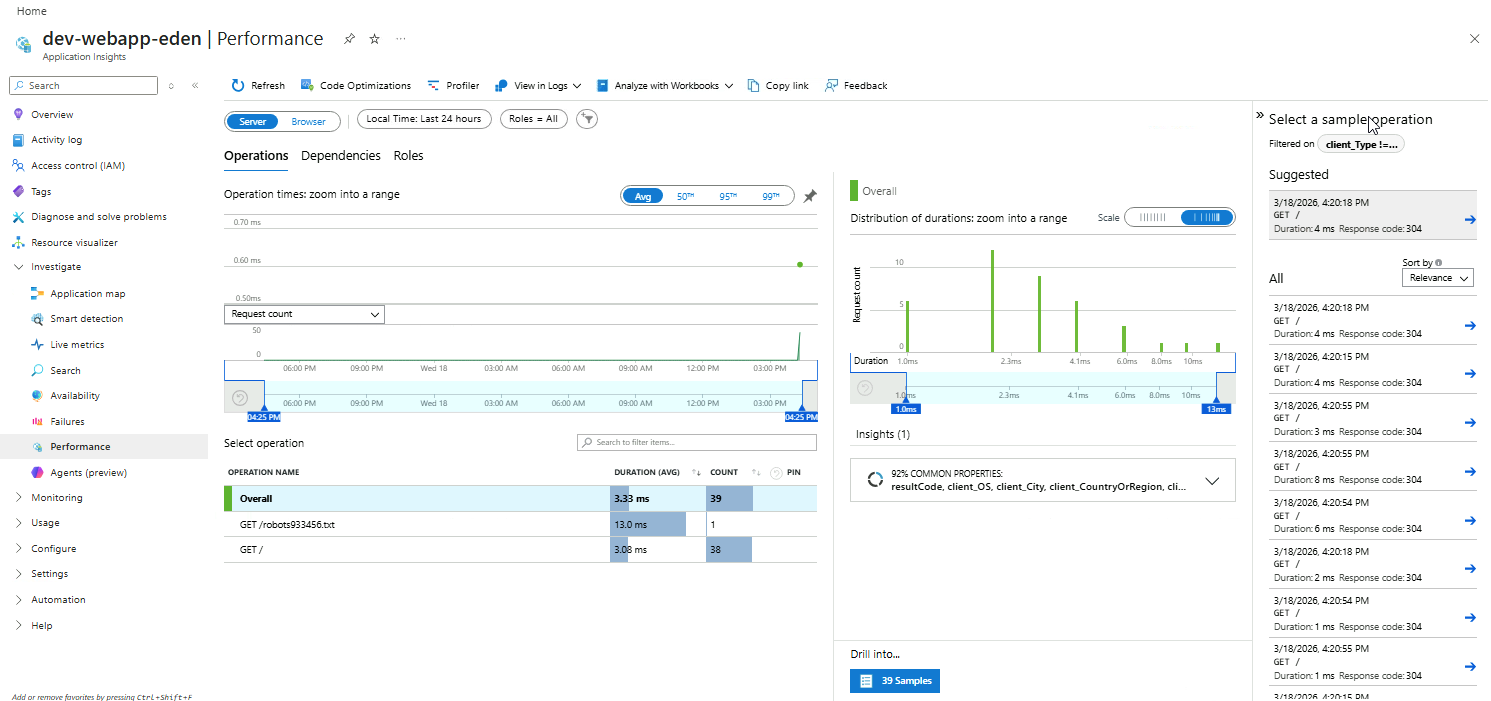
In the Application Insights resource, go to Investigate ➔ Performance.
Here we can se the request counts, duration of each operation, and the performance timeline.
-
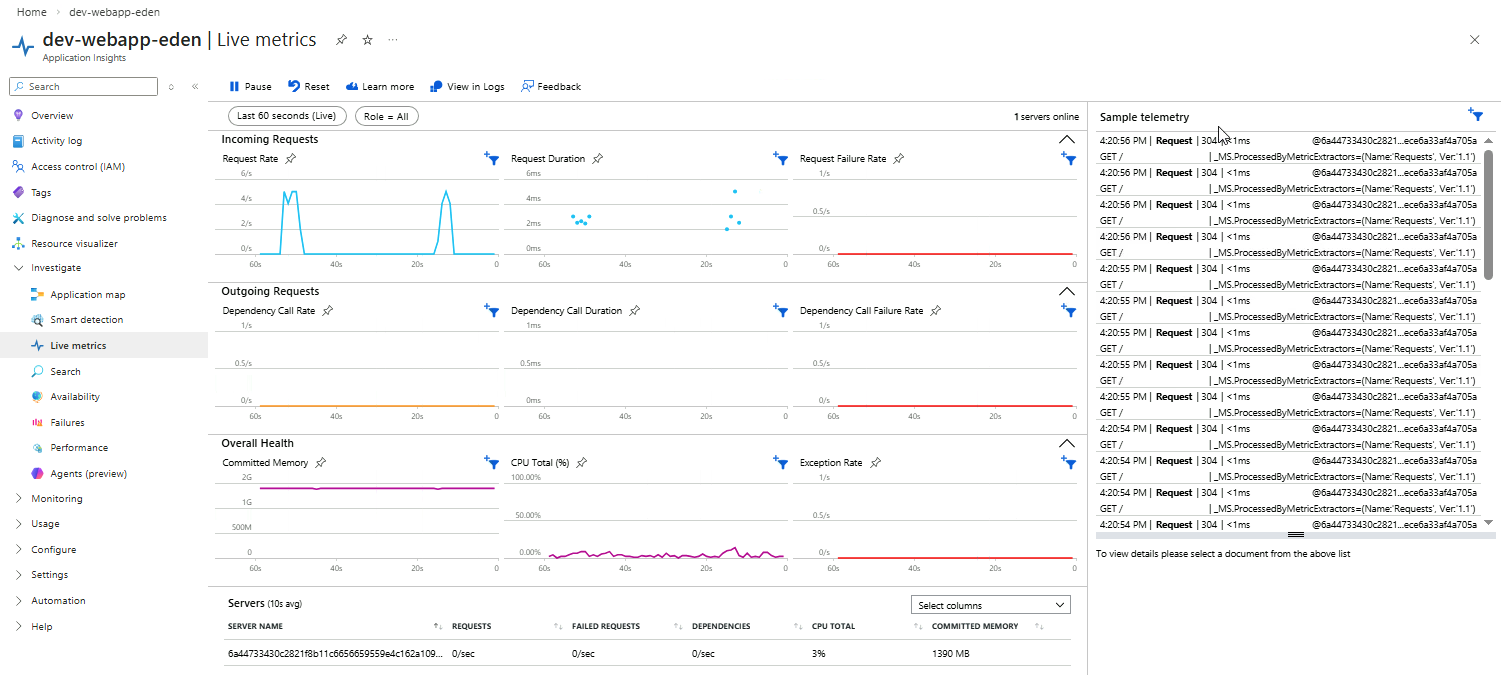
Go to Investigate ➔ Live Metrics and view the real-time telemetry.
Here, we can see the request rates, response times, server health, etc.
Note: To generate more traffic, go back to the web page and refresh for a couple more times.
-
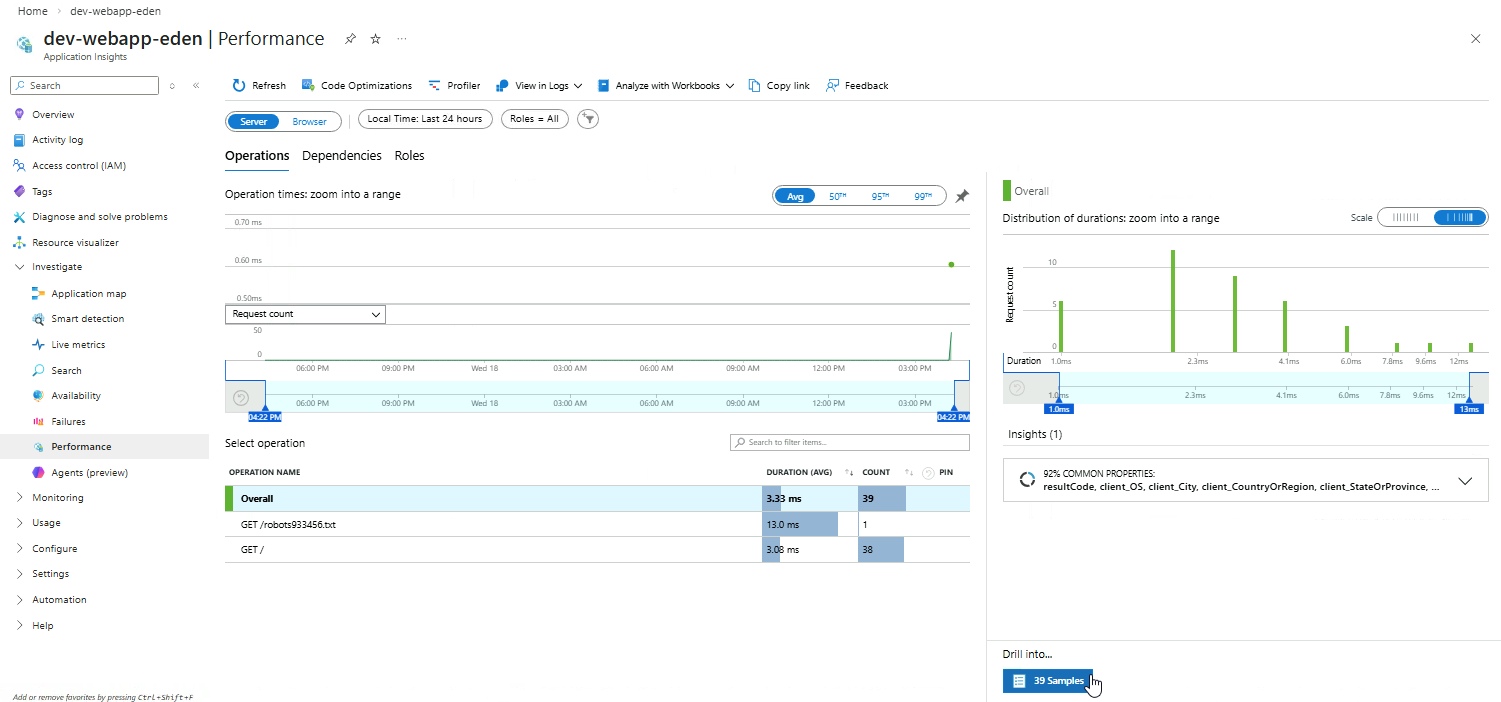
Go back to Performance and click Drill intro...samples.
These are example requests or transactions that have been captured by Application Insights. They show real or simulated telemetry for the app.
-
You can select any of the sample operations here.
Clicking a sample operation lets you drill into a specific request or transaction to see:
- Duration / response time
- Dependencies and their performance
- Any exceptions thrown
- Call stack or operation details
- Timeline of events for that request
Example:
-
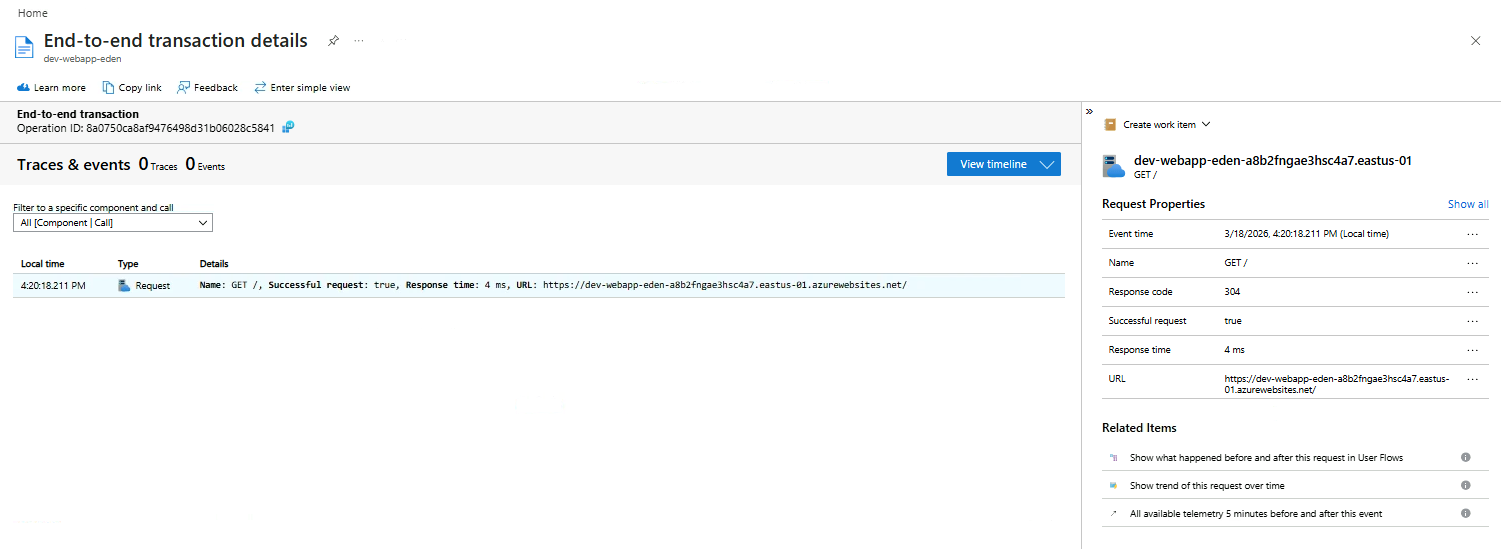
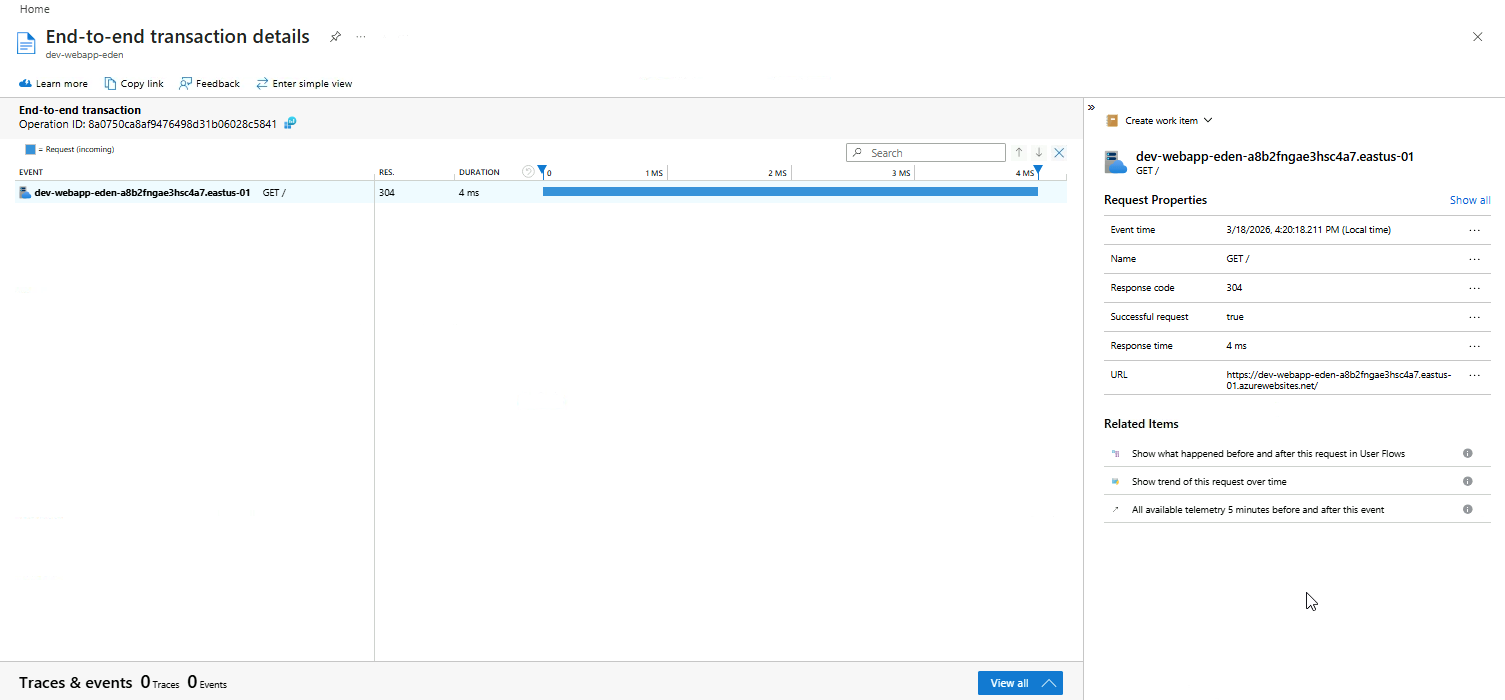
You should see the End-to-end transaction details for the specific operation.
This view shows a detailed trace of a single request, including all its dependencies and timings.
-
Click View all to see the traces and events for the operation.
The traces, dependencies, and events captured for that operation provides you a full picture of how the request flowed through your app.