All-Things-Docker-and-Kubernetes
Lab 052: EKS and CloudWatch Logging
- Pre-requisites
- Introduction
- Enabling CloudWatch Logging through the Manifest
- Enabling CloudWatch Logging through the Console
- Disable CloudWatch Logging
- CloudWatch Metrics - Container Insights
- Cleanup
Pre-requisites
Introduction
Since the Control Plane is managed by AWS, we don’t have access to the hosts that are serve the Control Plane and manages the logs.
We can access these logs thru CloudWatch by enabling which log type to send. To learn more, check out this page.
For this lab, we’ll be using ap-southeast-1 region (Singapore).
Enabling CloudWatch Logging through the Manifest
Let’s reuse the eksops.yml from Lab50 in this repo.
apiVersion: eksctl.io/v1alpha5
kind: ClusterConfig

metadata:
    version: "1.22"
    name: eksops
    region: ap-southeast-1

nodeGroups:
    -   name: ng-dover
        instanceType: t2.small
        desiredCapacity: 3
        ssh:
            publicKeyName: "k8s-kp"
Let’s first create the cluster.
$ eksctl create cluster -f eksops.yml
Save the cluster-name and region in variables becase we’ll use them for the rest of this lab.
$ export MYCLUSTER=eksops
$ export MYREGION=ap-southeast-1
We’ll add the cloudwatch block that enables three log types.
cloudWatch:
    clusterLogging:
        enableTypes:
            - "api"
            - "audit"
            - "authenticator"
Note that if you want to enable all logtypes, simply put an ‘*” in enableTypes
cloudWatch:
    clusterlogging:
        enableTypes: ["*"]
The new eksops.yml should now look like this:
apiVersion: eksctl.io/v1alpha5
kind: ClusterConfig

metadata:
    version: "1.22"
    name: eksops
    region: ap-southeast-1

nodeGroups:
    -   name: ng-dover
        instanceType: t2.small
        desiredCapacity: 3
        # minSize: 2
        # maxSize: 5
        ssh:
            publicKeyName: "k8s-kp"

cloudWatch:
    clusterLogging:
        enableTypes:
            - "api"
            - "audit"
            - "authenticator"
To update the cluster, run the command below. Add the “–approve” to apply the changes. If this not specified, it will do a dry-run of the changes but will not apply them.
$ eksctl utils update-cluster-logging \
    --config-file eksops.yml \
    --approve
This should return the following output.
2022-08-25 08:56:35 [ℹ]  will update CloudWatch logging for cluster "eksops" in "ap-southeast-1" (enable types: api, audit, authenticator & disable types: controllerManager, scheduler)
2022-08-25 08:57:07 [✔]  configured CloudWatch logging for cluster "eksops" in "ap-southeast-1" (enabled types: api, audit, authenticator & disabled types: controllerManager, scheduler)
Switch over to the CloudWatch dashboard in the AWS Management Console and go to Log groups. Click the newly create log group.

Inside this log group, we can see that the log streams have been created. Click the kube-api-server-xxxx log stream.

Scroll down to view the most recent event. Click the event to view it in JSON format.
Enabling CloudWatch Logging through the Console
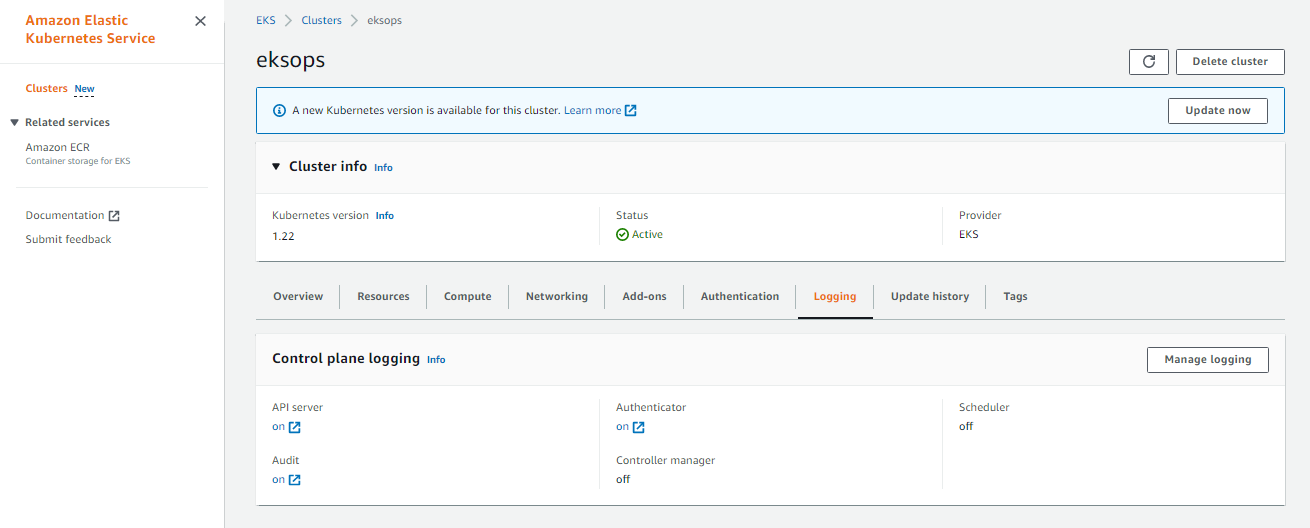
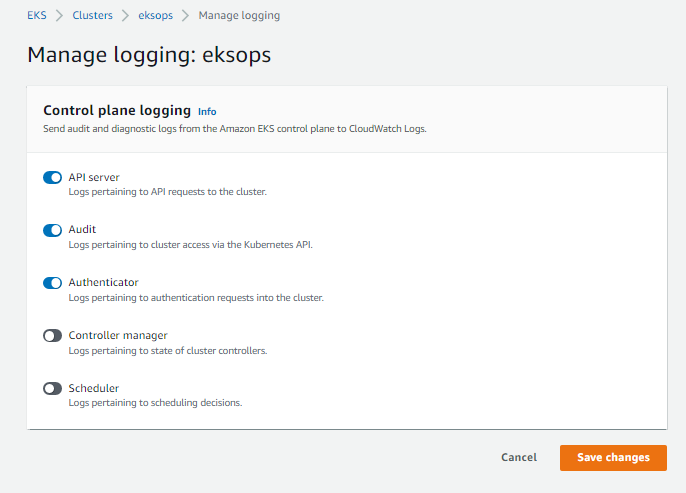
The logging can also be enabled through the AWS Management Console.
- Go to the EKS dashboard
- Click Clusters in the left menu.
- Select the cluster name.
- Scroll down to the Logging sections
- Enable specific log types by clicking Update
Here’s a sample.
As a reminder, CloudWatch logging adds costs on top of your EKS resources costs.
Disable CloudWatch Logging
Disabling the CloudWatch logging can be done through the CLI or the console.
$ eksctl utils update-cluster-logging \
    --name=eksops \
    --disable-types all \
    --approve
CloudWatch Metrics - Container Insights
Let’s now add container sights in CloudWatch metrics. Here are the steps to follow:
- Add IAM policy to access the CW agent to nodegroup roles
- Deploy the CloudWatch agent on each node
- View the metrics
- Generate load.
To learn more about Container Insights, check out the Using Container Insights page.
Attach IAM Policy to Nodegroup Role
Similar with CloudWatch logging, enabling the metrics also adds costs to your bill for storage and collection.
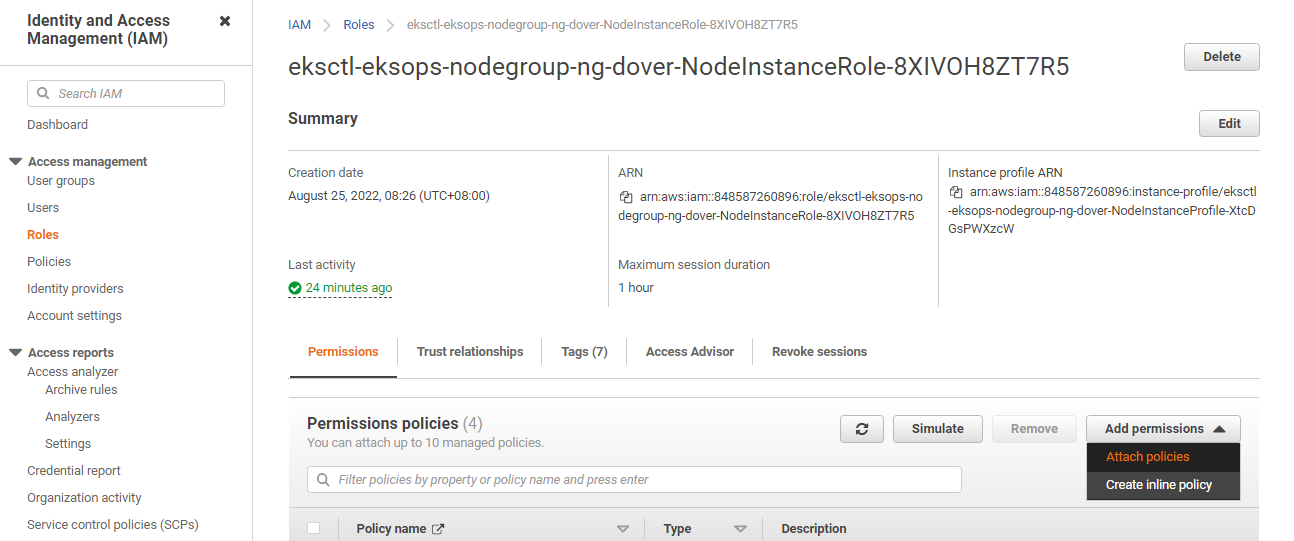
To start with, go to IAM the dashboard and click Roles on the left menu. Search for “eksctl”. Select the NodeInstanceRole.

Notice that there’s a role for this node group. A role is created for each node group. If you have three node groups, then you’ll see three NodeInstanceRole here.
This is important to know because we need to attach the policy to each node group. In our case, we only have one existing nodegroup so we’ll only need to attach the IAM policy to the node group’s role.
In the Permisions tab, click Add permissions.
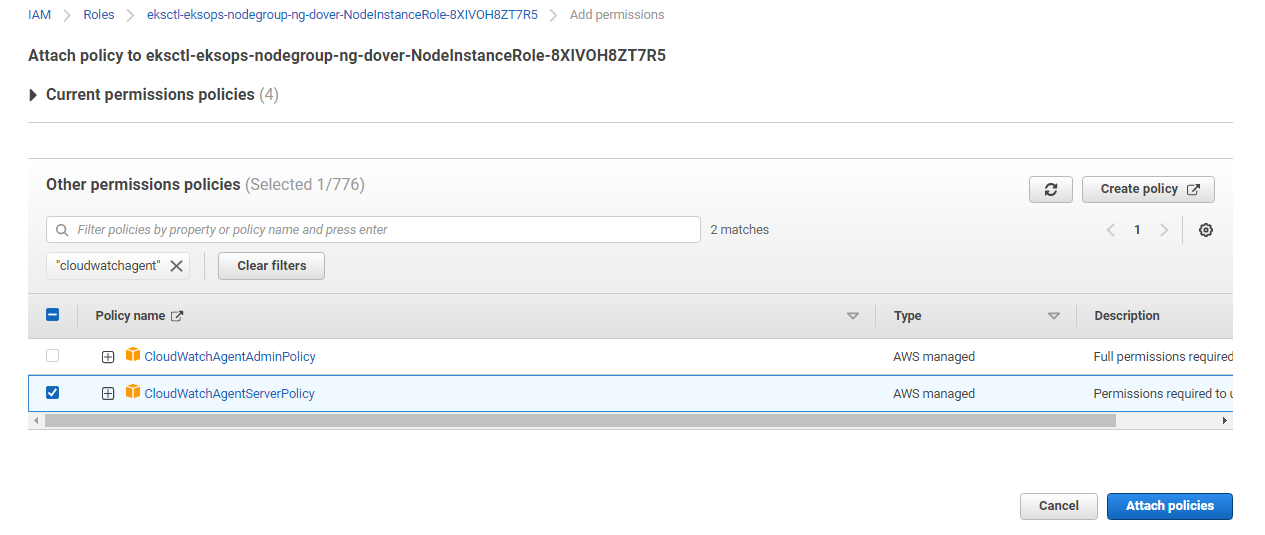
Search for “cloudwatchagentserver”, select the permission and click Attach policies.
Deploy the CloudWatch Agent
We’ll use the quickstart sample file from AWS and we’ll replace the cluster-name and region with our own. To learn more, read the Quick Start with the CloudWatch agent and Fluent Bit.
Set the variables first.
ClusterName=$MYCLUSTER
LogRegion=$MYREGION
FluentBitHttpPort='2020'
FluentBitReadFromHead='Off'
Pull the image down to our cluster and deploy the agent.
[[ ${FluentBitReadFromHead} = 'On' ]] && FluentBitReadFromTail='Off'|| FluentBitReadFromTail='On'

[[ -z ${FluentBitHttpPort} ]] && FluentBitHttpServer='Off' || FluentBitHttpServer='On'

curl https://raw.githubusercontent.com/aws-samples/amazon-cloudwatch-container-insights/latest/k8s-deployment-manifest-templates/deployment-mode/daemonset/container-insights-monitoring/quickstart/cwagent-fluent-bit-quickstart.yaml | sed 's//'${ClusterName}'/;s//'${LogRegion}'/;s//"'${FluentBitHttpServer}'"/;s//"'${FluentBitHttpPort}'"/;s//"'${FluentBitReadFromHead}'"/;s//"'${FluentBitReadFromTail}'"/' | kubectl apply -f -
It should return the following output. It created a new namespace, amazon-cloudwatch and other resources in it.
namespace/amazon-cloudwatch created
serviceaccount/cloudwatch-agent created
clusterrole.rbac.authorization.k8s.io/cloudwatch-agent-role unchanged
clusterrolebinding.rbac.authorization.k8s.io/cloudwatch-agent-role-binding unchanged
configmap/cwagentconfig created
daemonset.apps/cloudwatch-agent created
configmap/fluent-bit-cluster-info created
serviceaccount/fluent-bit created
clusterrole.rbac.authorization.k8s.io/fluent-bit-role unchanged
clusterrolebinding.rbac.authorization.k8s.io/fluent-bit-role-binding unchanged
configmap/fluent-bit-config created
daemonset.apps/fluent-bit created
Let’s check the resources that’s been generate for this namespace.
$ kubectl get all -n amazon-cloudwatch
NAME                         READY   STATUS    RESTARTS   AGE
pod/cloudwatch-agent-4cthc   1/1     Running   0          2m28s
pod/cloudwatch-agent-c6rp8   1/1     Running   0          2m28s
pod/cloudwatch-agent-z2kvs   1/1     Running   0          2m28s
pod/fluent-bit-chfxm         1/1     Running   0          2m27s
pod/fluent-bit-d9w55         1/1     Running   0          2m27s
pod/fluent-bit-llff8         1/1     Pending   0          2m28s

NAME                              DESIRED   CURRENT   READY   UP-TO-DATE   AVAILABLE   NODE SELECTOR   AGE
daemonset.apps/cloudwatch-agent   3         3         3       3            3           <none>          2m29s
daemonset.apps/fluent-bit         3         3         2       3            3           <none>          2m29s
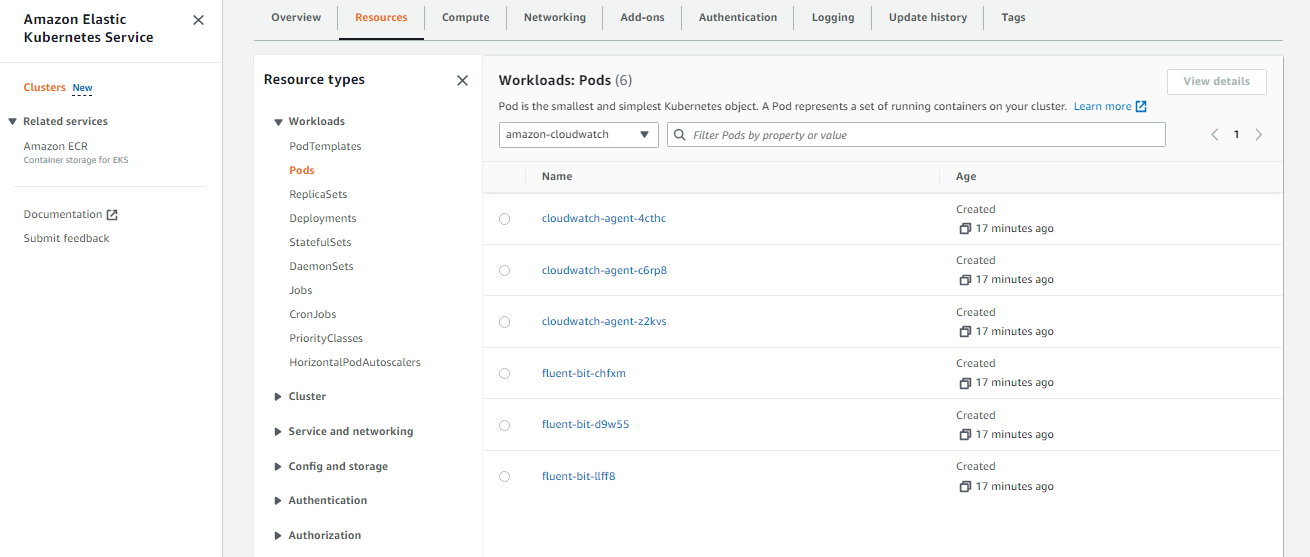
From the output above, we can see that 6 pods were created, and the CloudWatch agent and fluent-bit is installed on all 3 nodes.
We can also verify this from the AWS Management Console. Go to the EKS dashboard, click the Clusters on the left menu, and select your cluster. Click the Resources tab and from the All Namespace dropdown bar, select amazon-cloudwatch.
View the Metrics
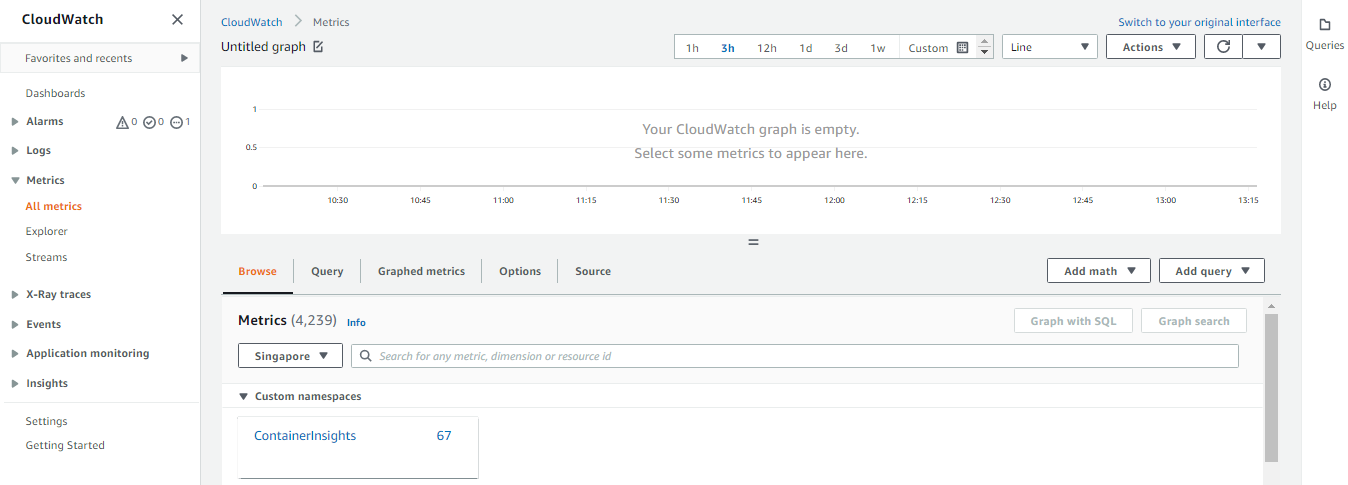
In the AWS Management Console, go to the CloudWatch dashboard. Select Metrics > All metrics. Click the ContainerInsights metrics.

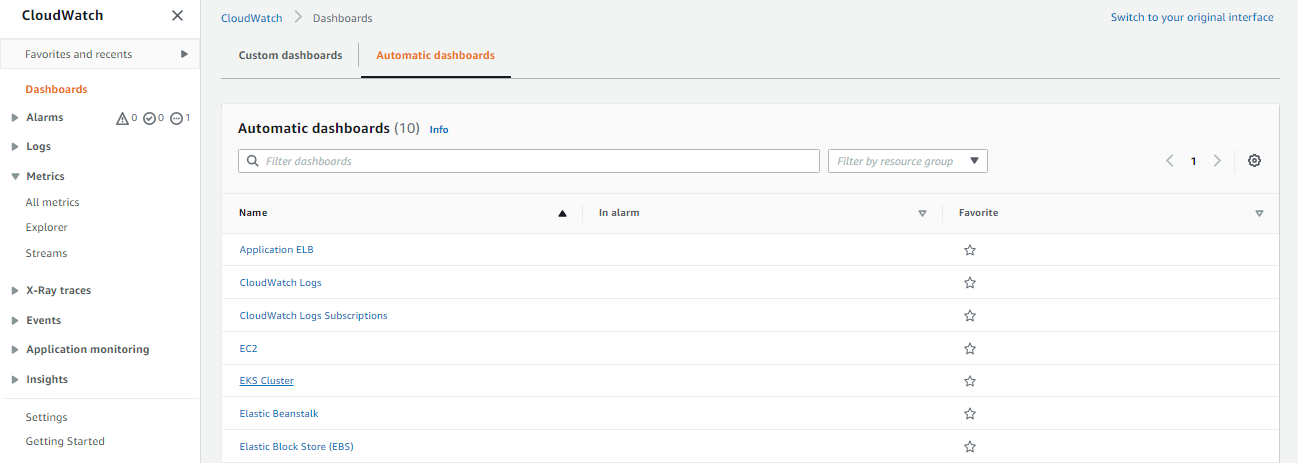
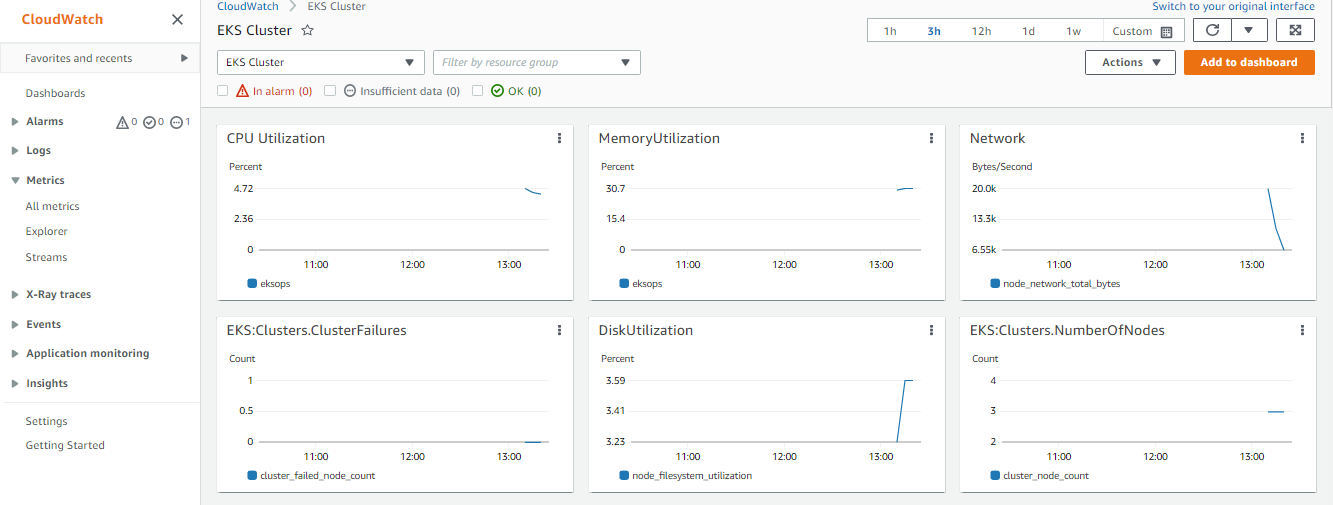
In the left menu, click Dashboards > Automatic dashboards > EKS cluster.
This dashboard gives us a general overview of the cluster state.
Generate Load
To make sure that the Container Insights is working, we’ll deploy a HorizontalPodAutoscaler automatically scales the workload resource to match the demand. For this section, we’ll follow the HorizontalPodAutoscaler Walkthrough guide.
Install the Metrics Server
Before we proceed, recall that we’ve been using Kubernetes version 1.22 since the start of this lab. We will need to install the Kubernetes Metrics Server which will collect resource metrics from Kubelets and exposes them in Kubernetes apiserver through Metrics API for use by Horizontal Pod Autoscaler and Vertical Pod Autoscaler.
$ kubectl apply -f https://github.com/kubernetes-sigs/metrics-server/releases/latest/download/components.yaml
This should return the following output.
serviceaccount/metrics-server created
clusterrole.rbac.authorization.k8s.io/system:aggregated-metrics-reader created
clusterrole.rbac.authorization.k8s.io/system:metrics-server created
^[[Orolebinding.rbac.authorization.k8s.io/metrics-server-auth-reader created
clusterrolebinding.rbac.authorization.k8s.io/metrics-server:system:auth-delegator created
clusterrolebinding.rbac.authorization.k8s.io/system:metrics-server created
service/metrics-server created
deployment.apps/metrics-server created
apiservice.apiregistration.k8s.io/v1beta1.metrics.k8s.io created
Run and expose php-apache server
Once the metrics server is installed, we can proceed with following the HorizontalPodAutoscaler Walkthrough guide.
Let’s use this manifest which will pull the hpa-example image and expose it as a Service.
php-apache.yml
```yaml apiVersion: apps/v1 kind: Deployment metadata: name: php-apache spec: selector: matchLabels: run: php-apache replicas: 1 template: metadata: labels: run: php-apache spec: containers: - name: php-apache image: registry.k8s.io/hpa-example ports: - containerPort: 80 resources: limits: cpu: 500m requests: cpu: 200m --- apiVersion: v1 kind: Service metadata: name: php-apache labels: run: php-apache spec: ports: - port: 80 selector: run: php-apache ```</br>
Apply the manifest.
$ kubectl apply -f php-apache.yml
deployment.apps/php-apache created
service/php-apache created
Create the HorizontalPodAutoscaler
The HPA maintains the number of replicas to 10, and scales the replicas to maintain an average CPU utilization across all Pods of 50%.
$ kubectl autoscale deployment php-apache --cpu-percent=50 --min=1 --max=10
horizontalpodautoscaler.autoscaling/php-apache autoscaled
Check the status.
$ kubectl get hpa
To see more details about the HPA,
$ kubectl describe hpa
Increase the Load
Open a second terminal and run a client Pod that continuously sends queries to the php-apache service.
$ kubectl run -i --tty load-generator \
    --rm --image=busybox:1.28 \
    --restart=Never \
    -- /bin/sh -c "while sleep 0.01; do wget -q -O- http://php-apache; done"
Inside the first terminal, run the command below a few times and see the CPU load increase.
$ kubectl get hpa php-apache --watch
In the example below, we can see the CPU consumption increasing and replicas being added.
$ kubectl get hpa
NAME         REFERENCE               TARGETS   MINPODS   MAXPODS   REPLICAS   AGE
php-apache   Deployment/php-apache   0%/50%    1         10        1          32m

$ kubectl get hpa
NAME         REFERENCE               TARGETS    MINPODS   MAXPODS   REPLICAS   AGE
php-apache   Deployment/php-apache   109%/50%   1         10        1          32m

$ kubectl get hpa
NAME         REFERENCE               TARGETS    MINPODS   MAXPODS   REPLICAS   AGE
php-apache   Deployment/php-apache   162%/50%   1         10        1          60m

$ kubectl get hpa
^[[ONAME         REFERENCE               TARGETS    MINPODS   MAXPODS   REPLICAS   AGE
php-apache   Deployment/php-apache   250%/50%   1         10        4          60m
To stop generating the load, go back to the second terminal and hit Ctrl-C.
Next, go to the CloudWatch dashboard. We can see that the metrics are reporting the utilization of our cluster.

Cleanup
Whew, that was a lot!
Before we officially close this lab, make sure to destroy all resources to prevent incurring additional costs.
$ time eksctl delete cluster -f eksops.yml
Note that when you delete your cluster, make sure to double check the AWS Console and check the Cloudformation stacks (which we created by eksctl) are dropped cleanly.