Risk Assessment
Overview
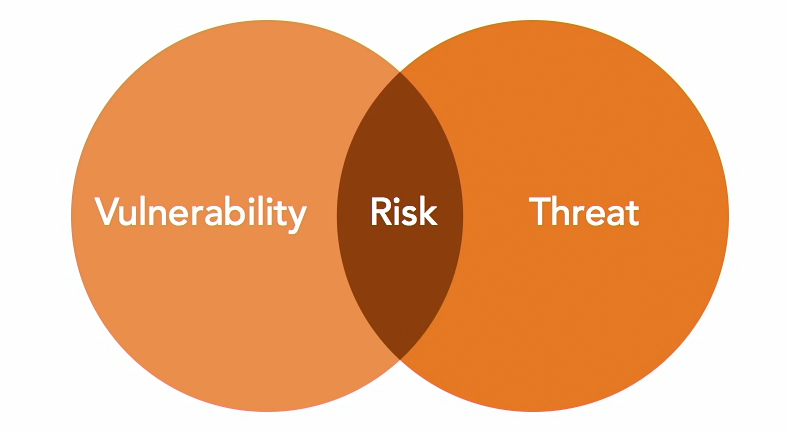
Risk Assessment is the process of identifying, estimating, and prioritizing risks to an organization's operations, assets, individuals, and mission.
Note: There is no risk if both the vulnerability and threat is missing.
Risk Assessment Frequency
Risk assessment frequency describes how often assessments happen.
Ad-Hoc
Risk assessments performed on an as-needed basis, typically in response to unexpected events or changes in the environment.
- Happens after an incident or major change
- Can occur when launching new services
Ad-hoc assessments help teams respond quickly when situations change suddenly.
Recurring
Risk assessments scheduled at regular intervals, such as annually or semi-annually.
- Normally part of an organization's procedures.
- Ensures risks are continually identified and managed
- An example is a recurring penetration testing.
One-Time
A risk assessment carried out just once, often at the beginning of a project, implementation of a new system, or during an initial risk evaluation.
- Useful for new systems or major changes
- Not repeated unless required later
- Example: When there's new IT system or organizational change.
One-time is not repeated, while Ad-hoc may be repeated.
Continuous
An ongoing process of risk assessment that integrates risk monitoring into daily operations.
- Real-time data collection and analysis.
- Uses automated tools to provide real-time risk insights
- Proactive risk management and swift response to emerging threats.
Risk Assessment Types
Quantitative Risk Assessment
Quantitative risk assessment is a risk analysis approach that uses numerical values and data to estimate risks.
- Relies on metrics and historical data
- Prioritizes based on financial and operational impact
- Helps with budgeting and resource allocation
- Example: Calculating loss from server failure
A measurement is a quantitative observation of a factor at a particular point in time. In other words, this is raw data. Two examples of measurements would be:
- 211 IDS alerts in the last 24 hours
- 42 verified events in the month of January
Qualitative Risk Assessment
Qualitative risk assessment evaluates risks using descriptive and subjective factors instead of numerical data.
- Uses interviews and expert judgment
- Helps when numbers are unavailable or practical
- Example: Evaluating reputational impact
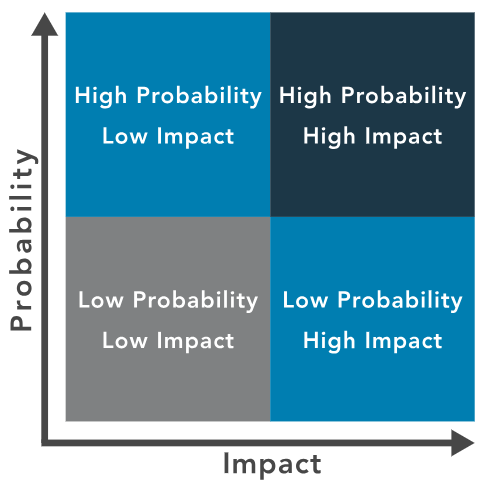
In this type of assessment, the risks are classified into categories based on probability and impact:
HighMediumLow
While there are established standards for conducting qualitative assessments, the method itself is not the most important part. What truly matters is ensuring that accurate, relevant information is used so the organization can make the best possible business decisions.
Metrics in Quantitative Risk Assessment
Asset Value (AV)
Asset value shows how much something is worth and how much money is lost if it stops working. Risk assessors determine asset value using several methods:
-
Original Cost
- Based on the initial purchase invoice of the asset.
- Often used when historical cost data is available.
- Does not consider current market value or depreciation over time.
-
Depreciated Cost
- Wear and tear reduces the value of the asset over time.
- Uses straight-line or declining balance depreciation.
- Reflects the current book value rather than replacement cost.
-
Replacement Cost
- Estimates the cost to replace the asset at today's market price.
- Most accurate, as it considers real-world current values.
- Often used for insurance and disaster recovery planning.
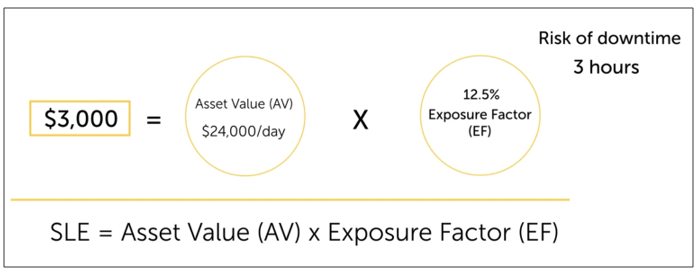
Exposure Factor (EF)
Exposure factor shows the percent of damage an asset suffers when something bad happens.
EF = Risk_of_downtime_hours / 24
- Shown as a percent of the total asset
- Can be small or large depending on impact
- Helps estimate how much of the asset value will be lost
EF makes it easier to predict damage by turning the impact into a simple percentage.
Single Loss Expectancy (SLE)
Single Loss Expectancy (SLE) represents the monetary loss from a single occurrence of a risk event.
SLE = AV - EF
- Uses asset value and exposure factor
- Shows loss from one incident only
- Helps in deciding what protections are needed
Annualized Rate of Occurrence (ARO)
Annualized Rate of Occurrence (ARO) estimates how many times a specific risk may occur over a year. It is based on historical data, industry statistics, or expert judgment.
- ARO of
1.0➔ Risk happens once per year - ARO of
0.1➔ Risk happens once every 10 years - Higher ARO means the event is more common
ARO helps estimate long-term risk by looking at how often an event is expected.
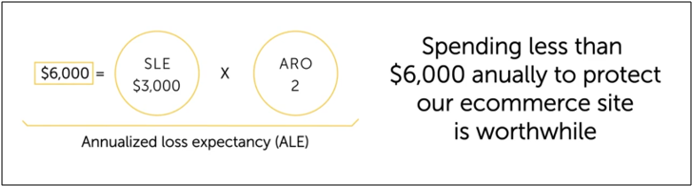
Annualized Loss Expectancy (ALE)
Annualized Loss Expectancy (ALE) calculates the total financial loss expected over one year due to a specific risk.
ALE = SLE - ARO
- Combines cost per event and frequency
- Helps compare cost of controls versus yearly losses
- Useful for planning, budgeting, and security decisions
These computations help organizations make informed decisions on where to invest in security, how to prioritize risks, and how to allocate resources effectively.
Risk Assessment Methods
Risk assessment methods help evaluate and understand potential risks in a structured way to prevent or reduce negative impacts.
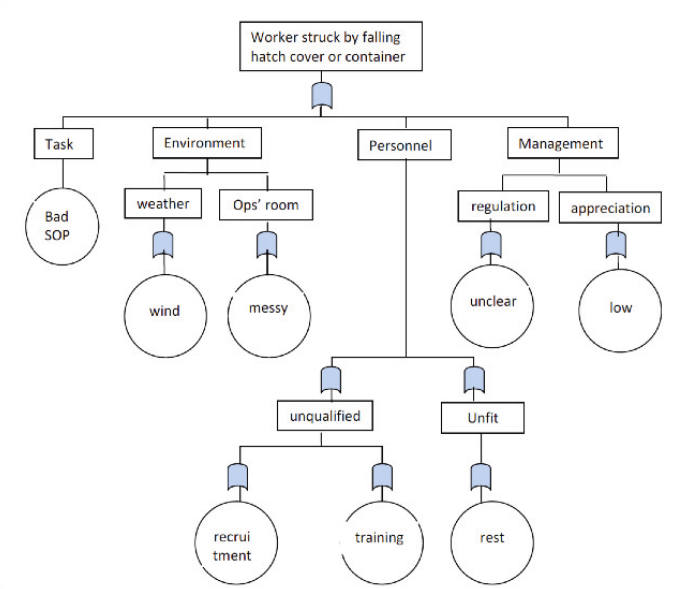
Fault Tree Analysis (FTA)
Fault Tree Analysis (FTA) is a visual method that uses a diagram to find the root cause of failures in a system.
- Uses a tree diagram to map failure events
- Starts with a top-level failure and breaks it into causes
- Helps prioritize risks based on likelihood and impact
Failures are shown as a top event in a logic tree, with causes branching out below. FTA gives a clear picture of how problems spread and helps prevent system failures.
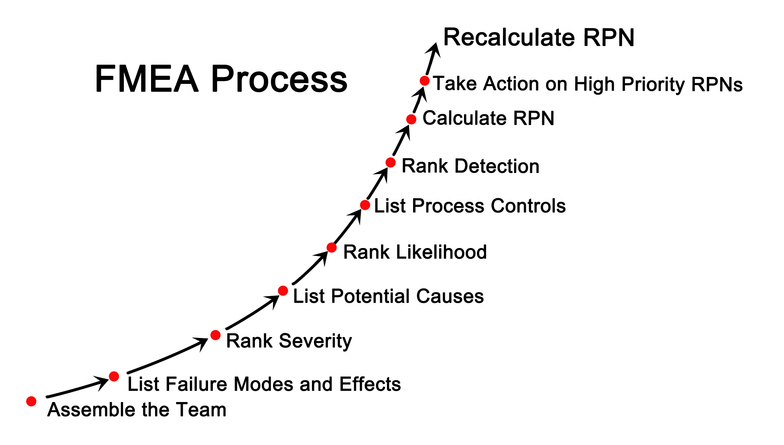
Failure Modes and Effects Analysis (FMEA)
Failure Modes and Effects Analysis (FMEA) identifies potential failures in a system and assesses their effects.
- Lists possible failure modes for each component
- Evaluates severity, likelihood, and detectability
- Prioritizes risks using a risk priority number (RPN)
- Common in product development and operational environments
The steps include:
-
Create a block diagram of the system or process
- Map out the major components or steps.
- Show how each part connects and interacts.
-
Identify possible failure modes for each block
- Consider what could go wrong with each component.
- Include hardware, software, human error, or process failures.
-
List the effects of each failure in a table
- Pair each failure mode with its potential impact.
- Evaluate severity, likelihood, and detectability.
- Assign a Risk Priority Number (RPN) to prioritize actions.
-
Identify and recommend corrective actions
- Determine how to prevent or reduce the impact of high-risk failures.
- Update processes, add controls, or improve monitoring.
-
Implement actions and review results
- Apply the recommended changes.
- Recalculate RPN to confirm reduced risk.
- Update FMEA documentation for future reviews.
FMEA helps teams systematically spot weaknesses and plan corrective actions before failures occur.
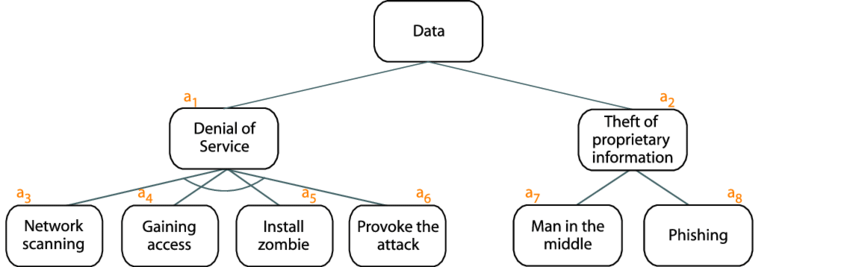
Attack Tree Analysis
Attack Tree Analysis maps potential attacks on a system in a hierarchical structure.
- Each branch represents a way an attacker could achieve a goal
- Assigns likelihood or difficulty to each attack path
- Useful for designing better security controls
An attack tree is a diagram that represents the attack pattern by presenting:
- Decision points
- Specific conditions required for the attack
- Endpoints for the attack
Attack trees make complex security threats easier to understand and defend against by showing all possible attack paths.
Facilitated Risk Analysis Process (FRAP)
Facilitated Risk Analysis Process (FRAP) is a qualitative risk assessment methodology used to focus only on the systems that really need assessing, to reduce costs and time obligations.
- Collaborative approach to assess risks with stakeholders
- Conducted in workshops with team members
- Focuses on high-impact, high-likelihood risks
- Helps prioritize actions and assign responsibilities
FRAP stresses prescreening activities so that the risk assessment steps are only carried out on the item(s) that needs it the most. FRAP is intended to be used to analyze one system, application, or business process at a time.
Risk Prioritization
Prioritizing risks helps organizations focus on the most important threats first.
-
Context and Alignment
- Links risks to the organization’s goals and mission.
- Provides perspective on the impact and importance of each risk.
-
Management Guidance
- Management directs how assessment results are used.
- Supports decisions on which risks to tackle first.
-
Risk Matrix
- Matches likelihood of occurrence with potential impact.
- Offers a visual tool for teams and management to communicate priorities.
-
Factors for Priority
- Business objectives and critical functions
- Costs of mitigation measures
- Potential financial or operational losses
Using a structured approach ensures that resources are focused on risks that matter most, improving decision-making and risk response effectiveness.