Model Training with Github Actions
Overview
This project demonstrates how to integrate model training into a CI/CD pipeline using GitHub Actions. By automating the training process, we can ensure that every code change is tested and validated before merging.
- Automate training on pull requests
- Track model performance automatically
- Share results directly in GitHub
This page covers the dataset, modeling workflow, and how to set up GitHub Actions with CML for automated training and reporting.
To see the actual code and files, please check out the Github repo here: Model Training with Github Actions
Dataset
We use a weather dataset to predict whether it will rain the next day. It contains records from different locations in Australia and is commonly used for classification tasks.
The dataset includes features such as:
- Location
- Wind direction
- Rainfall
- Temperature.
The goal is to predict a simple yes or no outcome for rain.
Modeling Workflow
The model follows a simple pipeline from raw data to evaluation.
- Convert categorical to numerical
- Handle missing values
- Scale the features
- Train the model
- Evaluate results
Each step prepares the data so the model can learn properly and produce reliable predictions.
Note: This is a basic workflow. In practice, you may need to add more steps like feature engineering or hyperparameter tuning for better performance.
Modeling Concepts
Preparing the Data
Before training, the dataset must be transformed into a format suitable for machine learning. This involves several key steps:
- Target encoding for categorical features
- Imputation for missing values
- Feature scaling for numerical stability
Categorical features are encoded into numerical values using target encoding, where each category is replaced with the average value of the target variable.
- Useful for features with many unique values
- Avoids creating too many columns
- Works well for high-cardinality data
For example, if Location is a feature, each location is replaced with the average rain outcome for that location. This keeps the data compact and useful.
Missing values are then handled through imputation, where numerical fields are filled using the mean. After that, feature scaling is applied to standardize the data so all features have a similar range. This helps improve model performance and stability.
- Data is scaled to zero mean and unit variance
- Prevents features with larger ranges from dominating the model
- Improves convergence during training
In practice, these steps are often combined into reusable preprocessing functions:
from sklearn.impute import SimpleImputer
from sklearn.preprocessing import StandardScaler

def impute_and_scale_data(X):
    imputer = SimpleImputer(strategy="mean")
    scaler = StandardScaler()

    X_imputed = imputer.fit_transform(X)
    X_scaled = scaler.fit_transform(X_imputed)

    return X_scaled
This ensures all features are complete and on the same scale before training.
Training the Model
Finally, the dataset is split into two sets:
- Training dataset
- Testing dataset
The model is trained on the training data using a Random Forest classifier, which is effective for handling different feature types and reducing overfitting.
In the example below, X is features and y is the target.
from sklearn.model_selection import train_test_split
from sklearn.ensemble import RandomForestClassifier

X_train, X_test, y_train, y_test = train_test_split(
    X, y, test_size=0.2, random_state=42
)

model = RandomForestClassifier()
model.fit(X_train, y_train)
The random_state parameter controls the shuffling applied to the data before splitting. Setting it to a specific integer (like 42) ensures that the split between training and test sets is reproducible every time you run the script. If you use a different value or leave it as None, the split will be different each time.
random_state is a parameter of the train_test_split function, which is imported from sklearn.model_selection. The function itself uses this parameter internally to seed its random number generator.
42 is an arbitrary choice and can be replaced with any integer you like. The key is to use the same value consistently for reproducibility.
Evaluating the Model
To get a comprehensive view of model performance, we report the standard metrics such as accuracy, precision, recall, and F1 score.
- Accuracy shows overall correctness
- Precision shows correctness of positive predictions
- Recall shows how many positives were found
- F1 score balances precision and recall
In the example below, model, X_test, and y_test are used to compute metrics.
from sklearn.metrics import accuracy_score, precision_score, recall_score, f1_score

y_pred = model.predict(X_test)

print("Accuracy:", accuracy_score(y_test, y_pred))
print("Precision:", precision_score(y_test, y_pred))
print("Recall:", recall_score(y_test, y_pred))
print("F1 Score:", f1_score(y_test, y_pred))
Expected output will look like:
Accuracy: 0.85
Precision: 0.83
Recall: 0.81
F1 Score: 0.82
These metrics give a complete view of model performance.
Confusion Matrix
In this step, predictions are visualized using a confusion matrix.
- Shows correct and incorrect predictions
- Helps understand model errors
- Displays counts of predictions
In the example below, y_test and y_pred are used to create the plot.
from sklearn.metrics import ConfusionMatrixDisplay
import matplotlib.pyplot as plt

ConfusionMatrixDisplay.from_predictions(y_test, y_pred)
plt.show()
The diagonal represents correct predictions, which makes it easier to assess overall model performance and identify where mistakes occur.
Project Description
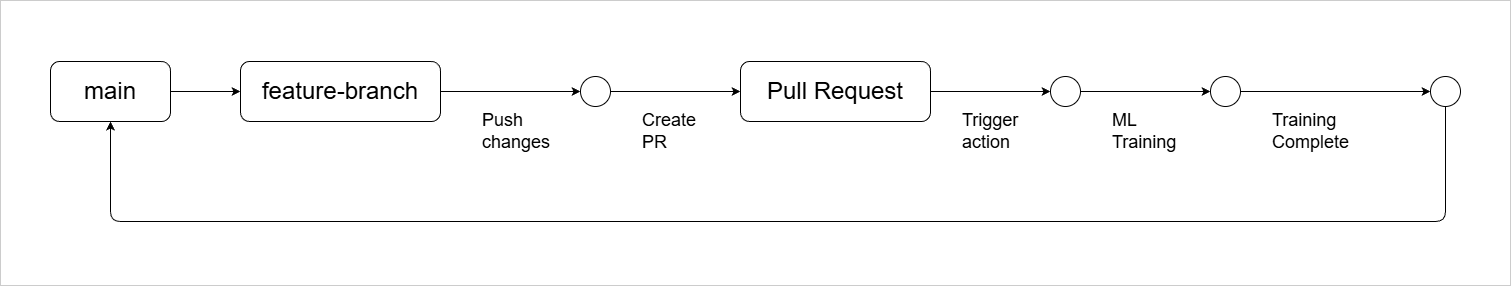
Model training is automated using GitHub Actions and runs whenever a pull request is created from a feature branch to main.
- Trigger training on pull request
- Run full training pipeline
- Report results in pull request
We use Continuous Machine Learning (CML) to handle training, evaluation, and reporting inside the CI environment.
- Run training inside CI
- Generate metrics and visual reports
- Post results as comments in pull request
CML provisions the environment, runs the training code, evaluates the model, and shares results automatically in the pull request so changes can be reviewed before merging. This workflow runs automatically on every pull request and executes the model training pipeline.
After training, CML reads the output files and posts the results back to the pull request. In this example, results.txt contains metrics and plot.png contains a visualization.
echo "## Model Results" > report.md
cat results.txt >> report.md
echo "" >> report.md
cml comment create report.md
This creates a comment in the pull request with metrics and plots.
- Model is trained automatically
- Metrics are calculated
- Results appear in pull request
This setup makes model training consistent, visible, and easy to review before merging changes.
Prerequisites
To follow along with the project, you need:
-
For Ubuntu, you can install Python 3.10 using the following command:
sudo apt updatesudo apt install -y python3.10sudo apt install -y python3.10-venv
Clone the repository
To get started, clone the repository to your local machine. This will give you access to the code and files needed for the project.
git clone https://github.com/joseeden/ML-Model-Training-with-Github-Actions.git
Then navigate to the project directory:
cd ML-Model-Training-with-Github-Actions
Project structure:
ML-Model-Training-with-Github-Actions
├── README.md
├── outputs/
├── processed_dataset/
├── raw_dataset/
│   └── weather.csv
├── requirements.txt
└── scripts/
    ├── metrics_and_plots.py
    ├── model.py
    ├── preprocess_dataset.py
    ├── train.py
    └── utils_and_constants.py
Create a Python Virtual Environment
As best practice, create a Python virtual environment to manage dependencies for the project. This ensures that the required libraries are installed and isolated from other projects.
Note: You should be inside the project directory when running these commands.
Windows:
python -m venv venv
venv\Scripts\activate
WSL on Windows:
python3 -m venv venv
source venv/bin/activate
macOS/Linux:
python3 -m venv venv
source venv/bin/activate
Then install your packages:
pip install -r requirements.txt
Note: If you are inside WSL on Windows, the installation of Python packages can become slow due to file system performance issues. To speed up the process, you can move the project files to the WSL file system (e.g., /home/username/) instead of keeping them on the Windows file system (e.g., C:\). This allows for faster read/write operations during package installation and training.
Data Preprocessing
Before training the model, we must preprocess the dataset. The preprocess_dataset.py script contains helper functions to clean and transform the raw data.
python3 scripts/preprocess_dataset.py
This will create the processed dataset file in the /processed_dataset directory. This will be used by the training script to train the model (next step).
processed_dataset/
└── weather.csv
Train the Classification Model
Note: Always run the preprocessing step before training. If you skip preprocessing or run training first, the model may fail or use outdated data, and
metrics.jsonmay not reflect the correct results.
Once preprocessing is complete and the processed dataset exists, we can train the model using train.py. This script loads the processed data, splits it into training and test sets, trains the model, evaluates it, and saves the results.
python3 scripts/train.py
Output:
====================Test Set Metrics==================
{
  "accuracy": 0.9378,
  "precision": 0.994,
  "recall": 0.7292,
  "f1_score": 0.8412
}
======================================================
The script will also generates metrics.json with the latest evaluation metrics and create a confusion matrix plot (e.g., confusion_matrix.png) in the outputs directory.
outputs/
├── confusion_matrix.png
└── metrics.json
...
The confusion matrix shows the number of true positives, true negatives, false positives, and false negatives. This helps you better understand how the model is performing.
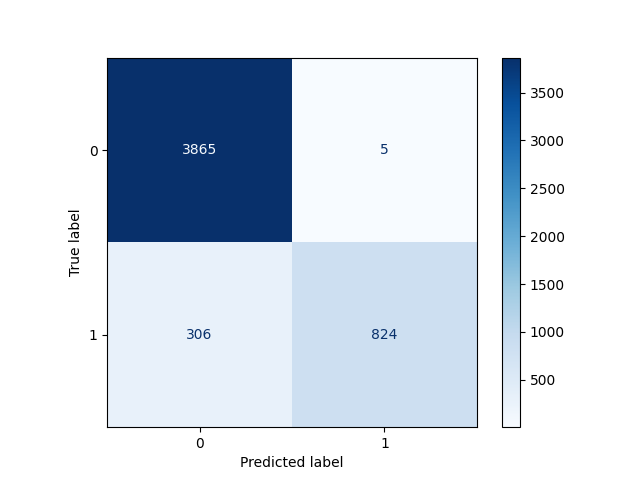
In some cases, the model may use a prediction threshold that is too high. This can make it more conservative when predicting positive outcomes. Lowering the threshold can improve recall, but it may reduce precision.
Delete the Output Files
Before proceeding with using CML and Github Actions, delete the output files and the processed dataset to simulate a fresh training run.
rm -rf processed_dataset/weather.csv
rm -rf outputs/confusion_matrix.png outputs/metrics.json
These files will be recreated by the DVC pipeline and the GitHub Actions workflow when we run them in later steps.
Setup Model Training using CML
In this step, we will use CML with GitHub Actions to train a Random Forest classifier that predicts rainfall. CML helps automate training, evaluation, and reporting for machine learning workflows.
Training is triggered when a pull request is opened against the main branch. The workflow uses the same weather dataset, and then proceeds with the steps:
- The
preprocess_dataset.pyscript prepares the data as before. - The
train.pyscript trains the model and produces ametrics.jsonfile with evaluation metrics. - The
train.pyscript also generates aconfusion_matrix.pngfile.
Finally, the workflow creates a comment in the pull request with the latest metrics and the confusion matrix plot.
name: model-training
on:
pull_request:
branches: main
permissions: write-all
jobs:
train_and_report_eval_performance:
runs-on: ubuntu-latest
steps:
- name: Checkout
uses: actions/checkout@v3
- name: Setup Python
uses: actions/setup-python@v4
with:
python-version: 3.9
# Setup CML GitHub Action
- name: Setup CML
uses: iterative/setup-cml@v1
- name: Train model
run: |
python3 preprocess_dataset.py
python3 train.py
- name: Write CML report
env:
REPO_TOKEN: ${{ secrets.GITHUB_TOKEN }}
run: |
# Add metrics data to markdown
cat metrics.json >> model_eval_report.md
# Add confusion matrix plot to markdown
echo "" >> model_eval_report.md
# Create comment from markdown report
cml comment create model_eval_report.md
Each time the workflow runs, it updates the existing comment instead of creating a new one. This keeps the pull request clean and ensures that only the latest results are shown.
Data Versioning with DVC
We'll use Data Version Control (DVC) to track changes in the datasets and model artifacts. DVC allows us to manage large files and datasets without bloating our Git repository.
Note: If you install the packages in the requirements.txt file, DVC should already be installed. You can verify this by checking the version:
dvc --version
Sample output:
3.67.1
Steps:
-
Inside the project directory, initialize DVC:
dvc initOutput:
Initialized DVC repository.You can now commit the changes to git.+---------------------------------------------------------------------+| || DVC has enabled anonymous aggregate usage analytics. || Read the analytics documentation (and how to opt-out) here: || <https://dvc.org/doc/user-guide/analytics> || |+---------------------------------------------------------------------+The following files and directories are created:
├── .dvcignore└── .dvc├── .gitignore├── config└── tmp -
Add the raw dataset to DVC tracking:
dvc add raw_dataset/weather.csvThis will create a DVC cache inside the
cachedirectory inside.dvcand a correspondingweather.csv.dvcfile that tracks the dataset. The actual data file is not stored in Git, but the metadata is.$ tree .dvc/cache/.dvc/cache/└── files└── md5└── e6└── 02b116f50269aa781c0c910cd80db9Alternative command:
$ find .dvc/cache -type f.dvc/cache/files/md5/e6/02b116f50269aa781c0c910cd80db9Note: If you previously commited the raw dataset to Git, you will need to remove it from Git tracking first before adding it to DVC.
git rm -r --cached 'raw_dataset/weather.csv'git commit -m "stop tracking raw_dataset/weather.csv" -
Set up a local DVC remote named
dev-remotepointed at/tmp/dvc/dev-remote.dvc remote add -d --local dev-remote /tmp/dvc/dev-remoteNote that if you try to list the contents of the remote directory before pushing, it will return:
$ ls -la /tmp/dvc/dev-remotels: cannot access '/tmp/dvc/dev-remote': No such file or directoryThis is the expected behavior. DVC does not automatically create the remote directory, it only stores the configuration. The remote directory will be created when you push data to it.
-
To check the remote configuration, you can run:
dvc remote listOutput:
myremote /tmp/dvc/localremoteAlternatively, you can check the
.dvc/config.localfile to see the remote configuration:$ cat .dvc/config.local[core]remote = dev-remote['remote "dev-remote"']url = /tmp/dvc/dev-remote -
Push the dataset to the remote:
dvc pushOutput:
CollectingPushing1 file pushedConfirm that the remote directory is created and contains the dataset:
$ tree /tmp/dvc/dev-remote//tmp/dvc/dev-remote/└── files└── md5└── e6└── 02b116f50269aa781c0c910cd80db9 -
Now try to pull the changes:
dvc pullThis will check for any changes in the remote and pull them to the local cache. Since there are no changes, it will return:
CollectingFetchingBuilding workspace indexComparing indexesApplying changesEverything is up to date. -
Push the changes to Git:
git add .git commit -m "Add raw dataset to DVC tracking"git push origin main
Create a DVC Pipeline
In this step, we will create a DVC pipeline to automate the data preprocessing and model training steps. This allows us to track the entire workflow and easily reproduce results.
Run the commands below to create the pipeline stages and run the pipeline:
-
DVC stage for preprocessing:
dvc stage add -n preprocess \-d scripts/preprocess_dataset.py \-d scripts/utils_and_constants.py \-d raw_dataset/weather.csv \-o processed_dataset/weather.csv \python scripts/preprocess_dataset.pyIn this stage, we specified the dependencies with the
-dflag, and the output files with the-oflag. -
DVC stage for training:
dvc stage add -n train \-d scripts/metrics_and_plots.py \-d scripts/model.py \-d scripts/train.py \-d scripts/utils_and_constants.py \-d processed_dataset/weather.csv \-o outputs/metrics.json \-o outputs/confusion_matrix.png \python scripts/train.pySimilar with the previous stage, but here we specified that the training stage depends on the processed dataset which will be generated by the first stage.
-
This will create a
dvc.yamlfile with the defined stages and their dependencies.stages:preprocess:cmd: python scripts/preprocess_dataset.pydeps:- raw_dataset/weather.csv- scripts/preprocess_dataset.py- scripts/utils_and_constants.pyouts:- processed_dataset/weather.csvtrain:cmd: python scripts/train.pydeps:- processed_dataset/weather.csv- scripts/metrics_and_plots.py- scripts/model.py- scripts/train.py- scripts/utils_and_constants.pyouts:- outputs/confusion_matrix.png- outputs/metrics.json -
Visualize the pipeline:
dvc dagOutput:
+-----------------------------+| raw_dataset/weather.csv.dvc |+-----------------------------+***+------------+| preprocess |+------------+***+-------+| train |+-------+ -
Reproduce the pipeline:
dvc reproThis will run the stages in the correct order based on their dependencies. Since we deleted the output files earlier, all the stages will run:
'raw_dataset/weather.csv.dvc' didn't change, skippingRunning stage 'preprocess':> python scripts/preprocess_dataset.pyUpdating lock file 'dvc.lock'Running stage 'train':> python scripts/train.py====================Test Set Metrics=================={"accuracy": 0.9378,"precision": 0.994,"recall": 0.7292,"f1_score": 0.8412}======================================================Updating lock file 'dvc.lock'To track the changes with git, run:git add dvc.lockTo enable auto staging, run:dvc config core.autostage trueUse `dvc push` to send your updates to remote storage. -
If the pipeline is successfully reproduced, you should see the output files generated again in the
processed_datasetandoutputsdirectories.processed_dataset/└── weather.csvoutputs/├── confusion_matrix.png└── metrics.json