Introduction to Observability
Overview
Observability is the practice of understanding and measuring the internal state of a system using the data it generates.
- Provides actionable insights for unexpected scenarios.
- Improves visibility into application behavior.
- Speed up troubleshooting, detects problems and monitor performance.
When troubleshooting issues, understanding the root cause is essential. Observability helps identify:
- Why errors are increasing.
- Why latency is high.
- Why services are timing out.
It provides the context needed to answer "why" questions and mitigate future occurrences.
Telemetry
Telemetry collects and analyzes data to monitor system performance. The main types of telemetry data are:
-
Metrics
- Quantifiable measurements like CPU or memory usage.
- Show trends and system health.
- Collected at regular intervals.
-
Event
- Discrete occurrences like logins or crashes.
- Capture specific actions or anomalies.
- Used for audits and troubleshooting.
-
Log
- Time-stamped records of activities (e.g., errors).
- Provide detailed insights for debugging.
- Useful for root cause analysis.
-
Trace
- Follows requests across distributed systems.
- Identifies bottlenecks and delays.
- Helps optimize performance.
Pillars of Observability
Logging
Logs capture detailed records of system events.
- Textual data about actions or errors.
- Supports debugging and specific incident analysis.
- Provides historical context for root cause analysis.
While logs are essential, their verbosity can make it challenging to extract meaningful information.
Metrics
Metrics measure numerical data to monitor system health and trends.
- Aggregate data like CPU usage, memory, and latency.
- Enable trend analysis and alerting on thresholds.
- Offer a high-level overview for capacity planning.
The data collected can be aggregated over time and graphed using visualization tools to identify trends over time. Metrics can contain:
- CPU Load
- Number of open files
- HTTP Response times
- Number of errors
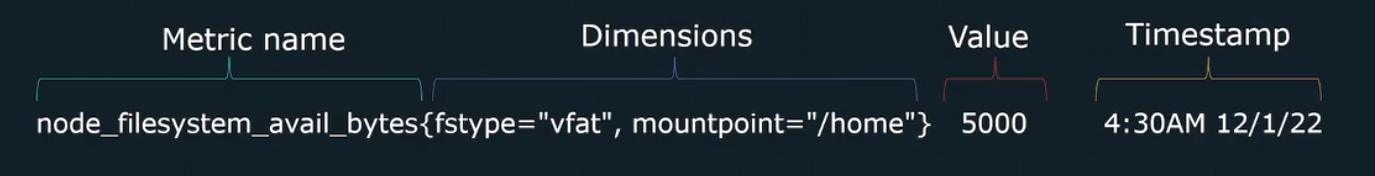
In general, metrics has these main components:
- Metric name
- Value
- Timestamp for the metric
- Dimensions
Tracing
Tracks the flow of requests across distributed systems.
- Maps relationships and dependencies between services.
- Pinpoints bottlenecks or failures in multi-service environments.
- Offers insights into end-to-end system performance.
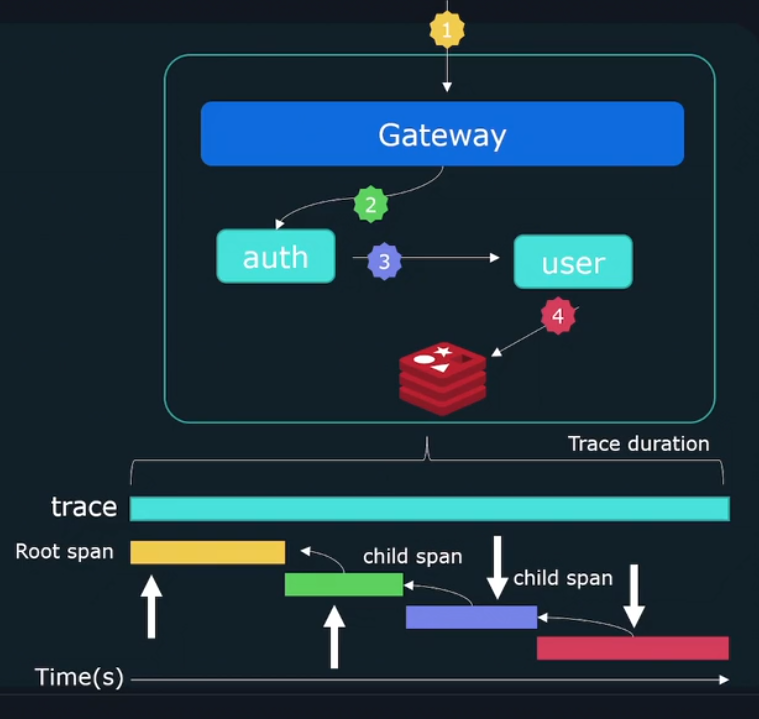
Each trace has a trace-id that can be used to identify the request as it traverses the system. Individual events forming a trace are called spans and each span tracks the following:
Start timeDurationParent-id
Methods of Monitoring
Microservices-based applications are commonly divided into three main layers, each requiring a specific monitoring approach. According to Google's SRE Handbook, the layers and methods are:
| Layer | Description | Monitoring Method |
|---|---|---|
| UI Layer | Website and applications for user interaction. | Core Web Vitals |
| Service Layer | Microservices like payment, booking, and communication services. | RED Method |
| Infrastructure Layer | Physical or virtual resources such as memory, disk, and CPU. | USE Method |
Google also introduced the Four Golden Signals, which cover metrics for both the service and infrastructure layers to evaluate performance and reliability.
RED Method
The RED Method is request-oriented, focusing on how well individual requests are handled.
| Metric | Description |
|---|---|
| Rate | The number of requests per second received by the service. |
| Errors | The number of failed requests or error rates in processing requests. |
| Duration | The time taken to serve a request, including latency or processing delays. |
USE Method
The USE Method is resource-oriented, helping monitor the health of system resources like servers or containers.
| Metric | Description |
|---|---|
| Utilization | Measures the percentage of resource capacity in use (e.g., CPU at 70% utilization). |
| Saturation | Indicates the extent of overloading or nearing capacity (e.g., high disk queue). |
| Errors | Tracks hardware or resource-level errors (e.g., disk I/O errors, failed connections). |
Four Golden Signals
The Four Golden Signals provide a comprehensive view of system performance and reliability.
| Metric | Description |
|---|---|
| Latency | The time taken for a request to be completed, including successful and failed requests. |
| Traffic | Represents demand on the system, such as requests per second or data throughput. |
| Errors | The percentage or count of failed requests across the system. |
| Saturation | The system's load relative to its maximum capacity. |
Core Web Vitals
Core Web Vitals are user experience metrics that measure website performance, particularly for the UI layer.
| Metric | Description |
|---|---|
| Largest Contentful Paint | Measures the loading performance by tracking when the largest visible element appears. |
| First Input Delay | Tracks interactivity by measuring the delay in responding to the first user input. |
| Cumulative Layout Shift | Evaluates visual stability by measuring unexpected layout shifts during loading. |
Methods of Collecting Metrics
Metrics can be collected using different approaches depending on the system's design and monitoring needs.
-
Push Method
- Systems actively send metrics to a central monitoring server.
- Ideal for applications behind firewalls or NAT.
- Allows controlled, periodic data transmission.
-
Scrape Method
- A monitoring server requests metrics from systems at regular intervals.
- Commonly used in environments like Prometheus.
- Ensures up-to-date data by pulling it on demand.
Which method to choose? Consider the following:
- The type of systems or applications
- Scalability requirements
- Complexity of implementation
Service Level Concepts
Service Level Indicator (SLI)
A quantitative metric that measures specific aspects of system performance.
- Represents key measurements like latency, error rates, or throughput.
- Tracks system behavior to evaluate performance against objectives.
Examples
- Latency
- Availability
Service Level Objective (SLO)
A target or goal for system performance based on SLIs.
- Defines acceptable thresholds for reliability or efficiency.
- Guides operational priorities and service improvements.
Examples
- Latency < 100ms
- Availability - 99.9% uptime
It may be tempting to set them to aggresive values like 100% uptime however this will come at a higher cost. The goal is not to achieve perfection but instead to make customers happy with the right level of reliability.
Service Level Agreement (SLA)
A formal contract between a provider and user specifying service expectations.
- Includes penalties or remedies if agreed targets are not met.
- Ensures accountability and trust between parties.