Containerized Kong and Other Applications
Lab Environment
This lab installs the following containerized applications locally on a Windows 10 machine using Docker Compose.
- Kong API Gateway
- Kong Database
- pgAdmin
- Konga
- Grafana
- Prometheus
- Kibana
- Logstash
- Elasticsearch
- Zipkin
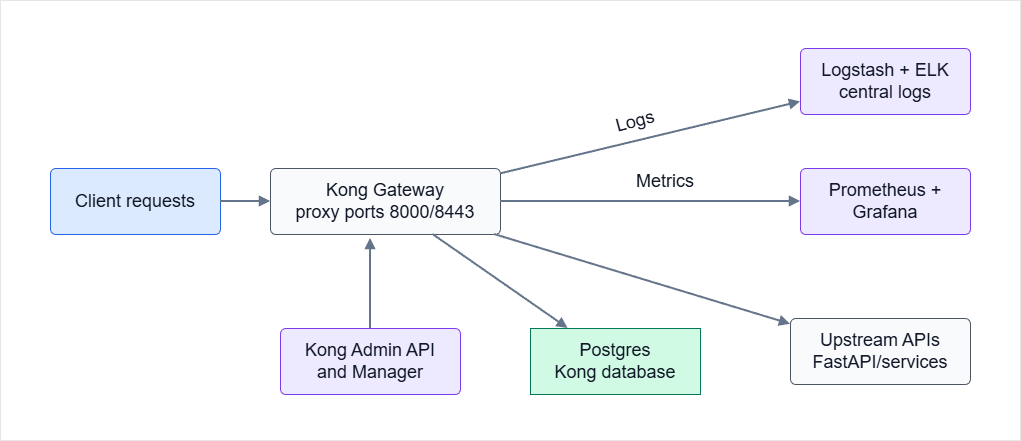
Architecture Diagram
The diagram below summarizes how the Docker Compose stack connects Kong Gateway, its database, management tools, and the observability services used in the lab.
Pre-requisites
This guide shows how to install a containerized Kong along with the other applications locally in your computer. Make sure to install the following first:
Required Ports
The following port must be opened:
| Port | Service | Description |
|---|---|---|
| 5432 | PostgreSQL | Used by PostgreSQL. If a running server is present, it must be stopped for Docker PostgreSQL. |
| 5050, 80 | PgAdmin 4 | UI interface to visualize the Postgres database. |
| 8000 | Kong Gateway (HTTP) | Kong gateway via plain HTTP. |
| 8443 | Kong Gateway (HTTPS) | Kong gateway via HTTPS. |
| 8001 | Kong Admin API | Kong Admin API interface. |
| 8002 | Kong Manager UI | Kong Manager UI interface. |
| 5000 | FastAPI Endpoint | FastAPI endpoint for the application. |
Optional ports:
| Port | Service | Description |
|---|---|---|
| 9411 | Zipkin | Used for distributed tracing (optional). |
| 9200, 9600, 5555, 5601 | Elastic Stack (Elasticsearch, Logstash, Kibana) | Used for API analytics (optional). |
Using docker-compose
Reference: joseeden/labs-kong-gateway
Clone the repository and go inside the folder. Run docker-compose.
git clone https://github.com/joseeden/labs-kong-gateway.git
cd labs-kong-gateway

## Build
docker-compose up -d --build
The build should take a few minutes. Once done, it should return:
[+] Running 12/12
 ✔ Network kong-net                Created                               2.1s
 ✔ Container elasticsearch                           Started                               7.4s
 ✔ Container kibana                                  Started                              10.5s
 ✔ Container logstash                                Started                              10.4s
 ✔ Container zipkin                                  Started                               9.1s
 ✔ Container grafana-1             Started                               9.0s
 ✔ Container kong-database-1       Started                               8.0s
 ✔ Container kong-1                Started                               8.2s
 ✔ Container prometheus                              Started                               9.4s
 ✔ Container kong-migrations-1     Started                               6.7s
 ✔ Container kong-migrations-up-1  Started                               6.4s
 ✔ Container konga_web                               Started                               6.9s
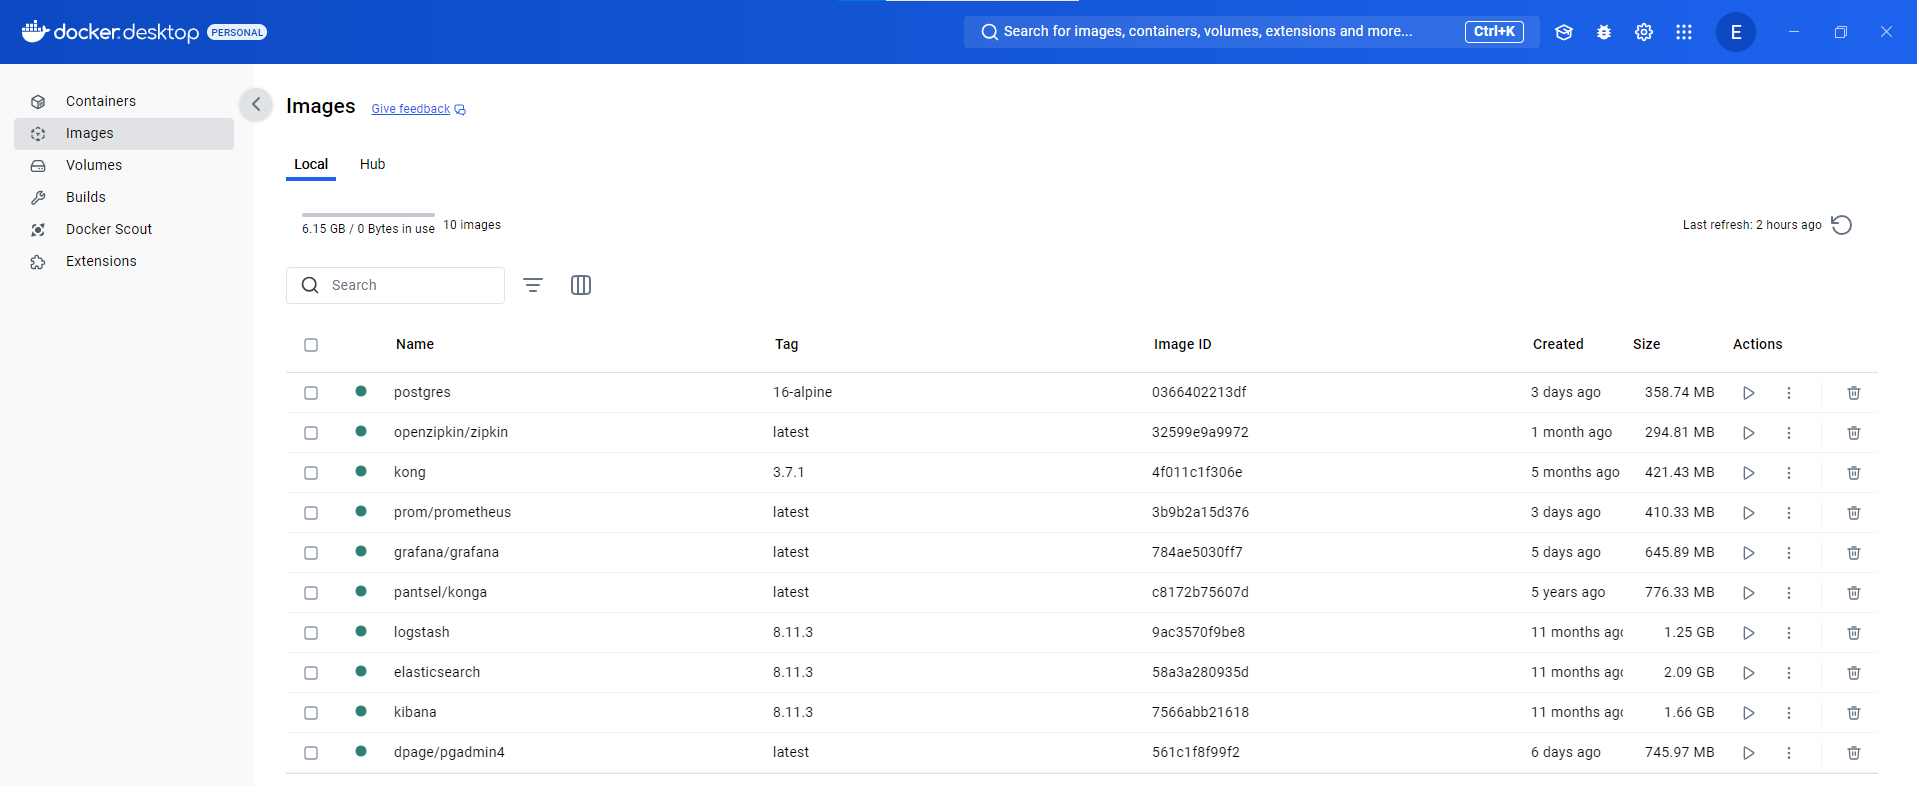
To check the images used:
$ docker images

REPOSITORY          TAG         IMAGE ID       CREATED         SIZE
postgres            16-alpine   0366402213df   2 days ago      359MB
prom/prometheus     latest      3b9b2a15d376   2 days ago      410MB
grafana/grafana     latest      784ae5030ff7   4 days ago      646MB
dpage/pgadmin4      latest      561c1f8f99f2   6 days ago      746MB
openzipkin/zipkin   latest      32599e9a9972   5 weeks ago     295MB
kong                3.7.1       4f011c1f306e   4 months ago    421MB
kibana              8.11.3      7566abb21618   11 months ago   1.67GB
elasticsearch       8.11.3      58a3a280935d   11 months ago   2.1GB
logstash            8.11.3      9ac3570f9be8   11 months ago   1.25GB
pantsel/konga       latest      c8172b75607d   4 years ago     776MB
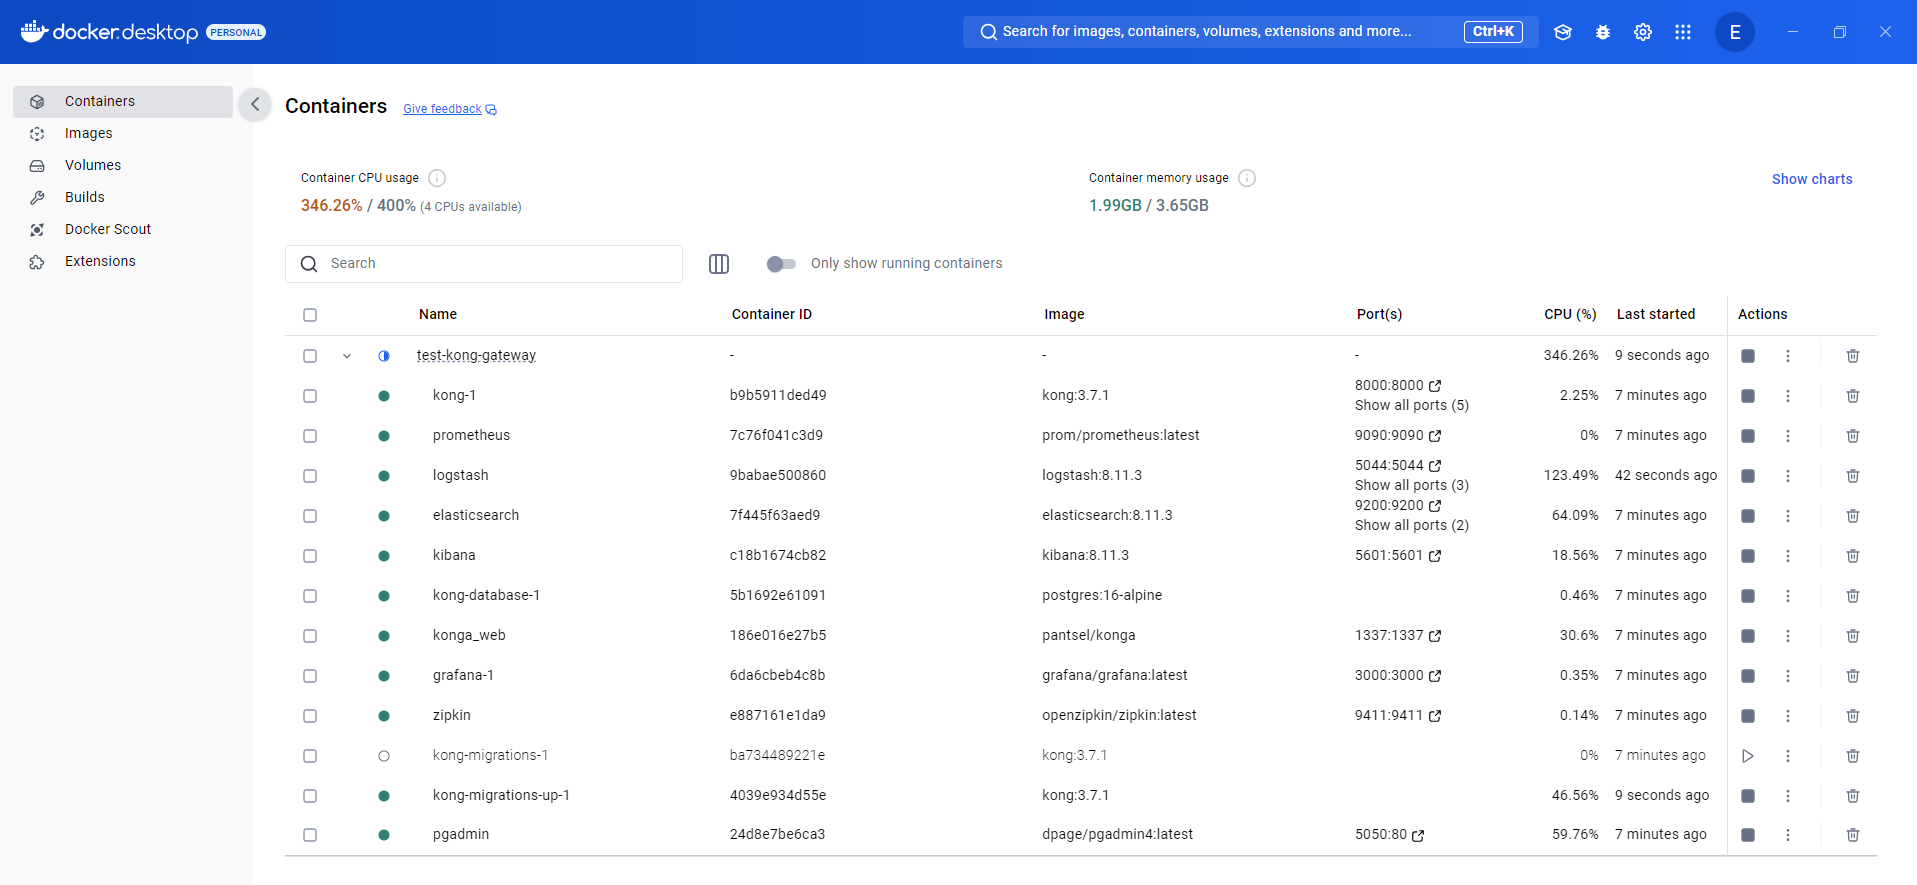
To check the running containers:
$ docker ps -a

CONTAINER ID   IMAGE                      COMMAND                  CREATED         STATUS                            PORTS                                                                                                          NAMES
24d8e7be6ca3   dpage/pgadmin4:latest      "/entrypoint.sh"         2 minutes ago   Up 2 minutes                      443/tcp, 0.0.0.0:5050->80/tcp                                                                                  pgadmin
4039e934d55e   kong:3.7.1                 "/docker-entrypoint.…"   2 minutes ago   Up 3 seconds (health: starting)   8000-8001/tcp, 8443-8444/tcp                                                                                    kong-migrations-up-1
ba734489221e   kong:3.7.1                 "/docker-entrypoint.…"   2 minutes ago   Exited (0) 2 minutes ago                                                                                                                          kong-migrations-1
186e016e27b5   pantsel/konga              "/app/start.sh"          2 minutes ago   Up 2 minutes                      0.0.0.0:1337->1337/tcp                                                                                         konga_web
5b1692e61091   postgres:16-alpine         "docker-entrypoint.s…"   2 minutes ago   Up 2 minutes (healthy)            5432/tcp                                                                                                        kong-database-1
c18b1674cb82   kibana:8.11.3              "/bin/tini -- /usr/l…"   2 minutes ago   Up 2 minutes                      0.0.0.0:5601->5601/tcp                                                                                         kibana
9babae500860   logstash:8.11.3            "/usr/local/bin/dock…"   2 minutes ago   Up 2 minutes                      0.0.0.0:5044->5044/tcp, 0.0.0.0:9600->9600/tcp, 0.0.0.0:5555->5555/udp                                         logstash
6da6cbeb4c8b   grafana/grafana:latest     "/run.sh"                2 minutes ago   Up 2 minutes                      0.0.0.0:3000->3000/tcp                                                                                          grafana-1
e887161e1da9   openzipkin/zipkin:latest   "start-zipkin"           2 minutes ago   Up 2 minutes (unhealthy)          9410/tcp, 0.0.0.0:9411->9411/tcp                                                                               zipkin
7c76f041c3d9   prom/prometheus:latest     "/bin/prometheus --c…"   2 minutes ago   Up 2 minutes                      0.0.0.0:9090->9090/tcp                                                                                         prometheus
7f445f63aed9   elasticsearch:8.11.3       "/bin/tini -- /usr/l…"   2 minutes ago   Up 2 minutes                      0.0.0.0:9200->9200/tcp, 0.0.0.0:9300->9300/tcp                                                                 elasticsearch
b9b5911ded49   kong:3.7.1                 "/docker-entrypoint.…"   2 minutes ago   Up 2 minutes (healthy)            0.0.0.0:8000->8000/tcp, 127.0.0.1:8001-8002->8001-8002/tcp, 0.0.0.0:8443->8443/tcp, 127.0.0.1:8444->8444/tcp    kong-1
To filter the columns:
docker ps -a --format "table {{.ID}}\t{{.Image}}\t{{.Status}}\t{{.Names}}"
It should now return the selected columns:
CONTAINER ID   IMAGE                      STATUS                             NAMES
24d8e7be6ca3   dpage/pgadmin4:latest      Up 3 minutes                       pgadmin
4039e934d55e   kong:3.7.1                 Up 21 seconds (health: starting)    kong-migrations-up-1
ba734489221e   kong:3.7.1                 Exited (0) 2 minutes ago            kong-migrations-1
186e016e27b5   pantsel/konga              Up 3 minutes                       konga_web
5b1692e61091   postgres:16-alpine         Up 3 minutes (healthy)              kong-database-1
c18b1674cb82   kibana:8.11.3              Up 3 minutes                       kibana
9babae500860   logstash:8.11.3            Up 3 minutes                       logstash
6da6cbeb4c8b   grafana/grafana:latest     Up 3 minutes                        grafana-1
e887161e1da9   openzipkin/zipkin:latest   Up 3 minutes (healthy)             zipkin
7c76f041c3d9   prom/prometheus:latest     Up 3 minutes                       prometheus
7f445f63aed9   elasticsearch:8.11.3       Up 3 minutes                       elasticsearch
b9b5911ded49   kong:3.7.1                 Up 3 minutes (healthy)              kong-1
Checking on Docker Desktop
If you have Docker Desktop installed on your local computer, you can also view the images and containers from the Docker Desktop console.
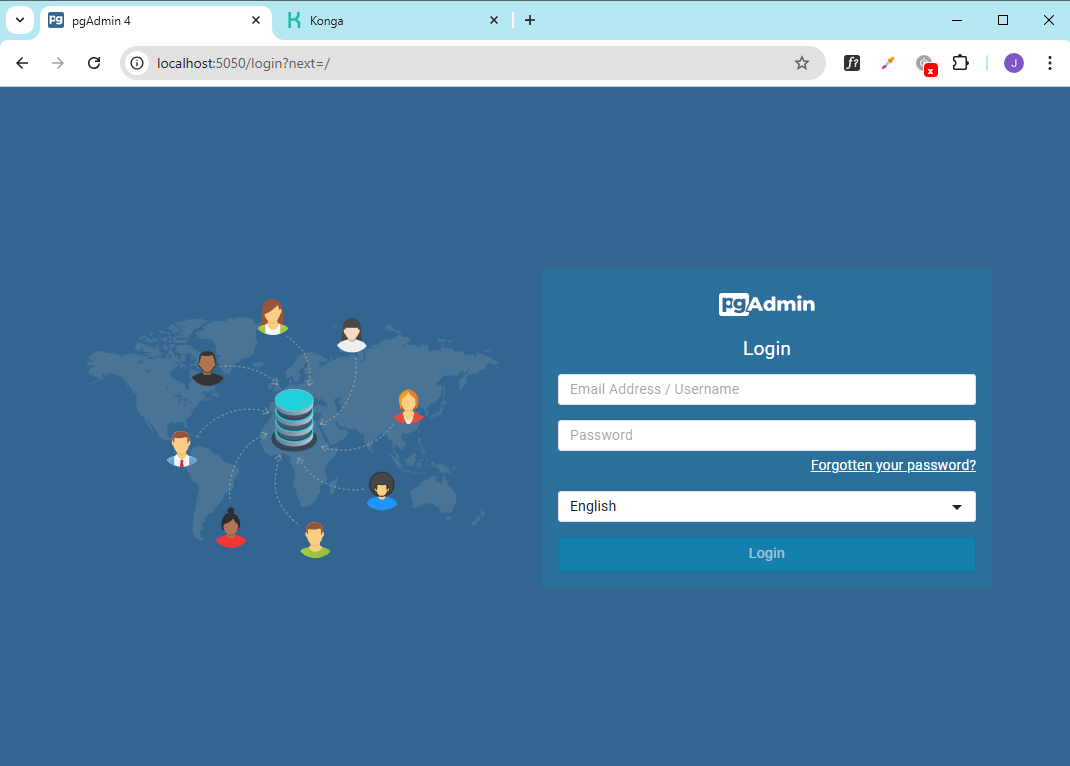
Connect to the Kong Database
Access the pgAdmin dashboard from the web browser and login using the credentials specified in the docker-compose.yaml file.
localhost:5050
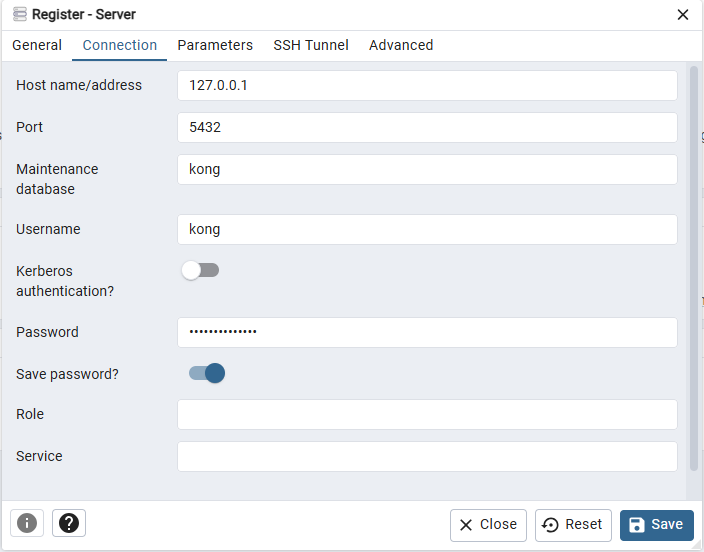
Right-click on Servers > Register > Server. Fill-in the fields with the details below and click Save afterwards.
| Tab | Field | Value |
|---|---|---|
| General | Name | Kong |
| Connection | Hostname | kong-database |
| Connection | Port | 5432 |
| Connection | Maintenance database | kong |
| Connection | Username | kong |
| Connection | Password | mykongpassword |
If you have pgAdmin installed on your local computer, you can also use it to connect to the Kong database. Use the same values except the Hostname.
| Tab | Field | Value |
|---|---|---|
| Connection | Hostname | localhost |
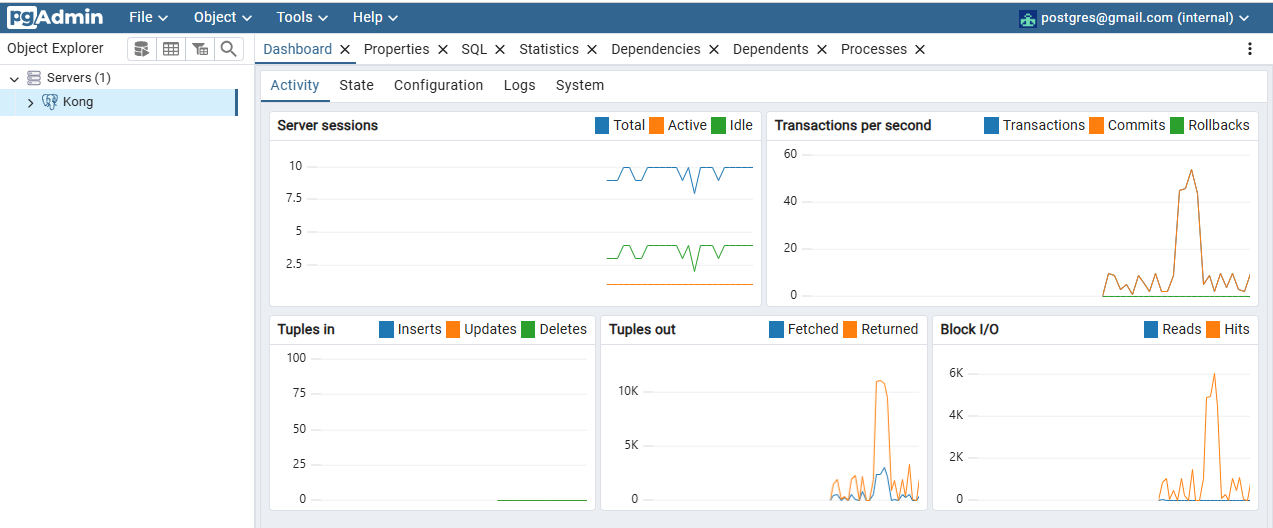
After you login, you'll see the main dashboard.
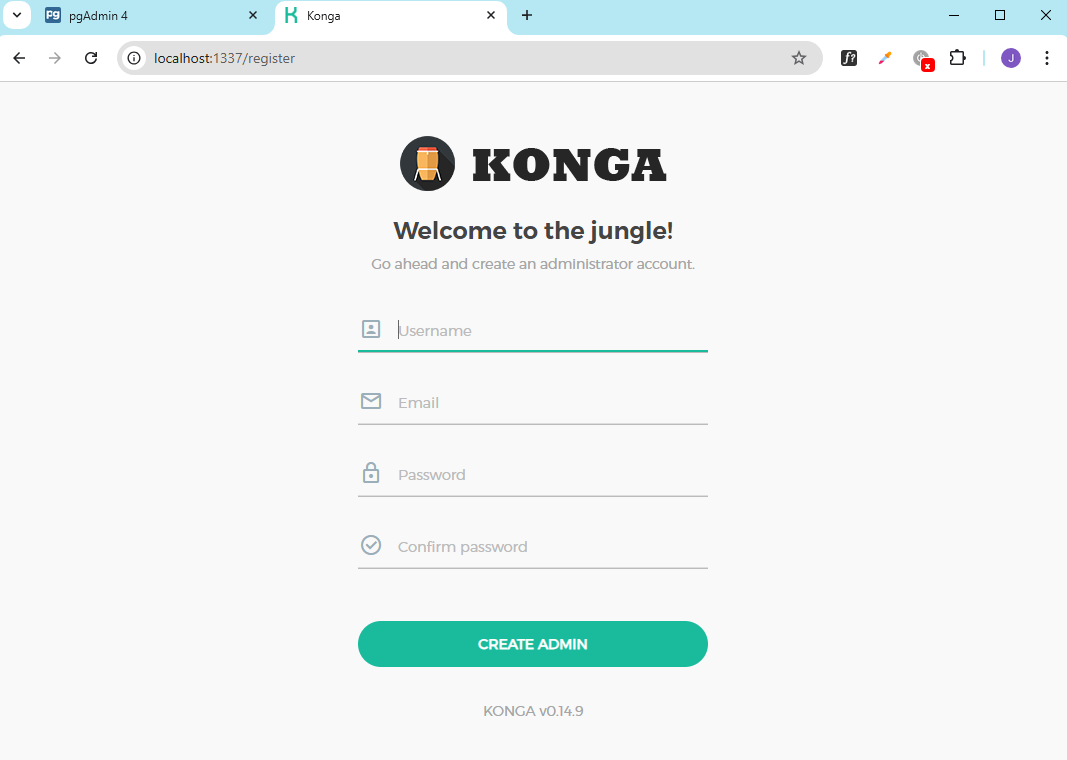
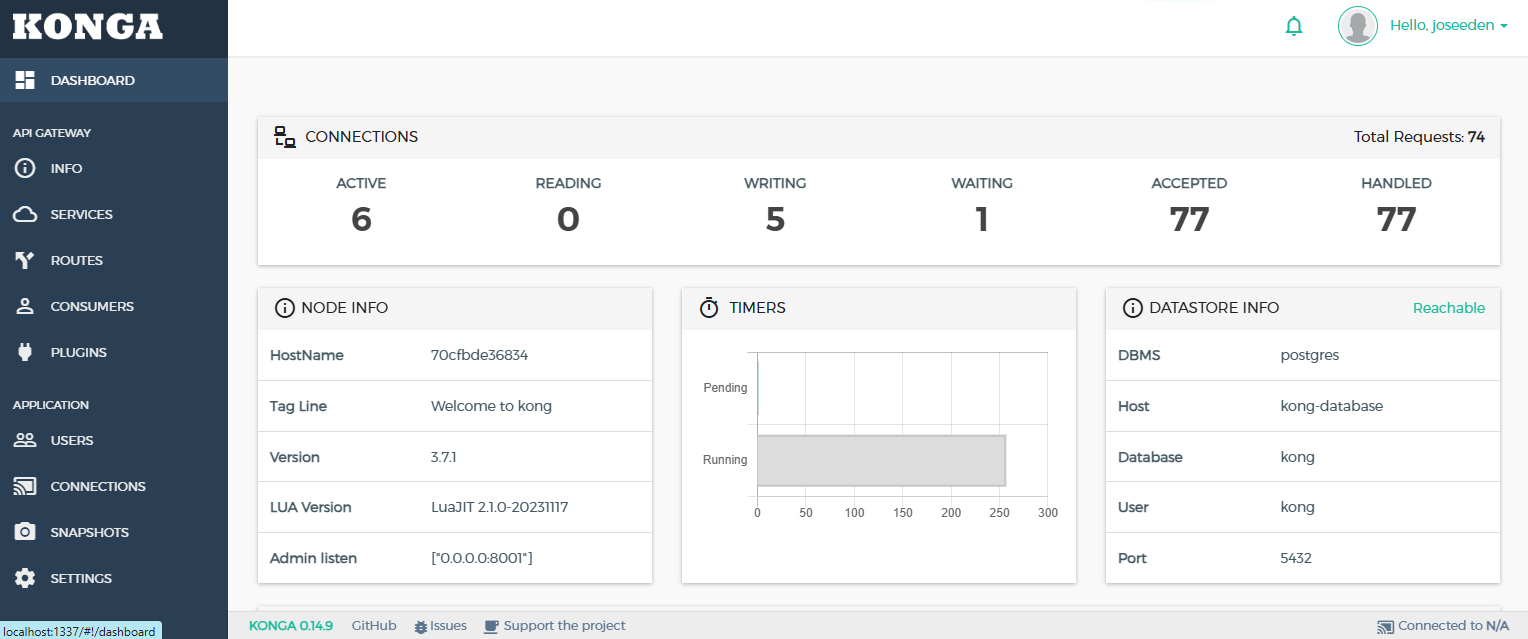
Connect to Konga
Open another tab to access the Konga dashboard.
localhost:1337
Enter a username, email, and password, then click Create Admin. You will need to login using the new username and password.
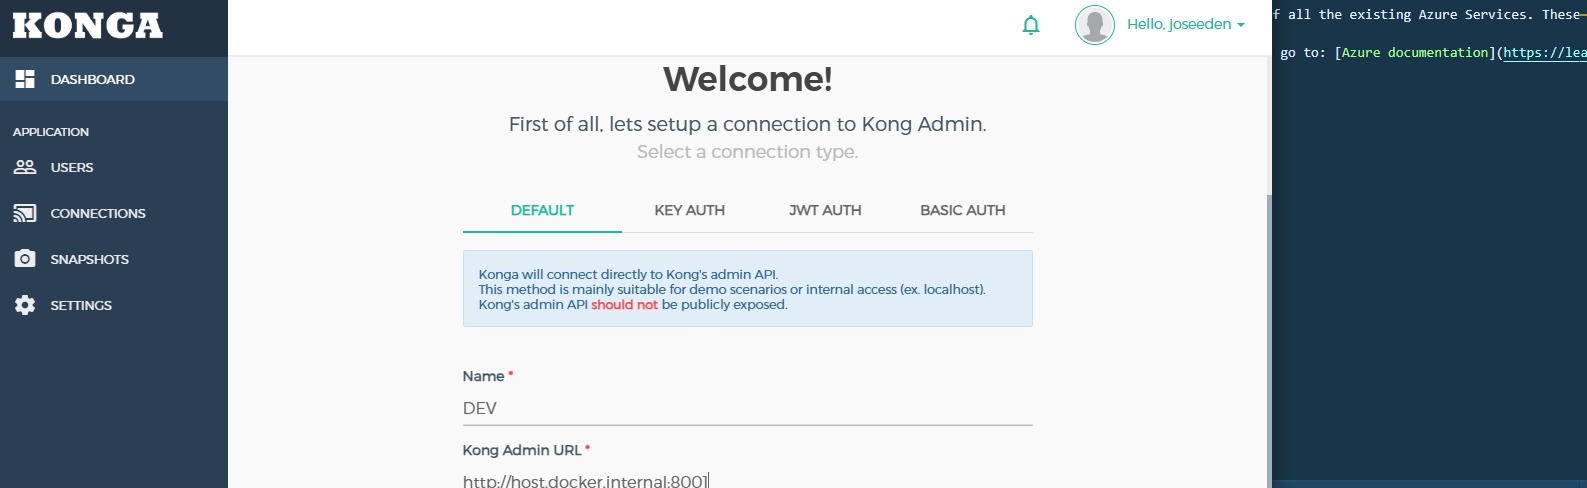
In the Welcome page, enter the details below and click CREATE CONNECTION.
| Field | Value |
|---|---|
| Name | DEV |
| Kong Admin URL | http://host.docker.internal:8001 |
The main dashboard:
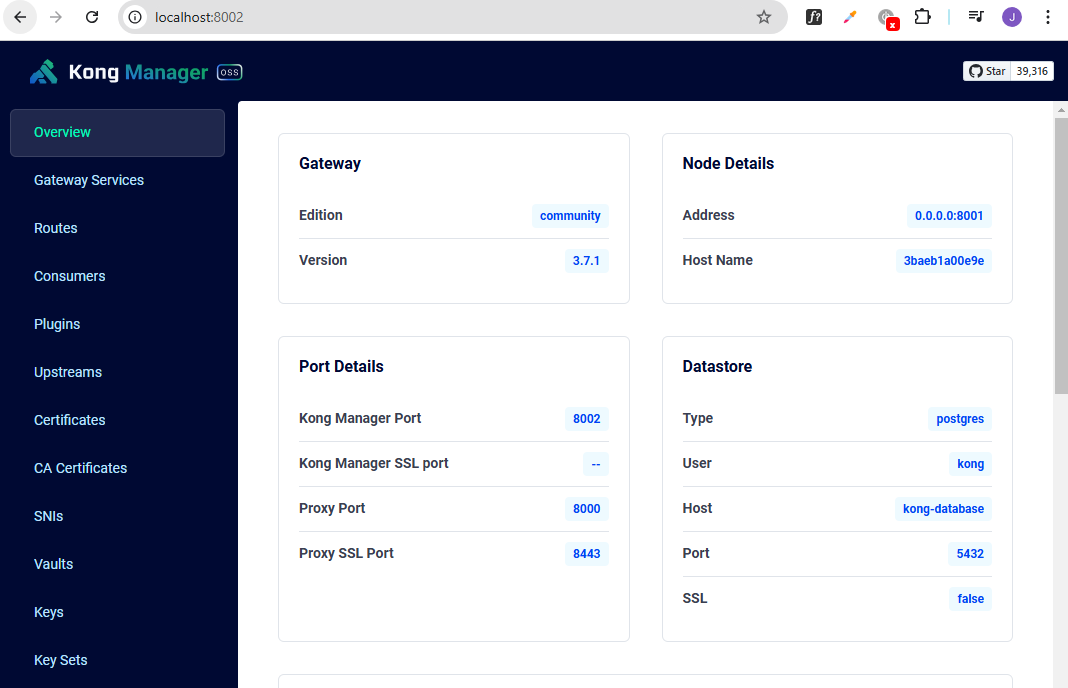
Connect to Kong Manager
The Kong Manager can be accessed via:
<server-ip>:8002
Testing Kong with API Endpoints
Kong can be tested by interacting with its API endpoints to verify its functionality and ensure proper configuration. This includes testing features like routing, authentication, rate limiting, and logging by sending sample requests to defined services and routes.
For more information, please see:
Remove Containers
To remove the containers:
$ docker-compose down

[+] Running 12/12
 ✔ Container kong-migrations-up-1  Removed                                                                                                                                                        0.4s
 ✔ Container prometheus                              Removed                                                                                                                                                        0.3s
 ✔ Container logstash                                Removed                                                                                                                                                        2.2s
 ✔ Container grafana-1             Removed                                                                                                                                                        0.4s
 ✔ Container kong-migrations-1     Removed                                                                                                                                                        0.5s
 ✔ Container kong-migrations-1     Removed                                                                                                                                                        0.5s
 ✔ Container zipkin                                  Removed                                                                                                                                                        0.3s
 ✔ Container elasticsearch                           Removed                                                                                                                                                        1.9s
 ✔ Container kibana                                  Removed                                                                                                                                                        1.7s
 ✔ Container konga_web                               Removed                                                                                                                                                        1.7s
 ✔ Container kong-database-1       Removed                                                                                                                                                        1.3s
 ✔ Container kong-1                Removed                                                                                                                                                        2.9s
 ✔ Network kong-net                 Removed
To verify:
$ docker ps -a

CONTAINER ID   IMAGE     COMMAND   CREATED   STATUS    PORTS     NAMES