Traefik Dashboard
Overview
The dashboard gives a clear view of your traffic system and running services.
- Quick health check of traffic and services
- Helps with troubleshooting and monitoring
- Shows warnings and errors
To setup the dashboard and a simple test service, please see Deploy Traefik with Docker.
Access the Dashboard
To access the Traefik dashboard:
- Open
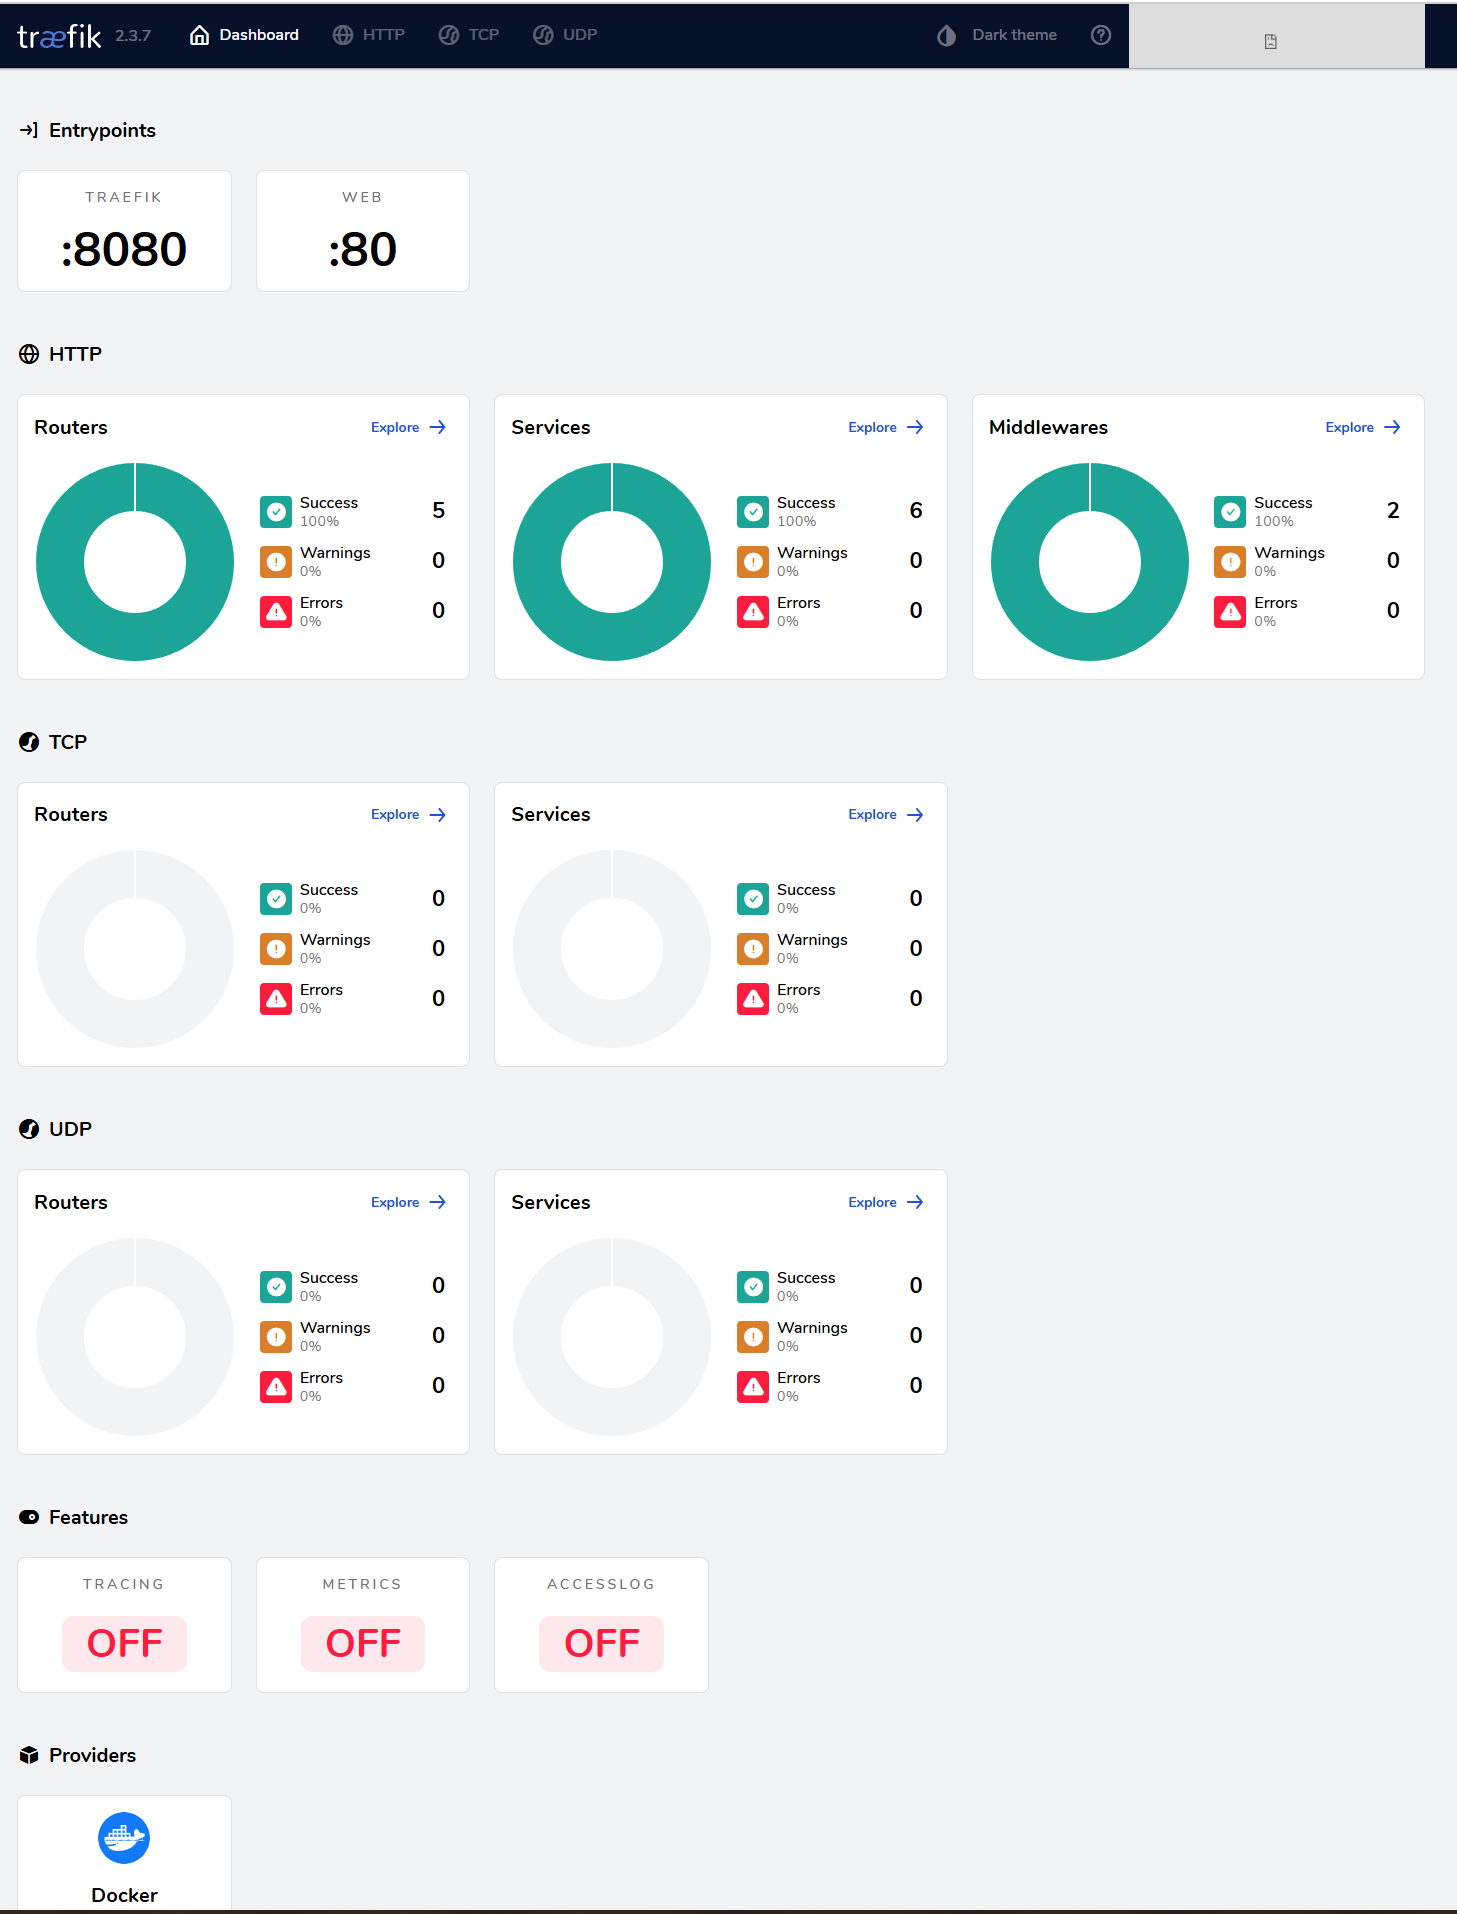
http://0.0.0.0:8080to access the dashboard. - Port 80 handles traffic; port 8080 shows the dashboard.
- Dashboard shows HTTP, TCP, UDP services and key features.
NOTE: If you get ERR_ADDRESS_INVALID when you try to access http://0.0.0.0:8080 in your dashboard, this means the browser cannot use the specific address as a destination address:
Instead, use the localhost:
http://localhost:8080/
Routers and Services
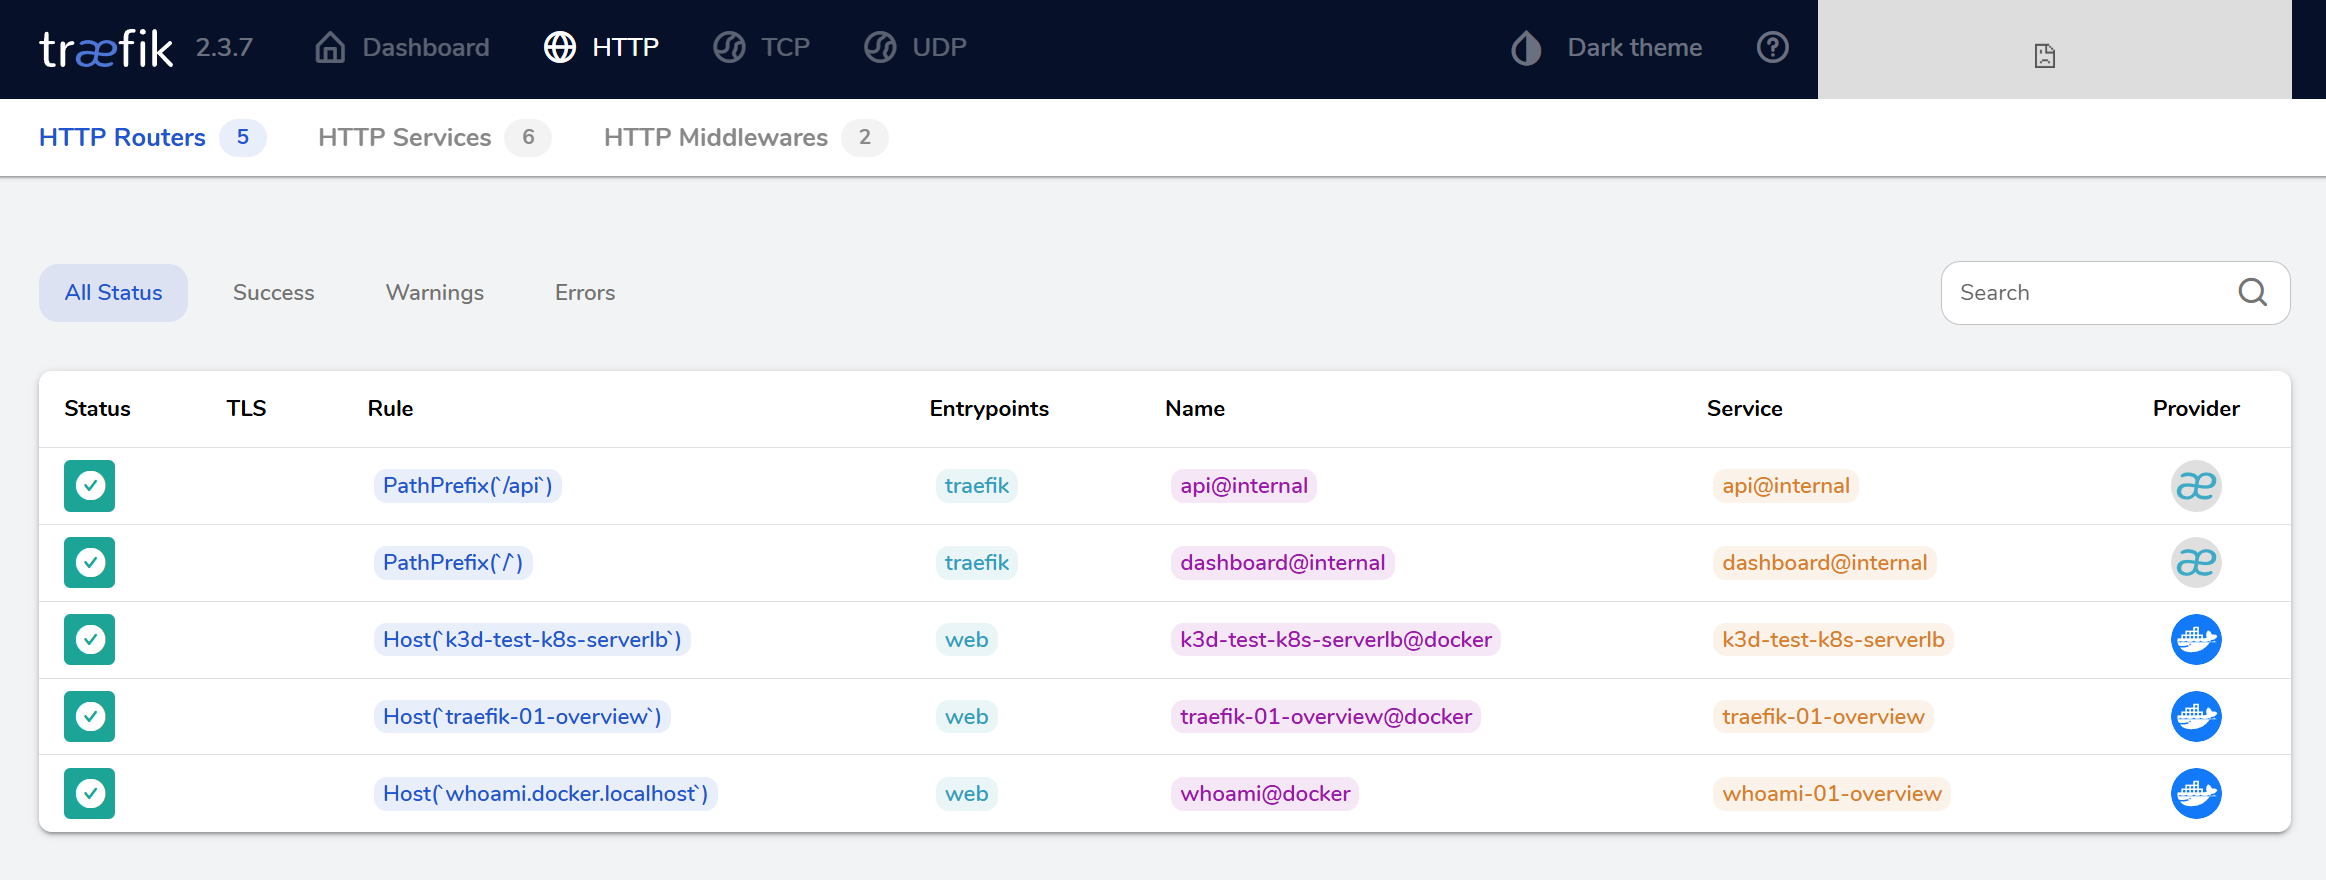
Routers allow you easily check traffic flow and service health.
- Routers handle incoming traffic.
- Services are backend targets.
- Shows entry points, status, and container IPs.
For example, the dashboard itself runs under the dashboard@internal service:
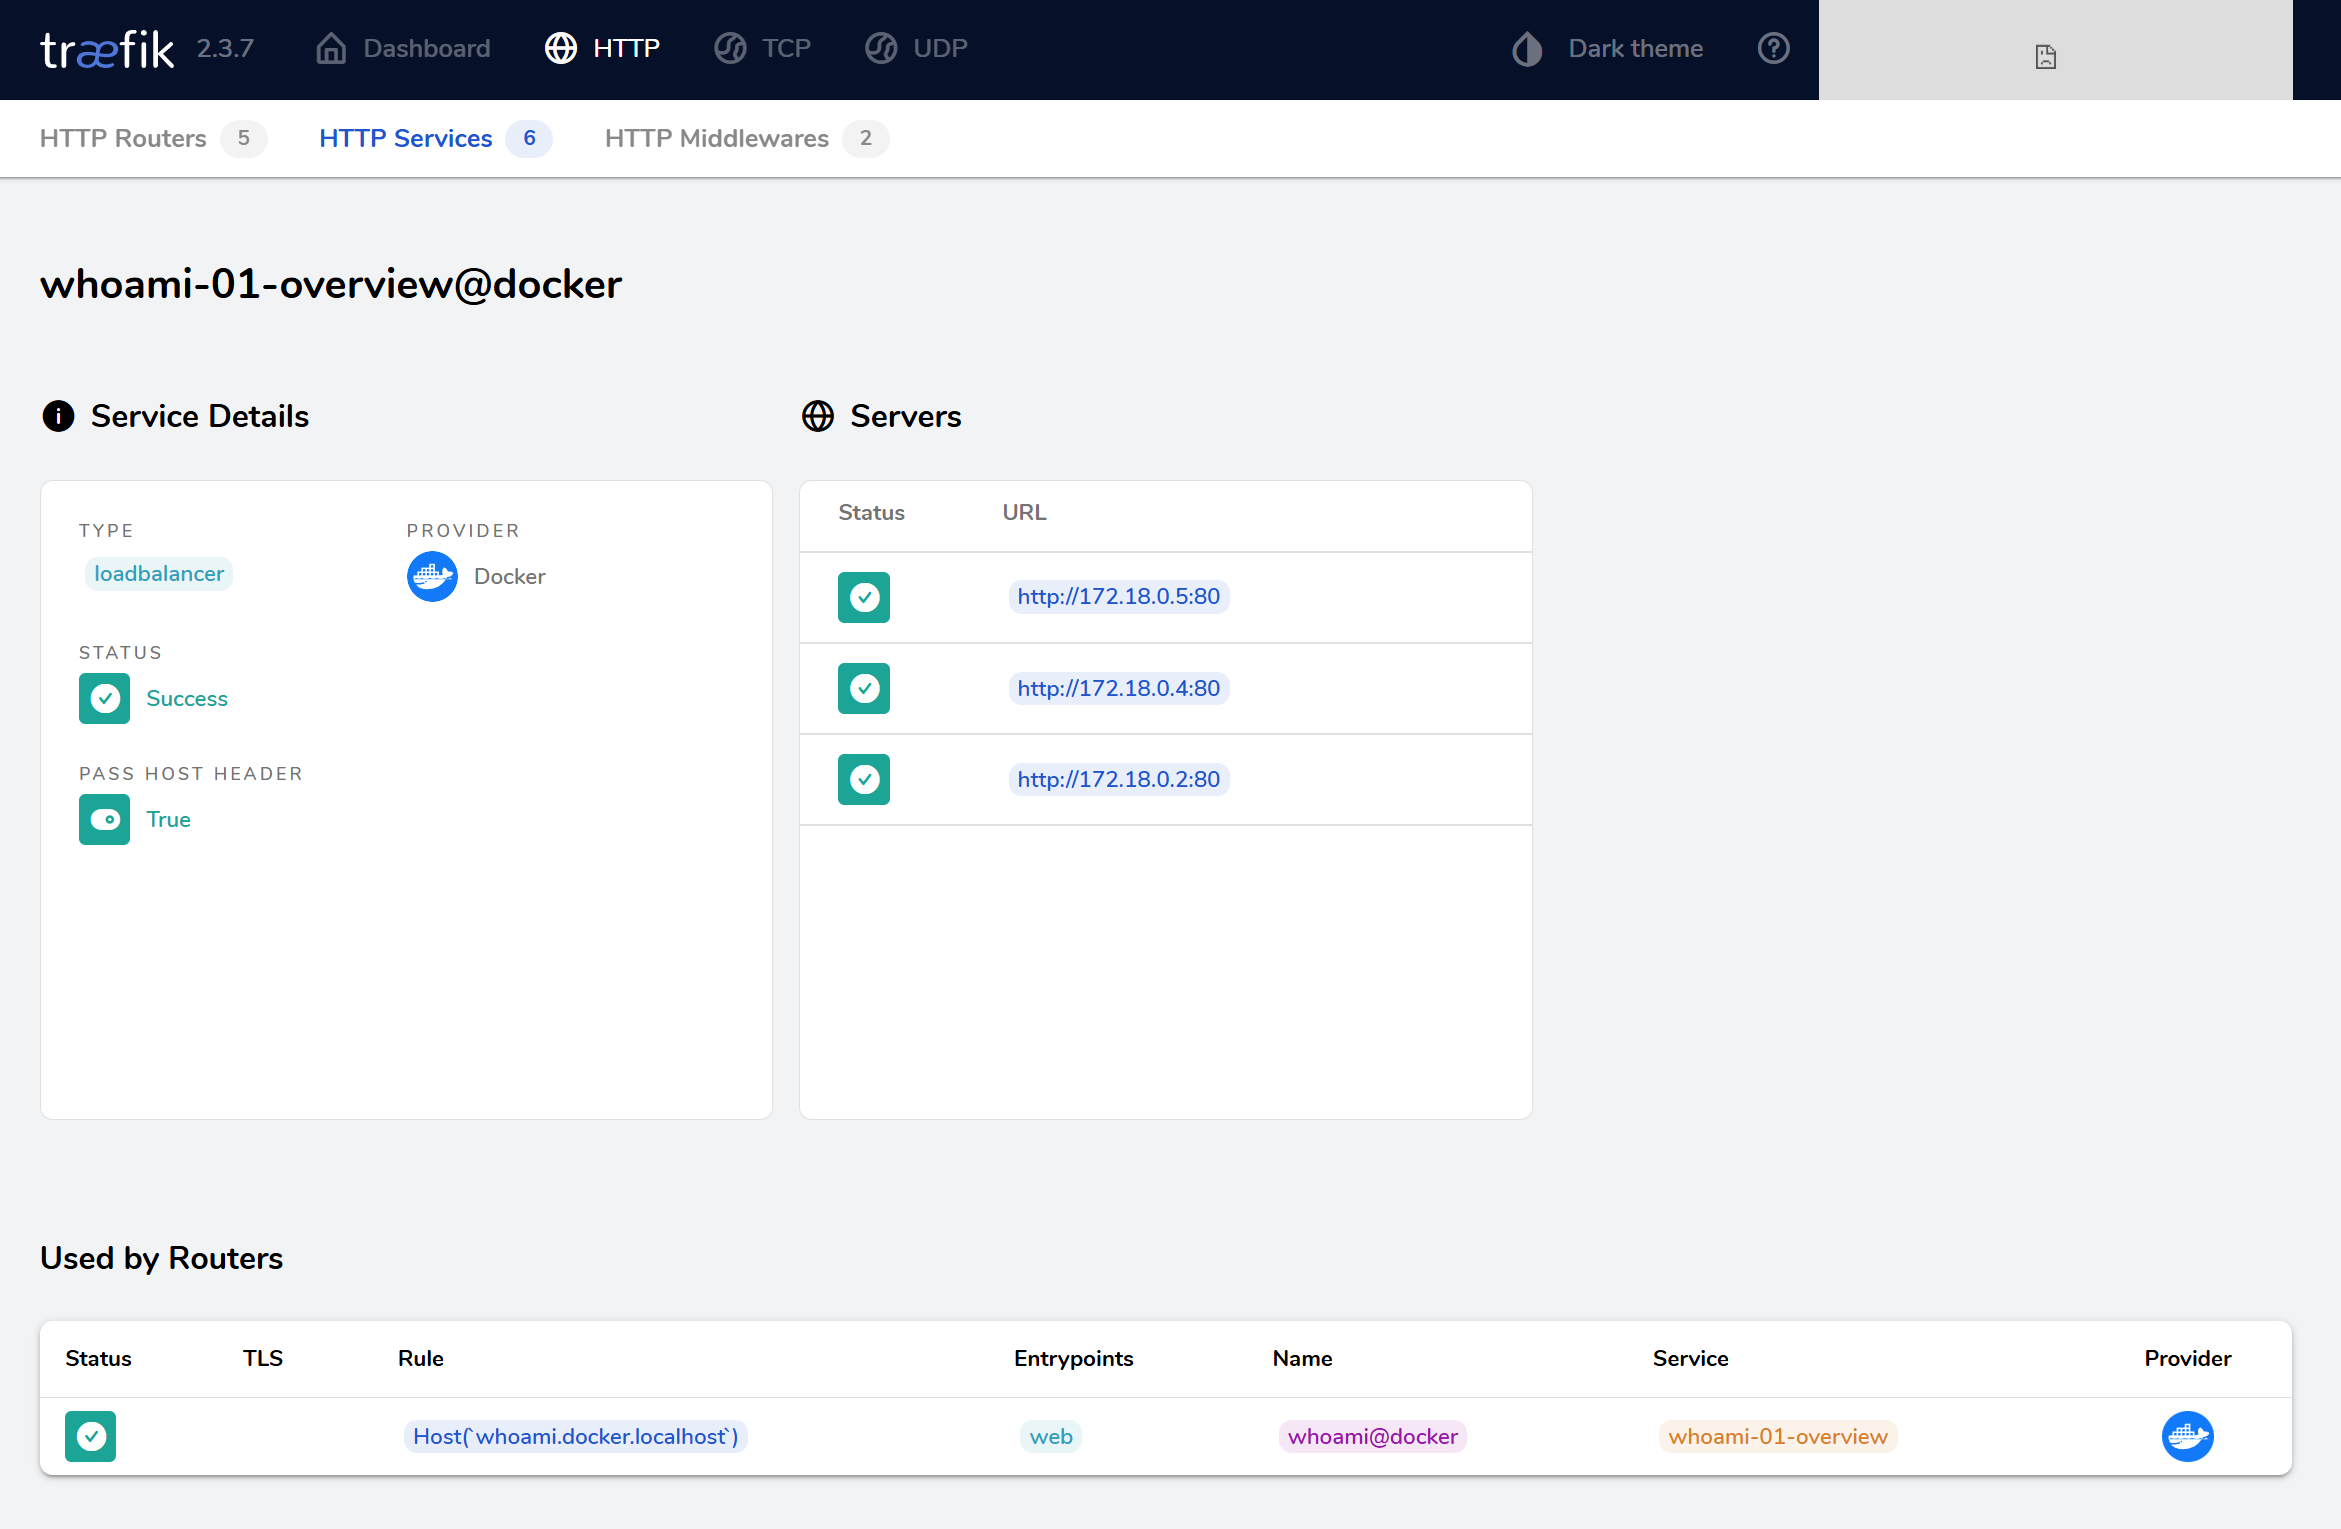
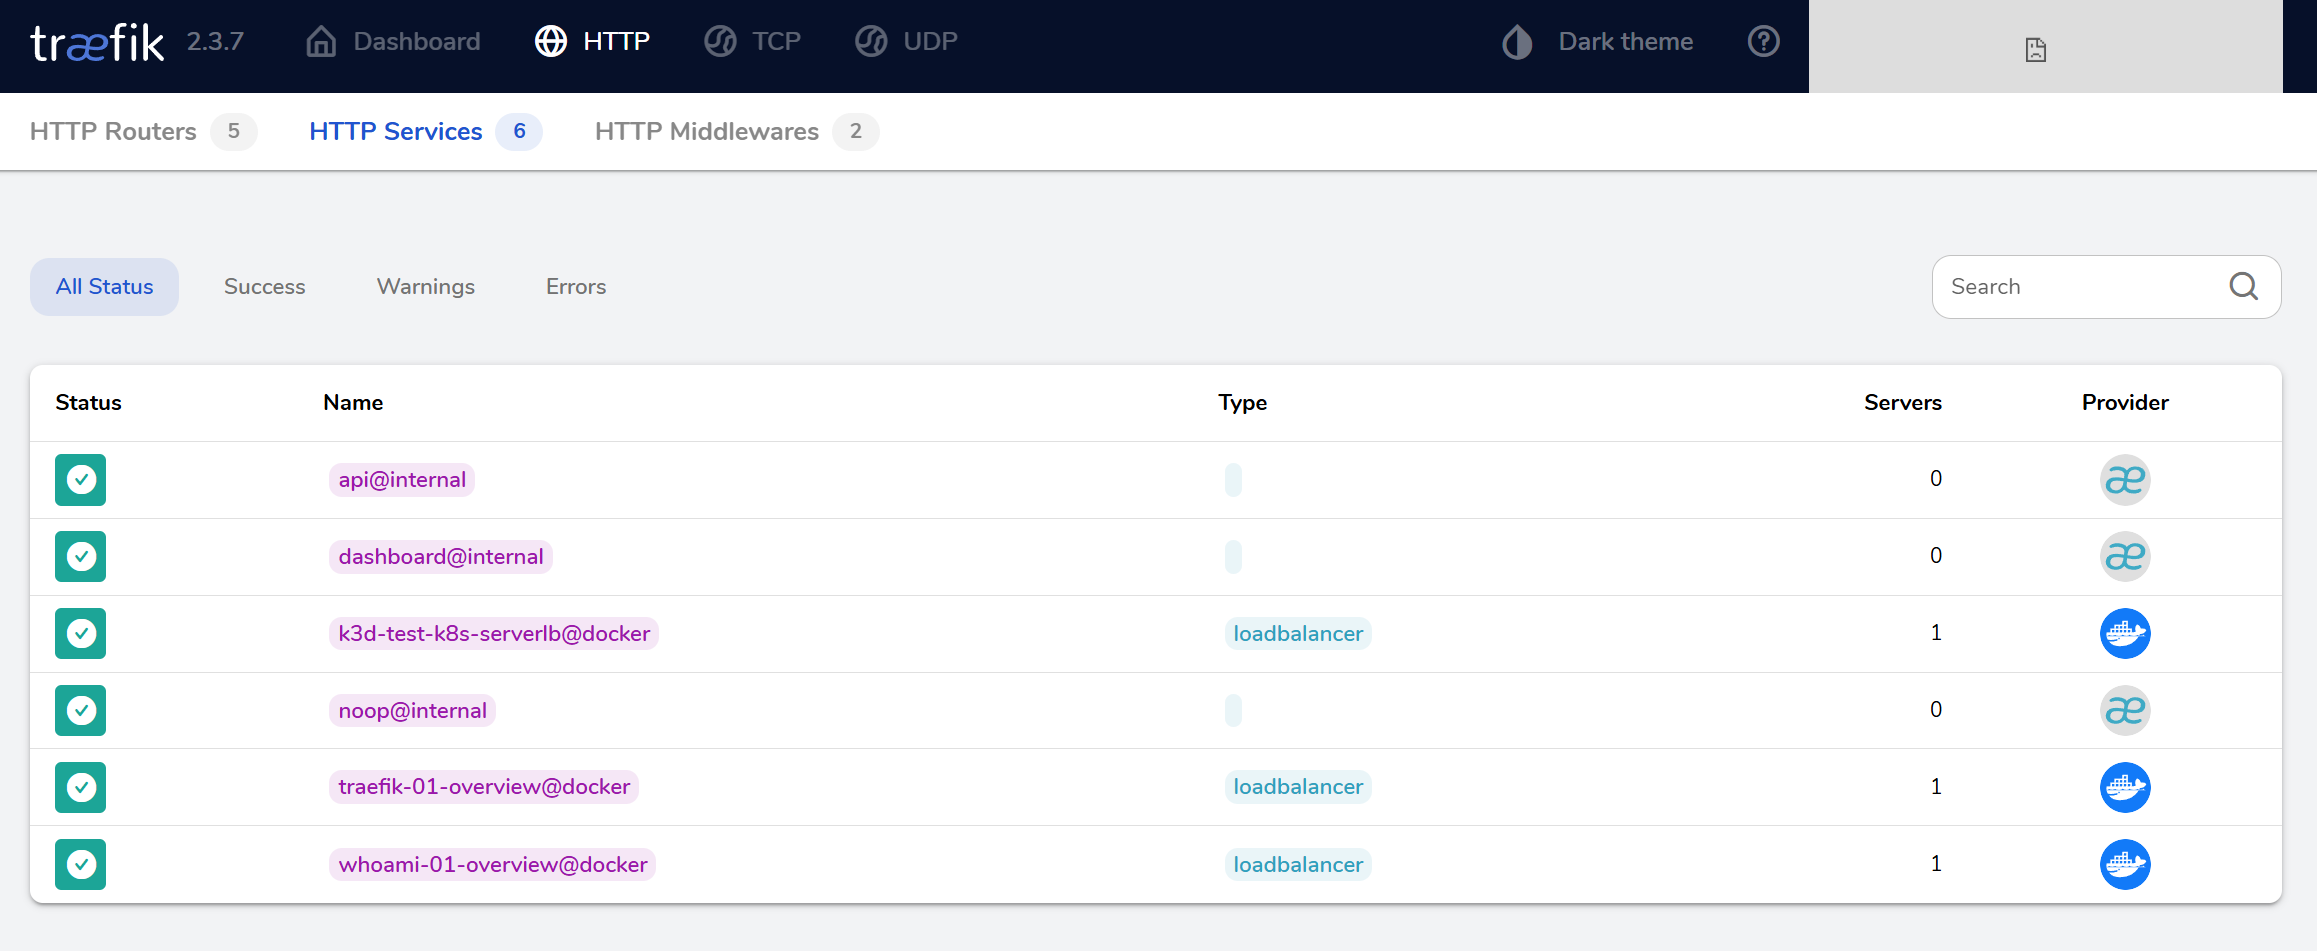
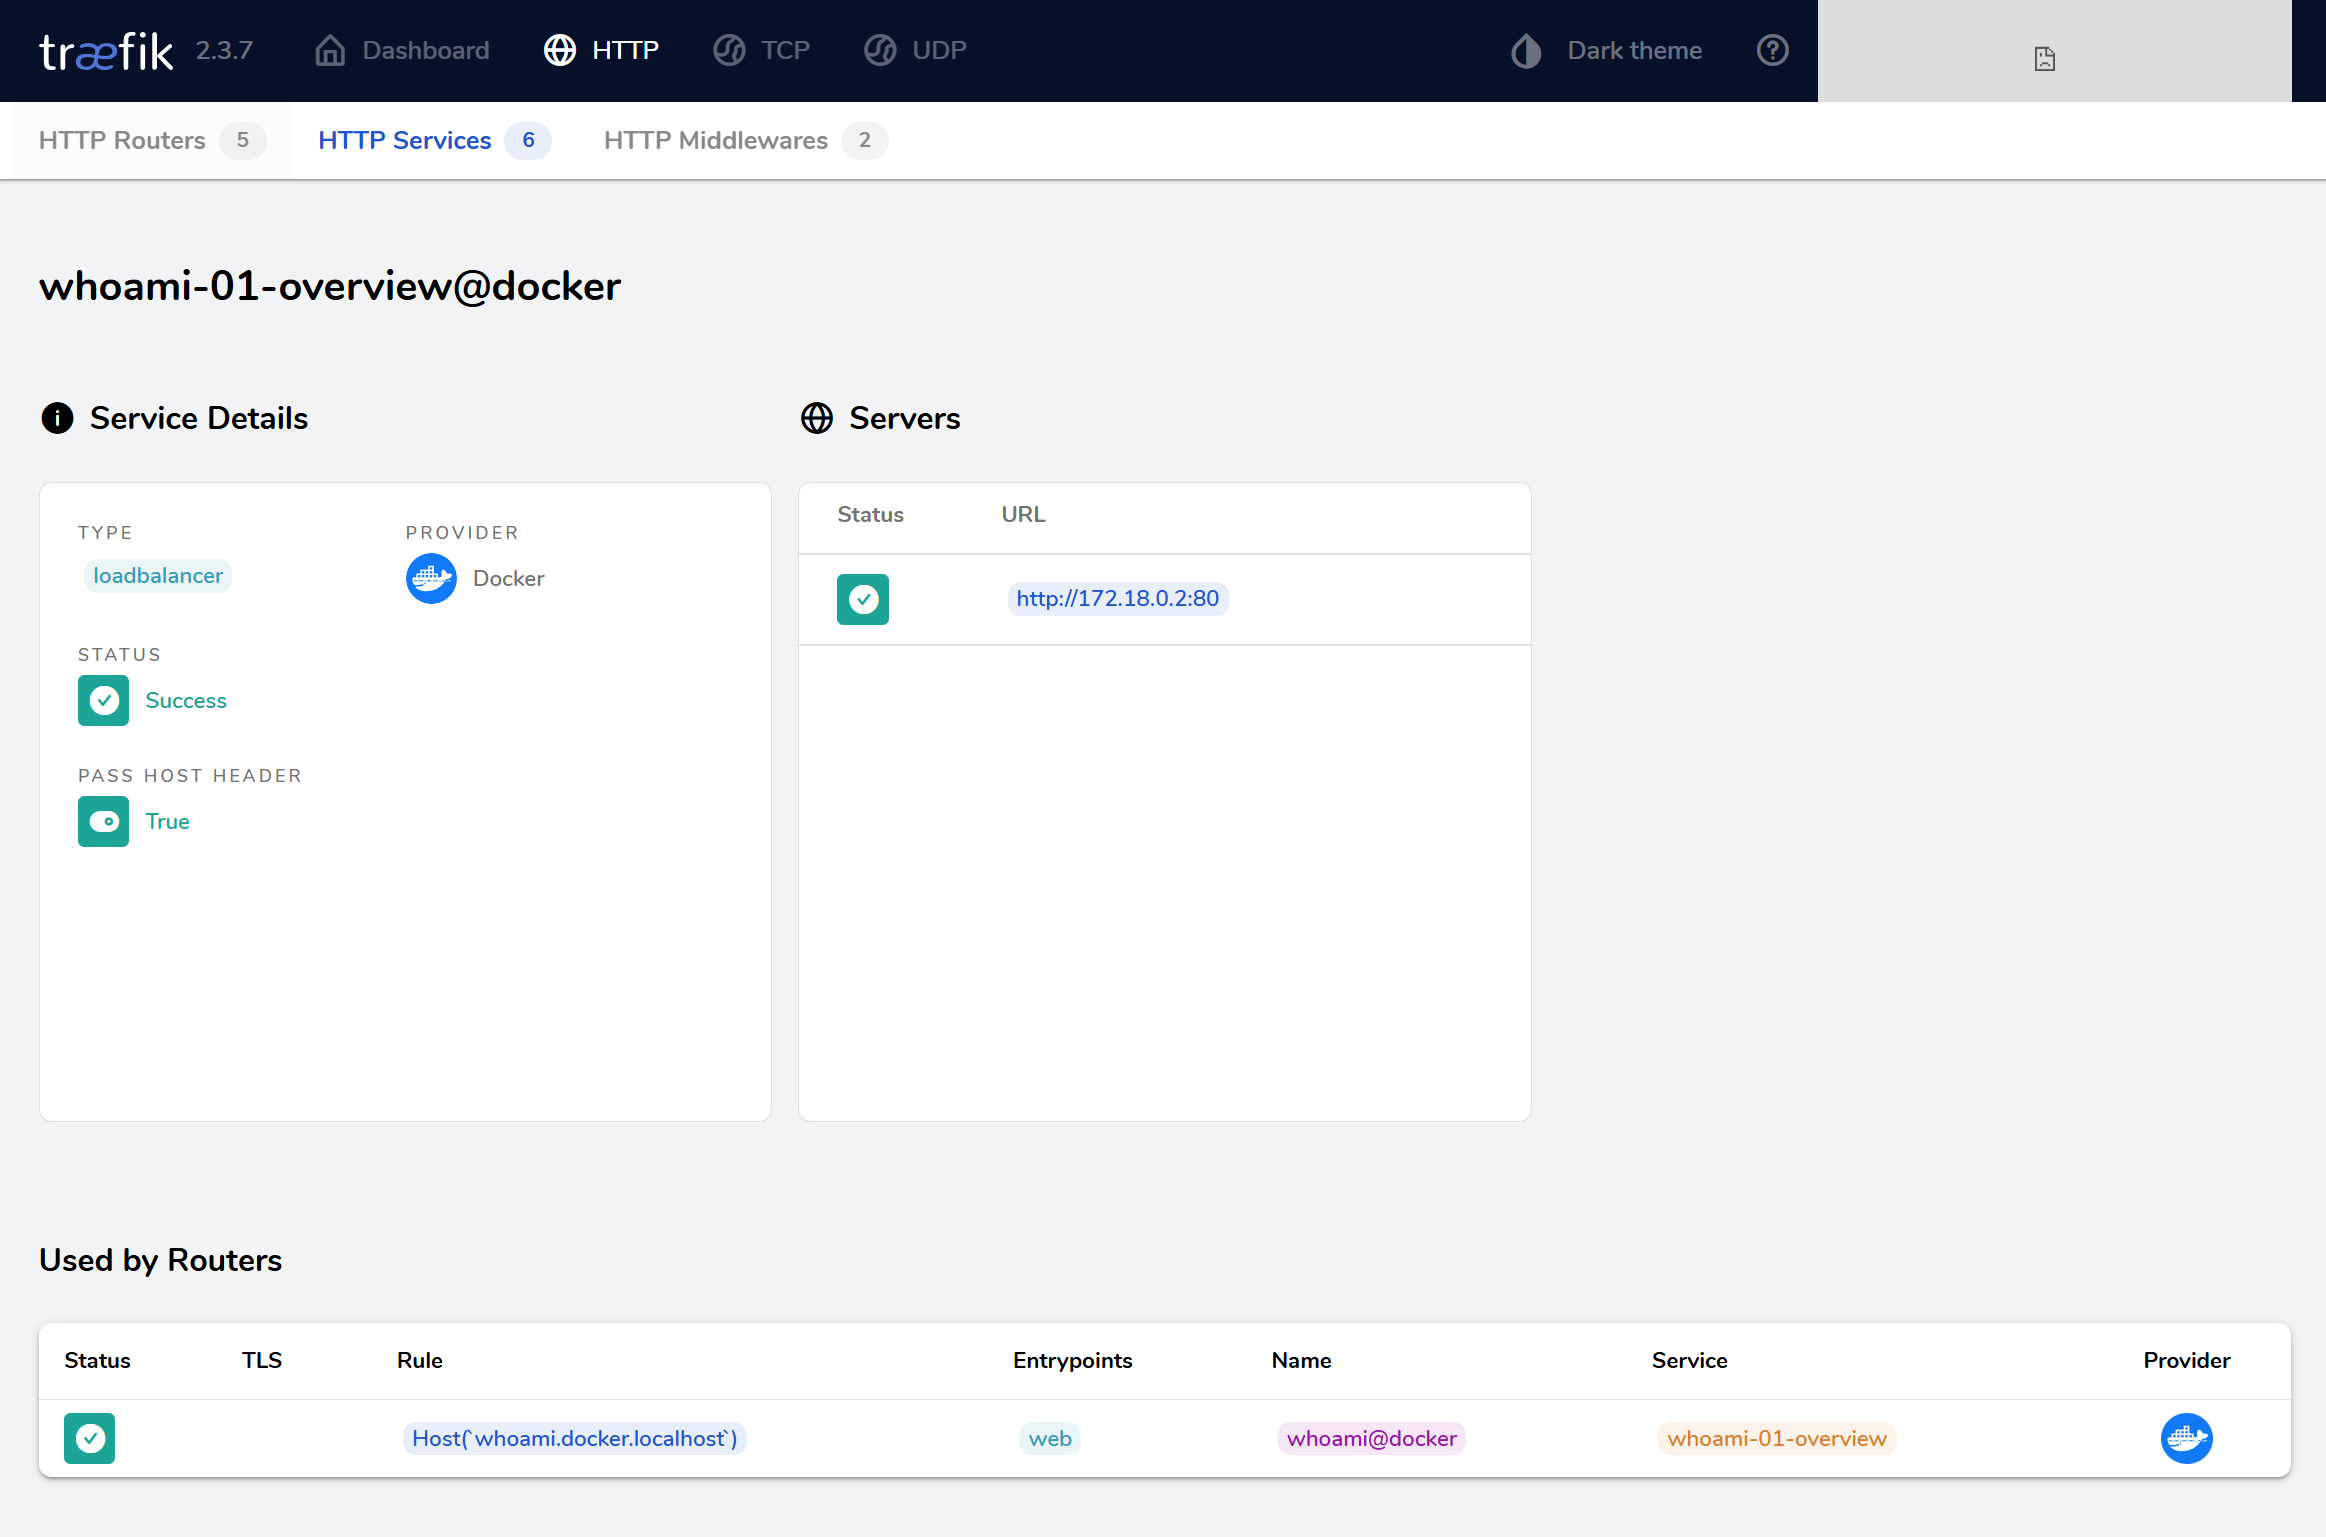
If you click the HTTP Services tab, you will see all the active services. In this example, one of them is whoami-01-overview@docker:
If you click the service, you can see more details like health and endpoints:
Open a terminal and scale the whoami service to three containers:
docker compose scale whoami=3
The whoami service is deployed with Docker.
Please see Deploy Traefik with Docker.
Going back to your browser, you should now see three servers listed for the whoami service.