Azure Monitor
Overview
Cloud applications can fail without anyone noticing. Monitoring helps detect problems early so they can be fixed before users are affected.
- Applications can fail silently
- Production environments experience traffic spikes and network issues
- Monitoring provides visibility into system health
In real environments, systems behave differently under load. Without monitoring, issues may only be discovered when users report them. This makes troubleshooting slower and can impact availability.

Azure Monitor acts as a safety net for your resources.
- Collects telemetry from Azure resources
- Tracks services like virtual machines, storage accounts, and web apps
- Helps detect and respond to issues early
Azure Monitor continuously gathers data about how your resources behave. This visibility helps identify problems quickly and keeps applications healthy and reliable.
Using Azure Monitor
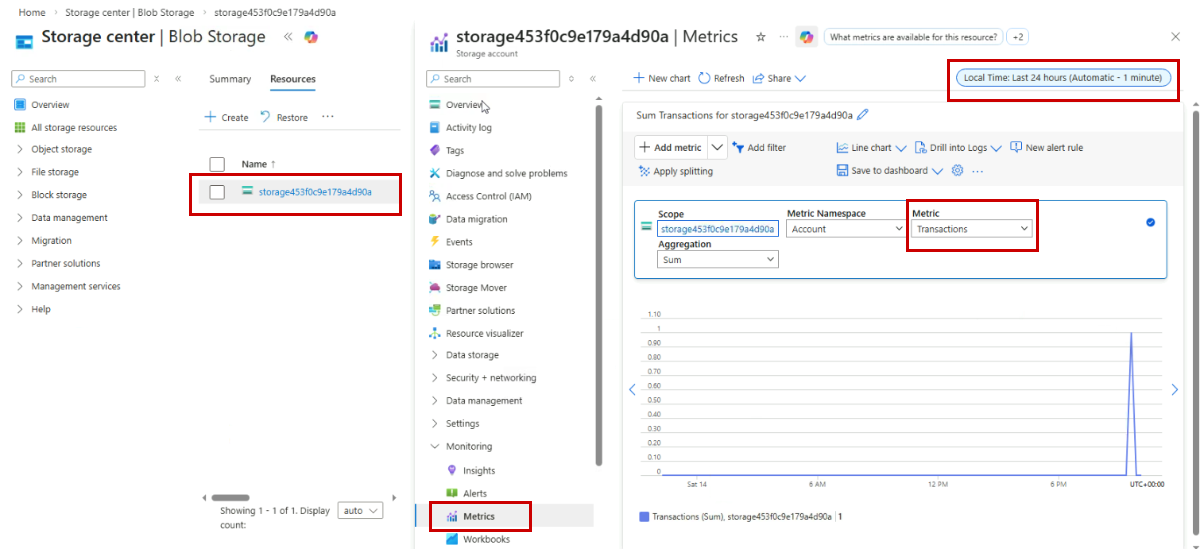
Azure Monitor can be used to check the health of resources, like for example, checking the activity of an Azure Storage account. We can use it to monitor storage transactions to confirm that requests are being processed normally.
Steps:
- Navigate to the Azure portal
- Open your Storage account resource
- Go to the Metrics section
- Select the
Transactionsmetric - Set the time range to the last 24 hours
In this example, the Transactions metric shows how many read and write operations occur on the storage account. Viewing the last 24 hours helps you quickly see usage patterns or detect unusual spikes or drops in activity.
Monitoring metrics like transactions gives a quick view of the storage account’s health and activity, which helps detect issues early and maintain reliable services.
Core Components
Azure Monitor uses several components that work together to monitor applications.
| Component | Description |
|---|---|
| Metrics | Provide real-time performance measurements |
| Logs | Capture detailed event information |
| Alerts | Notify you when conditions are met |
| Dashboards | Display monitoring data in one place |
Together, these components help detect issues early, investigate problems, and maintain application performance.
Metrics
Metrics provide real-time measurements of resource performance and health.
- Metrics track numerical performance data
- Examples include CPU usage, memory usage, and network activity
- Metrics update frequently for near real-time visibility
In the example below, the metric cpuPercentage tracks CPU load for a VM. You can use this to detect overload quickly.
az monitor metrics list \
  --metric CPUPercentage \
  --resource /subscriptions/<sub>/resourceGroups/<rg>/providers/Microsoft.Compute/virtualMachines/<vm>
Expected result: A JSON response with CPUPercentage values over time and the measurement timestamps.
{
  "cost": 0,
  "timespan": "2021-03-14T22:00:00Z/2021-03-14T22:10:00Z",
  "interval": "PT1M",
  "value": [
    {
      "id": "/subscriptions/<sub>/resourceGroups/<rg>/providers/Microsoft.Compute/virtualMachines/<vm>/providers/microsoft.insights/metrics/CPUPercentage",
      "type": "Microsoft.Insights/metrics",
      "name": {
        "value": "Percentage CPU",
        "localizedValue": "CPU Percentage"
      },
      "unit": "Percent",
      "timeseries": [
        {
          "metadatavalues": [],
          "data": [
            {"timeStamp": "2021-03-14T22:00:00Z", "average": 12.1},
            {"timeStamp": "2021-03-14T22:01:00Z", "average": 15.0},
            {"timeStamp": "2021-03-14T22:02:00Z", "average": 18.9},
            {"timeStamp": "2021-03-14T22:03:00Z", "average": 23.4},
            {"timeStamp": "2021-03-14T22:04:00Z", "average": 27.8}
          ]
        }
      ]
    }
  ]
}
Collect and View Metrics
Metrics show how your Azure resources are performing. They give real-time numbers to track health and usage.
- Metrics are like a heartbeat for your resources
- Azure collects them automatically when you create resources
- No installation or coding is needed
Azure tracks things like transaction counts, data uploaded and downloaded, availability, and latency for services such as storage accounts, virtual machines, and databases.

Here are sample metrics for a storage account managing files and documents:
| Metric | Description |
|---|---|
| Transactions | Number of read and write operations |
| Ingress | Amount of data uploaded |
| Egress | Amount of data downloaded |
| Availability | Percentage of time storage is accessible |
Customize Metrics Views
You can adjust how metrics are displayed in Metrics Explorer:
- Change the time range to last hour, day, week, or custom period
- Add multiple metrics to the same chart for comparison
- Split metrics by dimensions like API name or response type
- Apply aggregations such as sum, average, minimum, or maximum

Metrics vs Logs
Metrics and logs serve different purposes:
| Type | Details |
|---|---|
| Metrics |
|
| Logs |
|
Metrics give fast insights, while logs provide detailed context for investigation.

Logs
Logs store detailed event-level information about what happened in the system.
- Logs capture specific events and operations
- Logs include error messages and timestamps
- Logs provide context for troubleshooting problems
While metrics show trends, logs explain exactly what happened. This detailed information helps identify the root cause of issues.
Example: The command below queries the Log Analytics workspace for failed requests (non-200 status codes) and shows the top 10 by time.
az monitor log-analytics query \
  --workspace <workspace-id> \
  --query "AppRequests | where ResultCode != 200 | top 10 by TimeGenerated"
Expected result: Response shows rows of failed requests, result codes, and operation names.
[
  {
    "TimeGenerated": "2021-03-14T22:05:21.0000000Z",
    "RequestId": "12345678-90ab-cdef-1234-567890abcdef",
    "ResultCode": "500",
    "OperationName": "GET /api/checkout",
    "ClientIpAddress": "203.0.113.45"
  },
  {
    "TimeGenerated": "2021-03-14T22:06:03.0000000Z",
    "RequestId": "23456789-01bc-def0-2345-678901bcdef0",
    "ResultCode": "404",
    "OperationName": "GET /api/product/999",
    "ClientIpAddress": "203.0.113.46"
  }
]
Alerts
Instead of constantly watching dashboards, alerts can automatically notify you when something requires attention.
- Alerts trigger when thresholds are exceeded
- Notifications can be sent automatically
- Alerts reduce the need for constant manual monitoring
In this example, we're creating an alert rule in Azure Monitor so we can be notified when the VM is under heavy load.
az monitor metrics alert create \
  --name "HighCpu" \
  --resource-group <rg> \
  --scopes /subscriptions/<sub>/resourceGroups/<rg>/providers/Microsoft.Compute/virtualMachines/<vm> \
  --condition "avg CPUPercentage > 80" \
  --window-size 5m \
  --evaluation-frequency 1m \
  --action /subscriptions/<sub>/resourceGroups/<rg>/providers/Microsoft.Insights/actionGroups/<ag>
Expected result: Alert rule is created and returns an object with rule details and state.
{
  "name": "HighCpu",
  "type": "Microsoft.insights/metricAlerts",
  "id": "/subscriptions/<sub>/resourceGroups/<rg>/providers/microsoft.insights/metricAlerts/HighCpu",
  "location": "global",
  "properties": {
    "enabled": true,
    "scopes": [
      "/subscriptions/<sub>/resourceGroups/<rg>/providers/Microsoft.Compute/virtualMachines/<vm>"
    ],
    "condition": {
      "odata.type": "Microsoft.Azure.Management.Insights.Models.ThresholdRuleCondition",
      "dataSource": {
        "resourceUri": "/subscriptions/<sub>/resourceGroups/<rg>/providers/Microsoft.Compute/virtualMachines/<vm>",
        "metricName": "CPUPercentage"
      },
      "operator": "GreaterThan",
      "threshold": 80,
      "windowSize": "PT5M"
    },
    "evaluationFrequency": "PT1M",
    "actions": [
      {
        "actionGroupId": "/subscriptions/<sub>/resourceGroups/<rg>/providers/Microsoft.Insights/actionGroups/<ag>"
      }
    ],
    "autoMitigate": false
  }
}
Dashboards
Dashboards provide a single view of system health.
- Dashboards combine metrics, logs, and alerts
- Data from multiple resources can be displayed together
- Teams can quickly understand system status
A unified dashboard makes monitoring easier by showing important information in one place.