CloudWatch
This is not an exhaustive documentation of all the existing AWS Services. These are summarized notes that I used for the AWS Certifications.
To see the complete documentation, please go to: AWS documentation
Overview
CloudWatch provides centralized logging and metrics for resources and applications.
- Enables actions triggered by events.
- Stored permanently without using AWS S3, but can be exported.
- CloudWatch agent can be installed and used for your application logging.
- IAM policies can be used to restrict user actions in CloudWatch.
Main components
-
CloudWatch
- Dashboards, alarms, emtrics (both pre-defined and custom), and Notifications.
-
CloudWatch Logs
- Logs from certain AWS services and your own applications.
-
CloudWatch Events
- Trigger actions based on rules created from system event data like API calls, AWS resources state, and Scheduled.
-
CloudWatch Insights
- Insight can be leveraged to search and analyze log data.
Getting started with CloudWatch
- Install CloudWatch agent in EC2.
- Create a Log group in CloudWatch logs.
- Configure the CloudWatch agent to send logs into that log group.
CloudWatch Dashboards
How it works
We can build and customize a CloudWatch dashboard page using different visual widgets displaying metrics and alarms relating to your resources to form a unified view. This can be done through any of the methods below:
- AWS Management console
- AWS CLI
- PutDashboard API
These dashboards can then be viewed from within the AWS Management Console. The resources within your customized dashboard can be from multiple different regions making this a very useful feature. In addition:
- quickly and easily design and configure different dashboards
- Creates view for performance metrics and alarms from resources relating to a project.
- Create a different dashboard for a specific region or application deployment.
Once you have built your Dashboards, you can easily share them with other users, even those who may not have access to your AWS account. This allows you to share the findings gathered by CloudWatch with those who may find the results interesting and beneficial to their day-to-day operational role, but don’t necessarily require the need to access your AWS account.
Dashboards and Widgets
There are two ways that you can create a dashboard.:
- Create visually through the editor
- Create dashboards programmatically (can be used inside CloudFormation templates)
Both methods allow you to pick from many different media types called widgets. There are currently 8 flavors of these widgets and they are as follows:
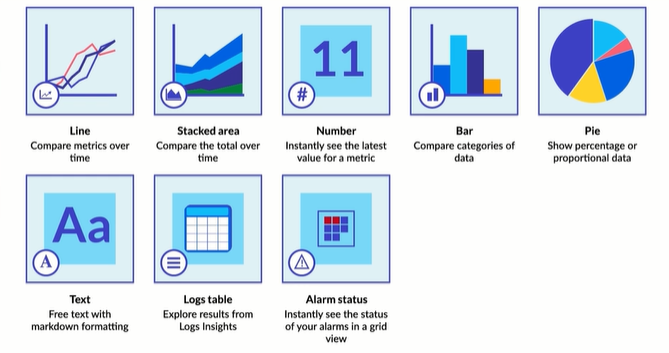
Widgets:
-
Line charts
- A line chart is a type of chart which displays information as a series of data points connected by straight line segments. It is a basic type of chart common in many fields.
-
Stacked area chart
- This type of chart compares the totals of many different subjects within the same graph
-
Number Widget
- Allow you to instantly see the value for a certain metric that you're particularly interested in.
- This could be as simple as displaying the current number of online instances.
-
Bar Charts
- Compares values of multiple types of data within the same graph.
-
Pie charts
- Proportional data in direct relationship to other information fitted within a circle.
-
Text widget
- Free text with markdown formatting allowing you to add useful information to your dashboards as you see fit.
-
Log tables
- Explore results from log insights. Logs Insights enables you to interactively search and analyze your log data in Amazon CloudWatch.
-
Alarm statuses
- In case you have an alarm set up that you'd like to know immediately if something is going wrong right on this dashboard.
Dashboard Features
One extremely cool feature of CloudWatch dashboards is they allow you to perform math on the metrics you want to display. So if you wanted to see how a graphed metric looked when applying normalization techniques or filters to your data you have the power to do so.
Additionally when working with dashboards are also allowed to aggregate data across multiple sources, like an auto scaling group for example, so if you were interested in seeing how the CPU load was handling overtime across your entire fleet you could create a dashboard that would display that.
-
Create visually
- It is fairly painless to create dashboards with the visual dashboard creation tools provided by AWS within the CloudWatch console.
- Creating dashboards in the editor is as simple as drag and dropping and adding new widgets onto a blank canvas.
- The editor allows you to pick any of the previously mentioned different types of media widgets and place them where you please.
- Pieces are rearrangeable and can be placed with as much finite controls as you desire.
- All widgets have a stretchable window view that you can position into specific sizes.
-
Create programmatically
- Dashboards can also be written as code giving you programmatic access to all the same information and tools.
- This means you can also put these code snippets inside cloud formation templates for easy dashboard creation on new accounts or projects.
- Creating these codified dashboards however is not as easy as it may sound at first.
- There is a lot of work that goes into testing and making sure your creation functions well.
- Your dashboard code is written as a string in JSON formatting and can include anywhere between 0 to 100 separate widget objects. You have to specifically note down the x,y location of your widgets as well as the width and height of each element. That can be a little tedious to set up for the first time, but if you already have a functional blueprint, you can modify that fairly easily.
Annotations
When you're building your charts and after you have them completed you have the ability to add annotations to your graphs. This is helpful for displaying when a certain event has taken place in the past which could help give other members of your team insight and exposure to certain peaks and valleys in your information. Just like writing good code requires comments it's especially important to make sure your graphs and charts also have that advantage.
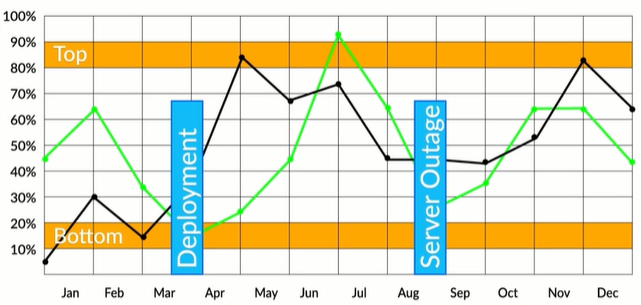
You can have both horizontal and vertical annotations in your graphs - each having their own purpose. For example, horizontal annotations can denote reasonable top and bottom bounds for a service’s CPU load while vertical annotations are great for noting when a specific event happened in the past.
Linking Dashboards
You also have the ability to link to other dashboards within your own systems or even across accounts. These dashboards don't have to be in the same region either. This is a very powerful tool that helps to centralize operations teams, DevOps, and other service owners who all need to have visibility into the status of your applications.
In order to allow cross-account and cross-region access, you need to enable it within the CloudWatch settings for your account as well as each of the accounts you wish to connect to. You can then link your accounts together, to share CloudWatch data between. These settings can also be activated within the AWS SDK and CLI.
Few options on sharing:
-
Share a single dashboard and designate specific email addresses and passwords of the people who can view the dashboard.
-
Share a single dashboard publicly, so that anyone who has the link can view the dashboard.
-
Share all the CloudWatch dashboards in your account and specify a third-party single sign-on (SSO) provider for dashboard access. All users who are members of this SSO provider's list can access the dashboards in the account. To enable this, you integrate the SSO provider with Amazon Cognito.
Limits
CloudWatch Dashboards allow you to have up to three dashboards - each containing up to 50 metrics at no charge. This is more than enough for anyone just practicing or having a few applications they want to monitor. For any more than that however, you will be charged $3 per month per new dashboard you wish to create.
For an enterprise company, that is not too much to spend. However If you are a solo developer or a small shop just starting off - those little 3 dollar charges can add up.. So make sure you use your resources appropriately when building dashboards for your services.
Best Practices
-
Use larger graphs for the most important display metrics - It's important to keep in mind that humans are visual creatures. If you want them to pay attention to something, make it big and obvious.
-
Layout your dashboards and graph for the average minimum display resolution of your users - this can help make sure that all relevant data is on screen at one time. This prevents users from missing key information that might be off-screen, which in the case of time-sensitive issues or events could be catastrophic. Most screens these days are able to handle 1920 by 1080 fairly well, however if you know your support staff all look at things on their phones, maybe you can design your dashboards around that instead.
-
Display time zones within your graphs for time-based data and if multiple operators are expected to be using the same dashboard simultaneously keep the time zone in UTC - This allows people to know at a glance, when an event took place. Its also important during an emergency that all users are working on the same premise in regards to the time the event happened, having to calculate differences in time zones can be frustrating when your customers' satisfaction and your business is on the line.
-
Default your time interval and datapoint period to whatever is the most common use case.
-
Avoid plotting too many datapoints within your graphs - Having too much data can slow the dashboard loading time and might reduce the visibility of anomalies.
-
Annotate your graphs with the relevant alarm thresholds for your services - this allows your users to understand at a glance if one of your services is about to go over its SLA times or when something terrible is about to happen. Having alarms is great, but never triggering them because you knew something was wrong ahead of time is way better.
-
Don’t assume your users will know what each metric means - be aggressive with tagging and having descriptions right in the dashboard using text widgets.
CloudWatch Metrics
Metrics are a key component and fundamental to the success of Amazon CloudWatch, they enable you to monitor a specific element of an application or resource over a period of time while tracking these data points. Example of metrics include:
- Number of DiskReads or DiskWrites on an EC2 instance
- NumberOfObjects, which tracks the number of objects in a specified S3 bucket.
By default when working with Amazon CloudWatch, everyone has access to a free set of Metrics, and for EC2, these are collated over a time period of 5 minutes. However, for a small fee, you can enable detailed monitoring which will allow you to gain a deeper insight by collating data across the metrics every minute.
In addition to detailed monitoring, you can also create your own custom metrics for your applications, using any time-series data points that you need, but be aware that when you create a metric they are regional, meaning that any metrics created in 1 region will not be available in another.
Anomaly Detection
CloudWatch metrics also allow you to enable a feature known as anomaly detection. This allows CloudWatch to implement machine learning algorithms against your metric data to help detect any activity that sits outside of the normal baseline parameters that are generally expected. Advance warning of this can help you detect an issue long before it becomes a production problem.