Logs and Insights
This is not an exhaustive documentation of all the existing AWS Services. These are summarized notes that I used for the AWS Certifications.
To see the complete documentation, please go to: AWS documentation
CloudWatch Logs
CloudWatch Logs gives you a centralized location to house all of your logs from different AWS services that provide logs as an output, such as CloudTrail, EC2, VPC Flow logs, etc, in addition to your own applications.
When log data is fed into Cloudwatch Logs, you can utilize CloudWatch Log Insights to monitor the logstream in real time and configure filters to search for specific entries and actions that you need to be alerted on or respond to. This allows CloudWatch Logs to act as a central repository for real-time monitoring of log data.
Unified CloudWatch Agent
This be installed to collect logs and additional metric data from EC2 instances as well from on-premise services running either a Linux or Windows operating system. This metric data is in addition to the default EC2 metrics that CloudWatch automatically configures for you.
CloudWatch Insights
CloudWatch Insights provide the ability to get more information from the data that CloudWatch is collecting. There are currently three different types of insights within CloudWatch:
- Log Insights
- Container Insights
- Lambda Insights.
Log Insights
This is a feature that can analyze your logs that are captured by CloudWatch Logs at scale in seconds using interactive queries delivering visualizations that can be represented as:
- Bar
- Line
- Pie
- Stacked area charts
The versatility of this feature allows you to work with any log file formats that AWS services or your applications might be using.
Using a flexible approach, you can use Log insights to filter your log data to retrieve specific data allowing you to gather insights that you are interested in. Also using the visual capabilities of the feature, it can display them in a visual way.
Container Insights
Much like Log insights, Container Insights allow you to collate and group different metric data from different container services and applications within AWS, for example, the Amazon Elastic Kubernetes Service, (EKS) and the Elastic Container Service (ECS).
- Capture and monitor diagnostic data giving y
- These insight data can be analyzed at the cluster, node, pod, and task level
Lambda Insights
This feature provides you the opportunity to gain a deeper understanding of your applications using AWS Lambda. It gathers and aggregates system and diagnostic metrics related to AWS Lambda to help you monitor and troubleshoot your serverless applications.
To enable Lambda Insights, you need to enable the feature per Lambda function that you create within Monitoring Tools section of your function:
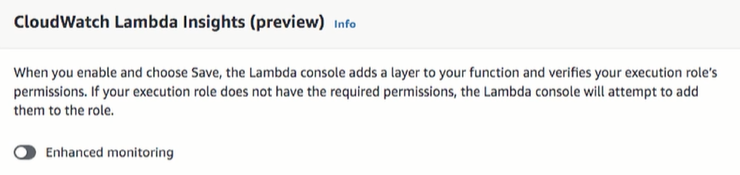
This ensures that a CloudWatch extension is enabled for your function allowing it to collate system-level metrics which are recorded every time the function is invoked.