Explainability and Interpretability
Overview
AI systems can give predictions, but people need to understand how and why.
- Explainability focuses on outputs and their reasons
- Interpretability focuses on the inner process
Both concepts are about clarity. Explainability looks at the "what and why," while interpretability looks at the "how."
White-box vs Black-box AI Systems
AI models differ in how transparent they are. White-box models are easier to trust, but black-box models are often more powerful.
-
White-box models
- White-box models are simple and easy to interpret
- They clearly show how inputs lead to outputs
- Examples include linear regression and decision trees
-
Black-box models
- Black-box models are more complex and harder to explain
- Their many layers make reasoning difficult
- Deep learning models are the main example
Basic Explainable AI (XAI)
The goal of Explainable AI (XAI) is to make black-box models easier to understand. XAI provides methods and tools that reveal how complex models work and why they make certain prediction
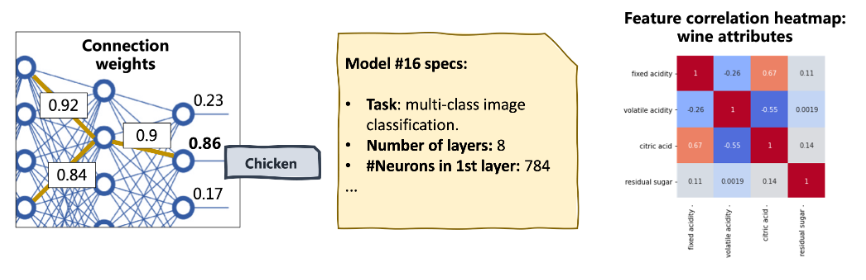
- Model introspection lets us look inside parameters
- Model documentation explains design choices
- Model visualization shows insights in simple visuals
A heatmap is a good example of visualization that highlights how inputs affect outputs.
XAI tools: Feature Importance
Feature importance measures how much each input contributes to predictions.
- Helps explain model decisions
- Detects biases or irrelevant features
- Shows how model performance changes if features are removed
Below is an example showing how to use a RandomForest model to identify which features of iris flowers (like petal and sepal size) are most important for predicting their species.
from sklearn.ensemble import RandomForestClassifier
from sklearn.datasets import load_iris
import pandas as pd

data = load_iris()
X, y = data.data, data.target
model = RandomForestClassifier().fit(X, y)

importance = pd.Series(model.feature_importances_, index=data.feature_names)
print(importance.sort_values(ascending=False))
Expected result:
petal length (cm)    0.44
petal width (cm)     0.42
sepal length (cm)    0.09
sepal width (cm)     0.05
XAI tools: SHAP
Feature importance helps us understand how different inputs affect a model's predictions. SHAP (SHapley Additive exPlanations) is a tool that makes this clear for complex models.
- Measures how much each feature impacts the model's output
- Can analyze positive and negative contributions
- Works for overall model behavior or a single prediction
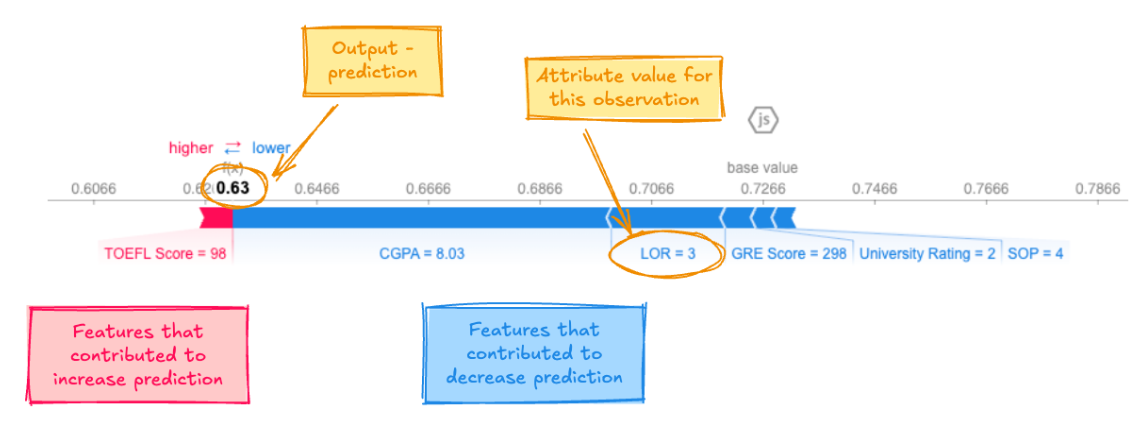
Example: Predicting university admission based on scores. SHAP can show which test or GPA scores most influenced the decision.
- Visual plot showing which scores most influence admission
- Positive values push the prediction toward admission
- Negative values push it away
- SHAP can also explain a single student's admission prediction
- Shows which features contributed most for that prediction