Aggregation Examples
Pre-requisites
The Sample Data
We will analyze the basic financial data of companies in the S&P 500 index.
| Field | Description |
|---|---|
| Name | Name of the company |
| Sector | Sector to which the company belongs |
| Market Cap | Total dollar market value of the company's shares |
| Earnings/Share | Company’s profit divided by the number of shares |
| Price/Earnings | Ratio of the company's share price to its earnings per share |
| Dividend Yield | Money paid to shareholders annually, divided by the current stock price |
| EBITDA | Earnings before interest, taxes, depreciation, and amortization (financial performance measure) |
Importing the Dataset
We need an index with sample data for analysis. You can download the Postman collections containing all the queries which will be used in this guide.
-
Download the files here:
-
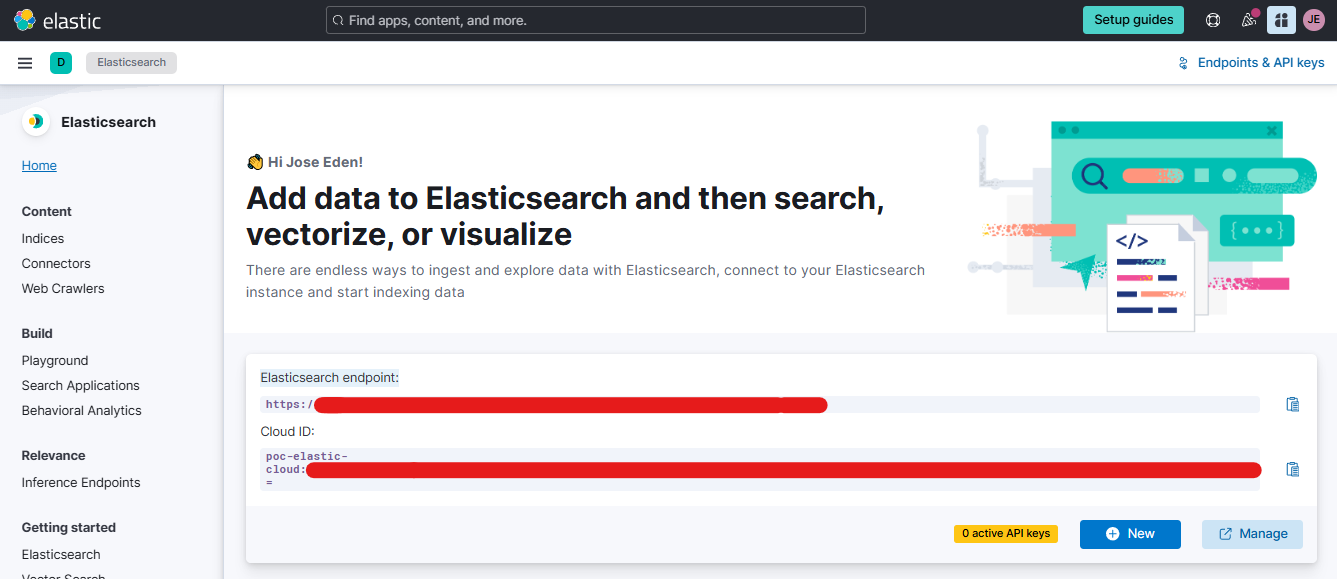
Login to your Elastic Cloud account and go to Overview.
-
Copy the Elasticsearch endppoint link for your cluster.
-
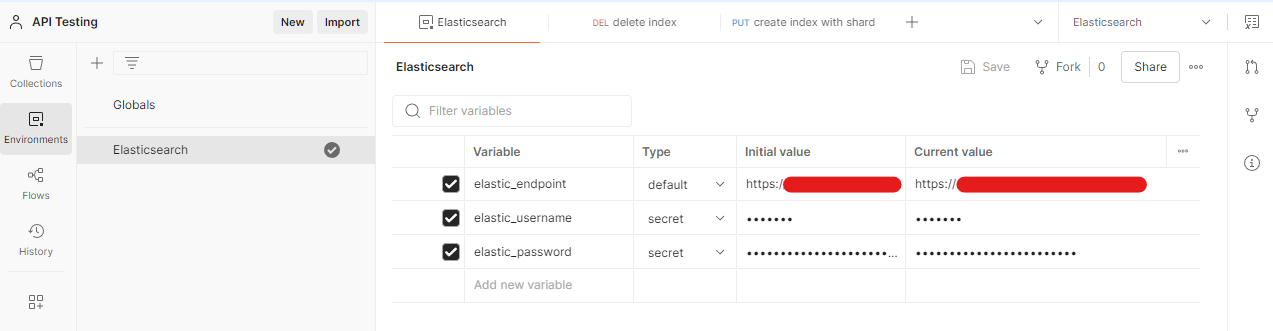
Open Postman and click Environments and click the "+' button to create a new environment.
-
Enter "Elasticsearch" as the environment name.
-
Add the following environment variables below.
-
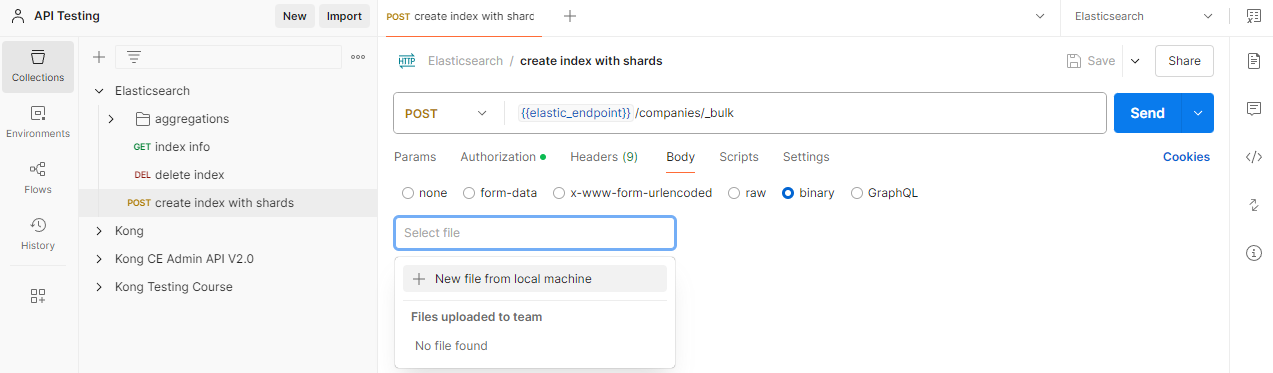
Go to Collections > Import > Select the postman collection file.
-
On the upper right corner, click the dropdown bar and choose "Elasticsearch" as your environment.
-
Click "create index" > Body > > binary > New file from machine > Select the dataset for S&P500 companies.
-
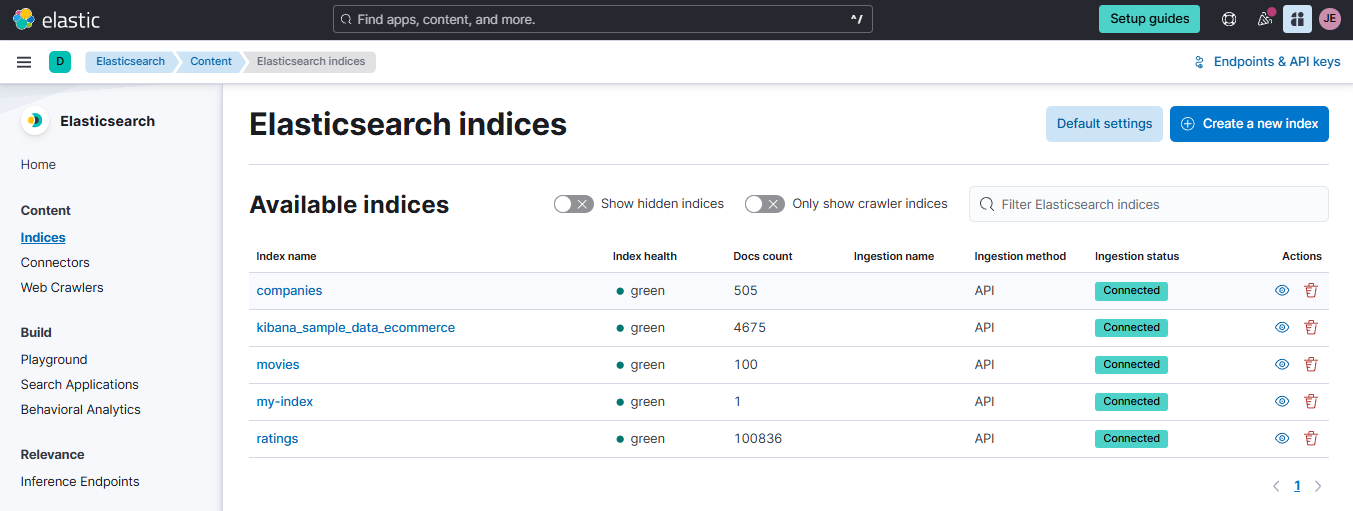
Back in your Elastic Cloud account, go to Content > Indices. You should see the 'companies' index created.
-
If you encounter an issue importing the data through Postman, you can use run the command below in a terminal. Make sure to run this in the same directory as the dataset.
curl --location -s -u 'add-username-here:add-password-here' \--request POST 'https://your-elastic-endpoint-here/companies/_bulk' \--header 'Content-Type: application/x-ndjson' \--data-binary @sp500-companies.json
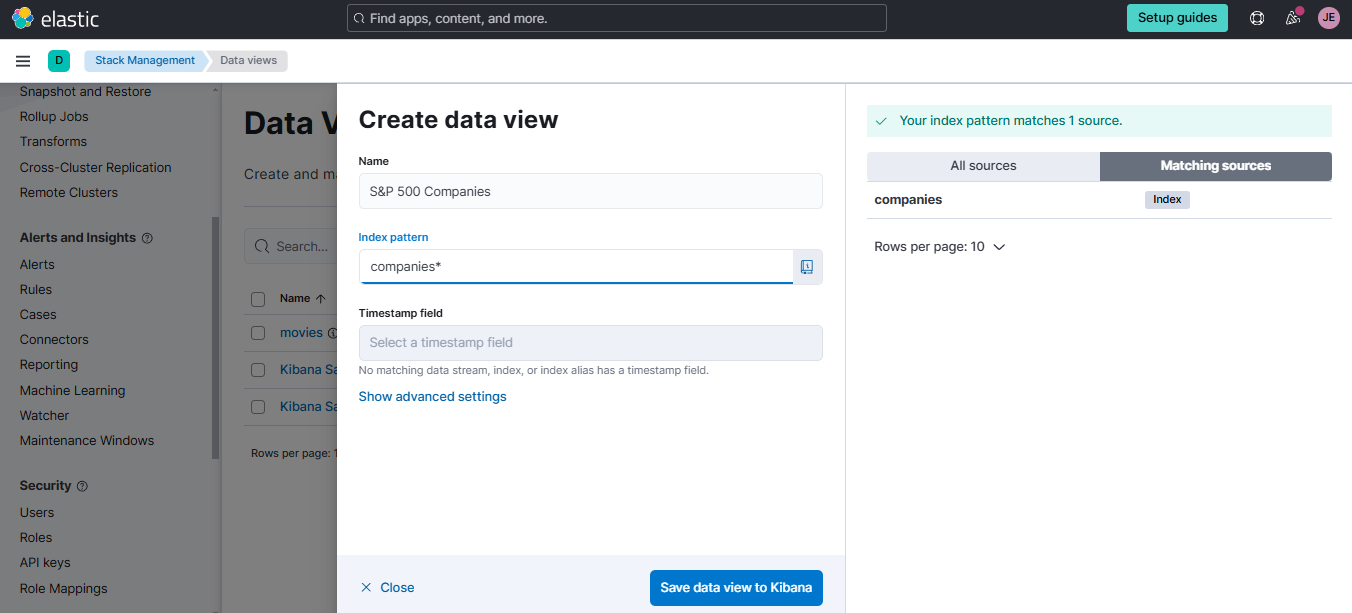
Create the Data View in Kibana
On your Elastic Cloud account, go to Stack Management > Kibana > Data Views > Create data view. Use "S&P 500 Companies" as the data view name and set the index pattern to the index name "companies". Click Save data view to Kibana.
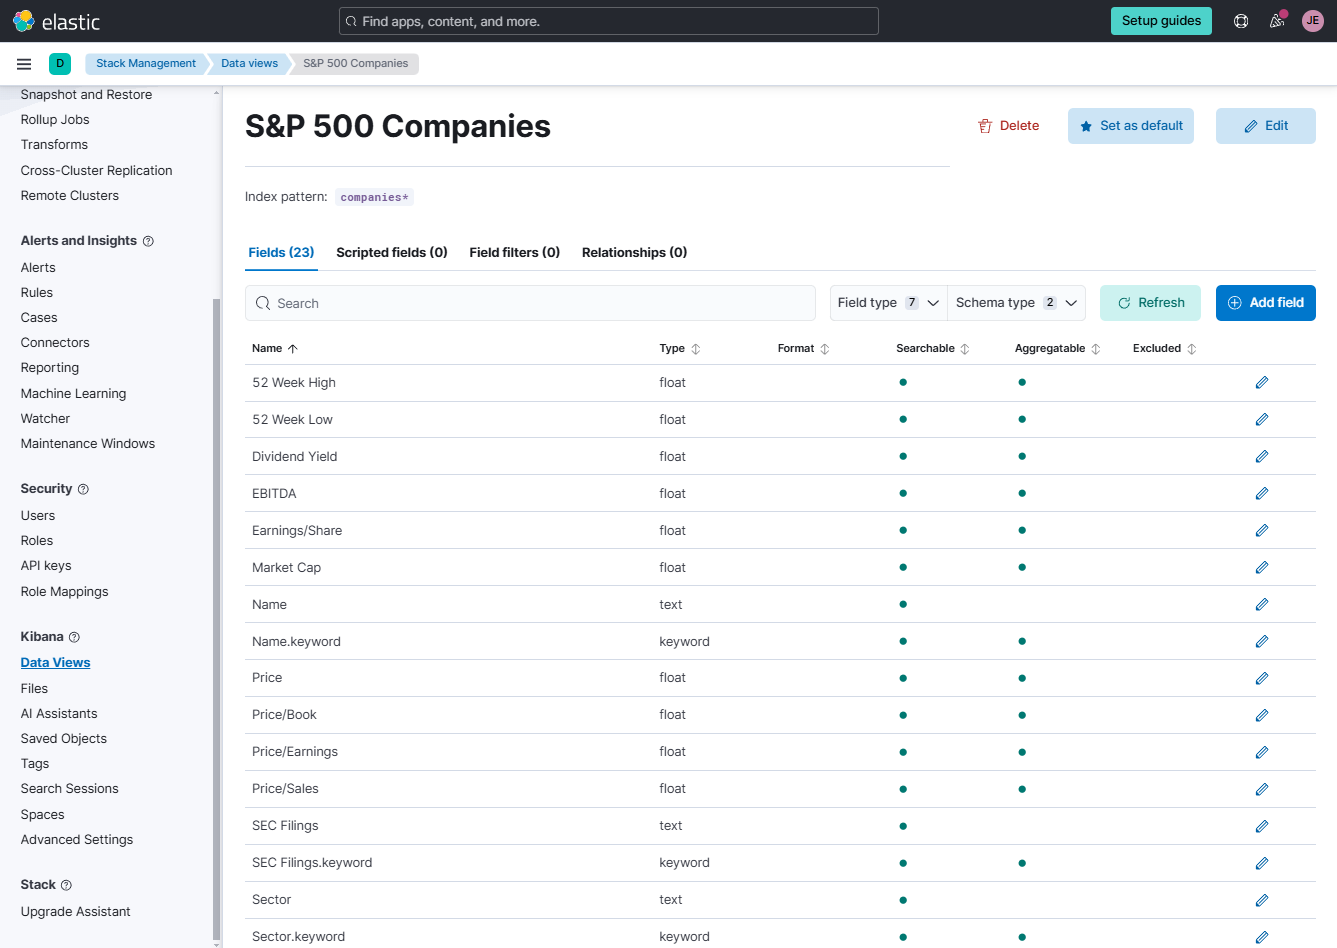
You could see the fields for the companies index here.
Single Metric Aggregation
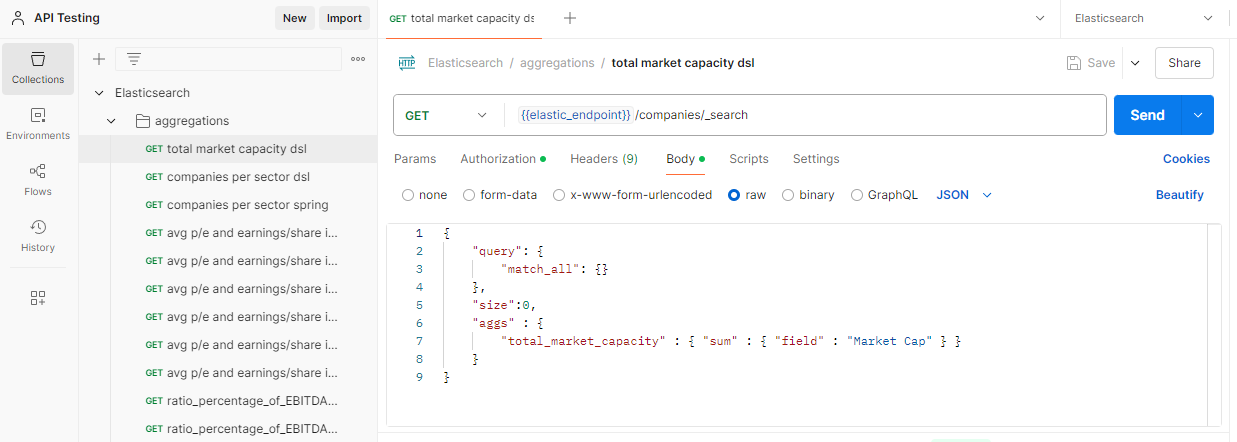
To calculate the total market capacity of the 500 largest US companies, you can use the Elasticsearch query below:
{
    "query": {
        "match_all": {}
    },
    "size": 0,
    "aggs": {
        "total_market_capacity": { "sum": { "field": "Market Cap" } }
    }
}
In Postman, navigate to the aggregations folder and select total market capacity dsl. Click Send to execute the query.
The output should look like this:
{
    "took": 0,
    "timed_out": false,
    "_shards": {
        "total": 1,
        "successful": 1,
        "skipped": 0,
        "failed": 0
    },
    "hits": {
        "total": {
            "value": 505,
            "relation": "eq"
        },
        "max_score": null,
        "hits": []
    },
    "aggregations": {
        "total_market_capacity": {
            "value": 2.4865915532544E13
        }
    }
}
The output reveals the total market capacity of the 500 largest companies: 24.87 trillion.
To visualize this aggregation in Kibana:
- Log in to Elastic Cloud and go to Analytics > Dashboard > Create a dashboard.
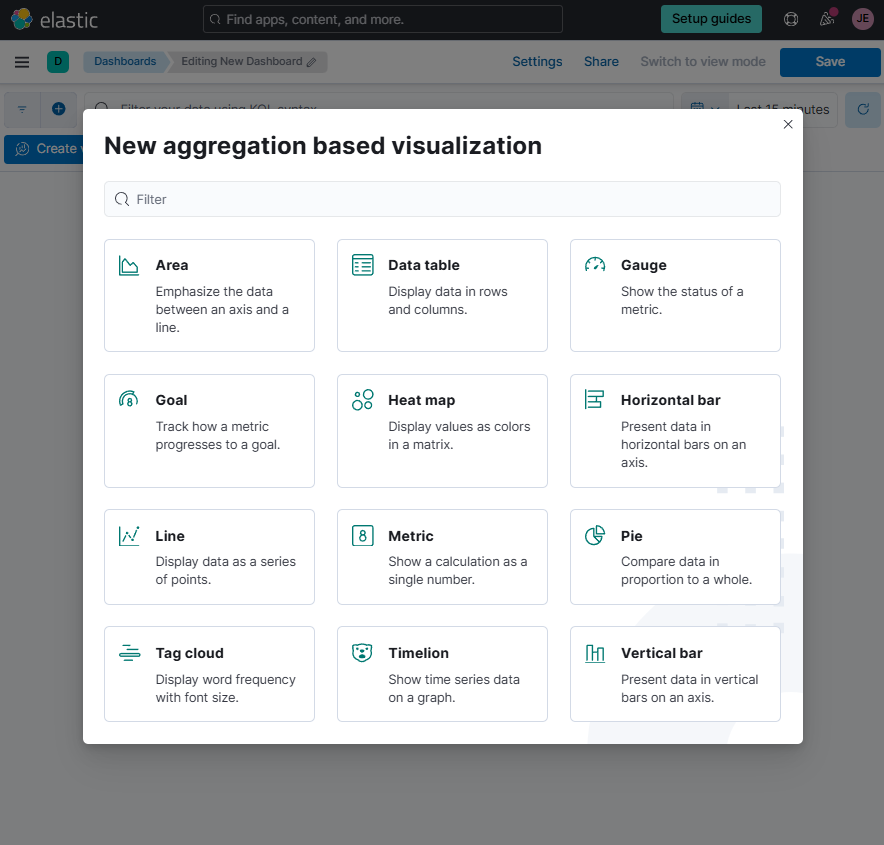
- Click Add panel and select Aggregation-based.
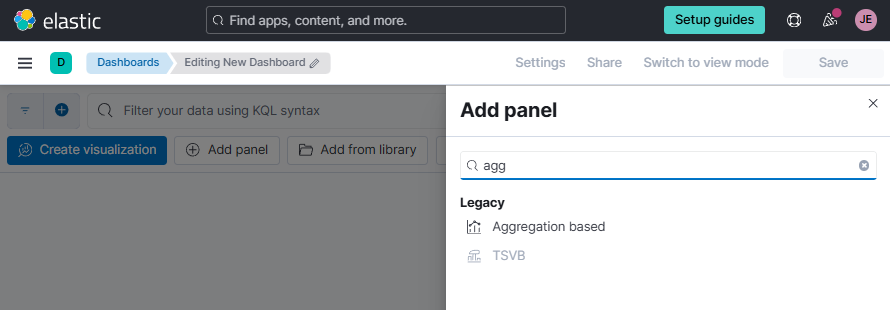
-
Select Vertical Bar and choose the "S&P 500 Companies" data view.
-
Set Metrics and Bucket values as shown below.
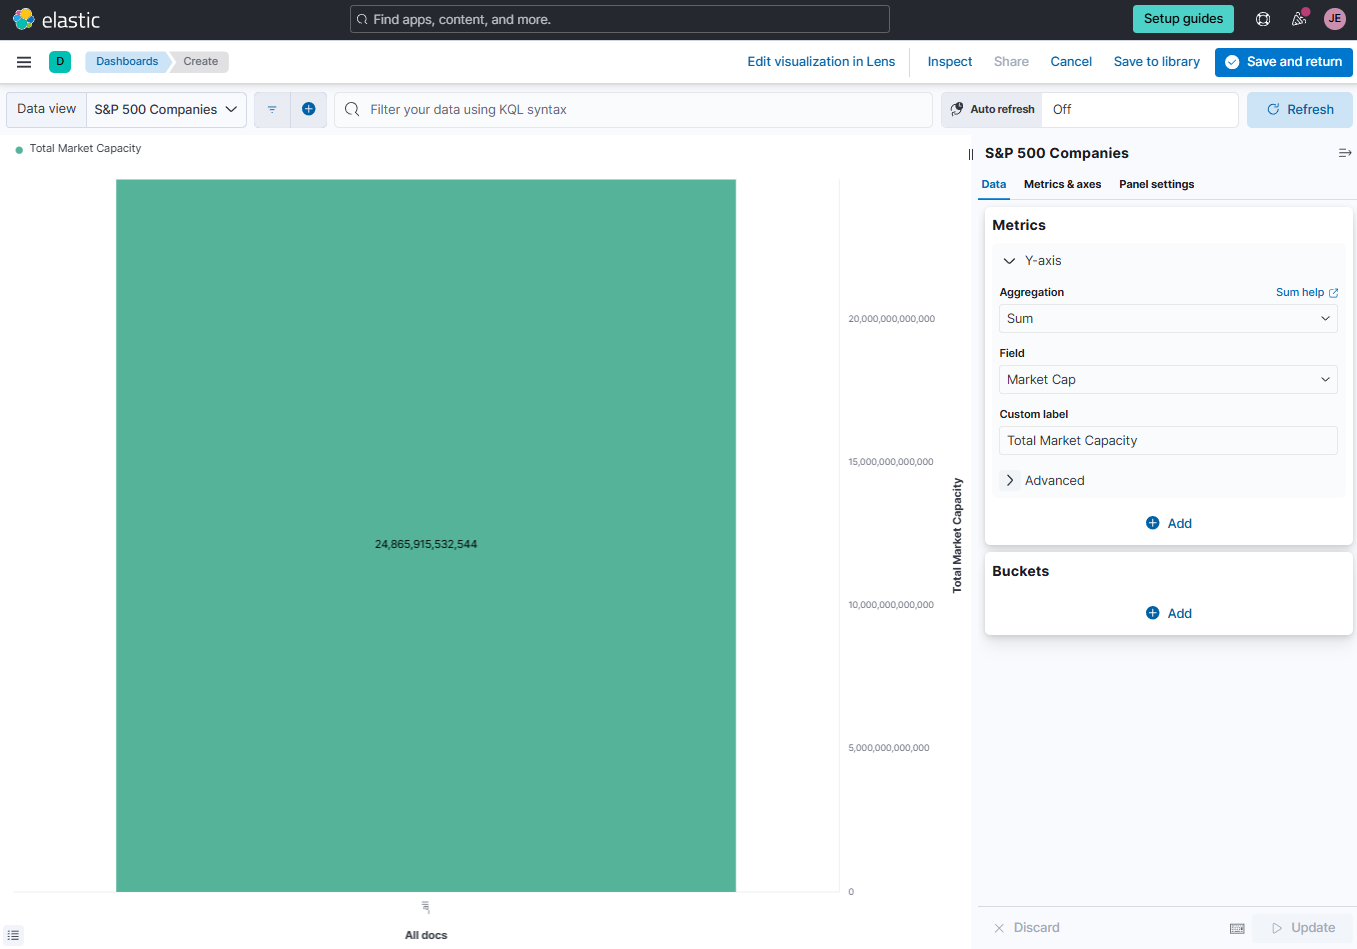
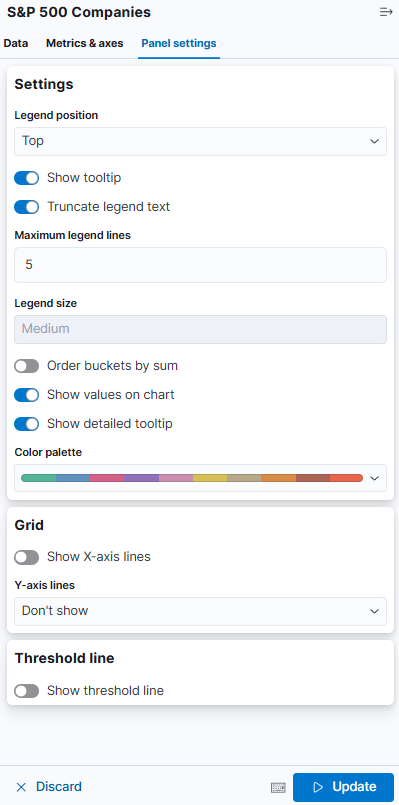
-
You may also change the other configuration in the Metrics and Panel settings. Click Update.
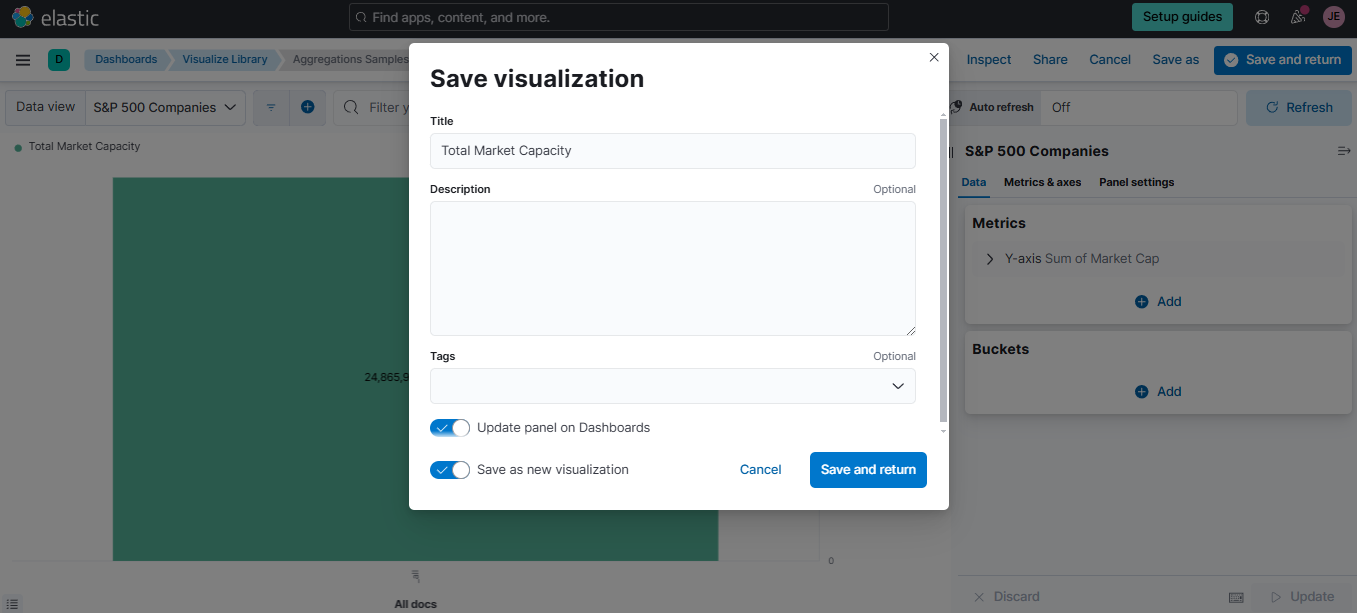
-
To save the panel, click Save to library and enter "Total Market Capacity" as the visualization name. This will save the visualization panel in the dashboar.
-
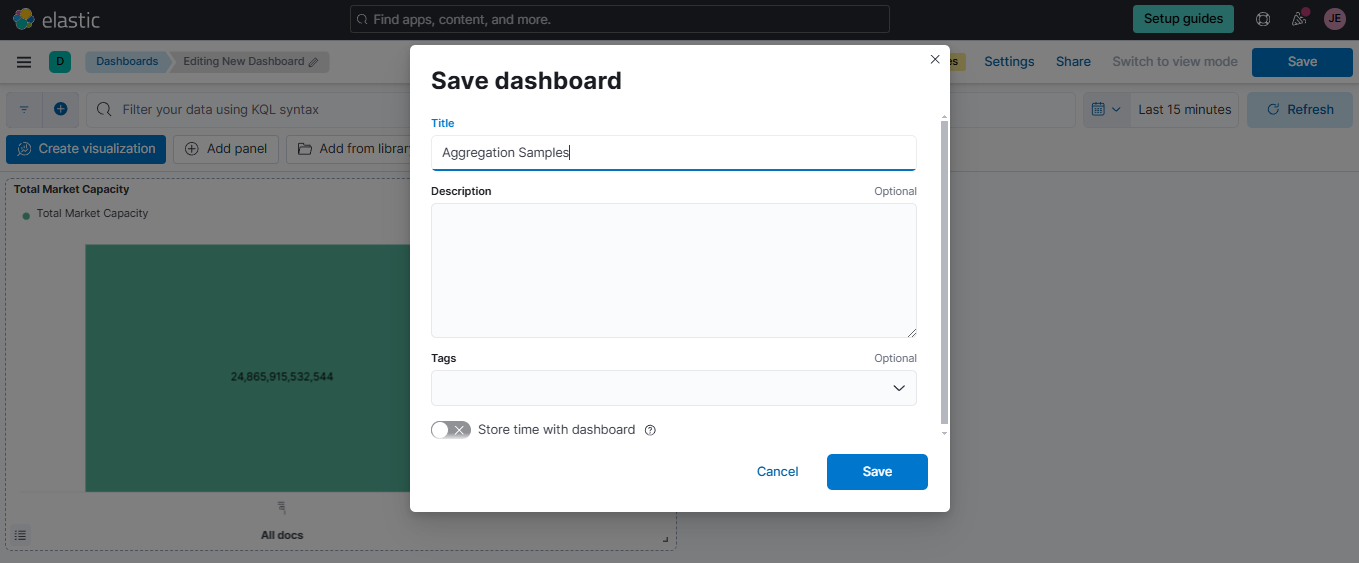
To save the dashboard, click Save and enter "Aggregation Samples" as dashboard name. We'll be using this dashboard to create the visualization panels for the next examples.
Bucket Aggregation with Count
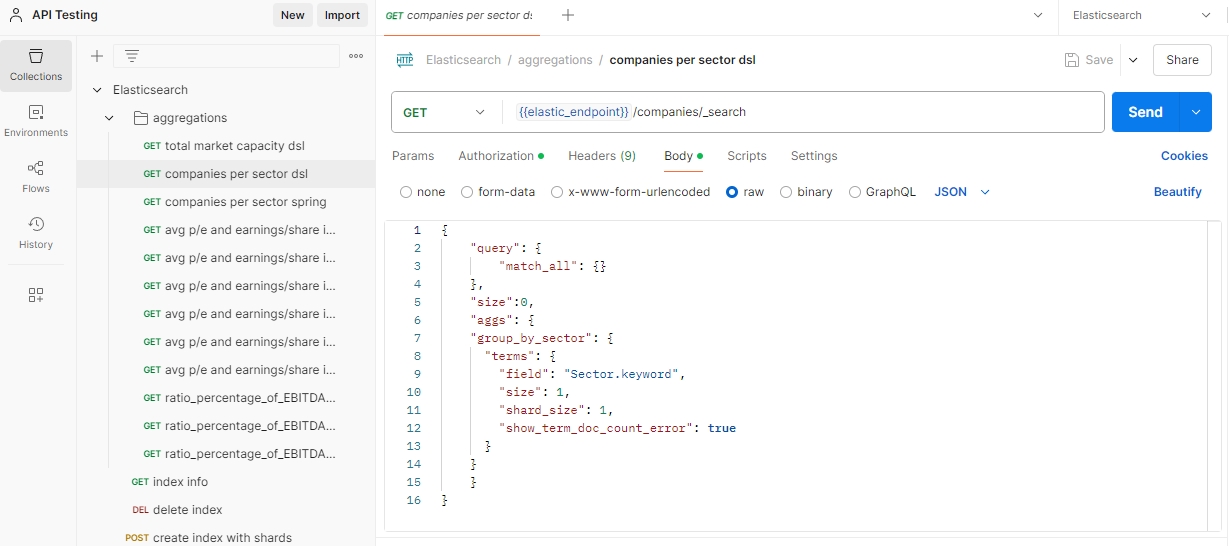
To determine how many companies are in each sector, we use the following query:
{
    "query": {
        "match_all": {}
    },
    "size": 0,
    "aggs": {
        "group_by_sector": {
            "terms": {
                "field": "Sector.keyword",
                "size": 15,
                "shard_size": 15,
                "show_term_doc_count_error": true
            }
        }
    }
}
This query is concise because it implicitly uses the count metric, which is the default in bucket aggregations.
Key considerations:
-
Size parameter
- Controls the number of buckets returned per shard.
- A higher size increases accuracy but impacts performance.
-
Shard_size parameter
- Specifies how many buckets are collected from each shard.
- Improves precision without increasing number of final buckets returned.
-
Show_term_doc_count_error
- Adds information about potential inaccuracies in the bucket counts.
By default, this query returns only the top 10 sectors with the most companies. Increasing the size can fetch more sectors, but it requires greater computational resources. The show_term_doc_count_error attribute helps measure potential error chances in the results. For detailed explanations, refer to the Elasticsearch documentation.
To execute this in Postman:
-
Open the "companies per sector dsl" request.
-
Click Send to get the results.
-
The output will look like this:
{"took": 1,"timed_out": false,"_shards": {"total": 1,"successful": 1,"skipped": 0,"failed": 0},"hits": {"total": {"value": 505,"relation": "eq"},"max_score": null,"hits": []},"aggregations": {"group_by_sector": {"doc_count_error_upper_bound": 0,"sum_other_doc_count": 421,"buckets": [{"key": "Consumer Discretionary","doc_count": 84,"doc_count_error_upper_bound": 0}]}}}
Explanation:
The group_by_sector section shows aggregation results grouped by sector. It includes a buckets field that lists each sector and the corresponding number of companies.
Each bucket contains a key, representing the sector name, and a doc_count, indicating the total number of companies in that sector.
In the output above, only the top sector, "Consumer Discretionary," with 84 companies, is displayed because the query's size parameter is set to limit the number of returned buckets.
The sum_other_doc_count field represents the count of companies in sectors not shown in the displayed buckets. The doc_count_error_upper_bound indicates count accuracy, with a value of 0 meaning no error.
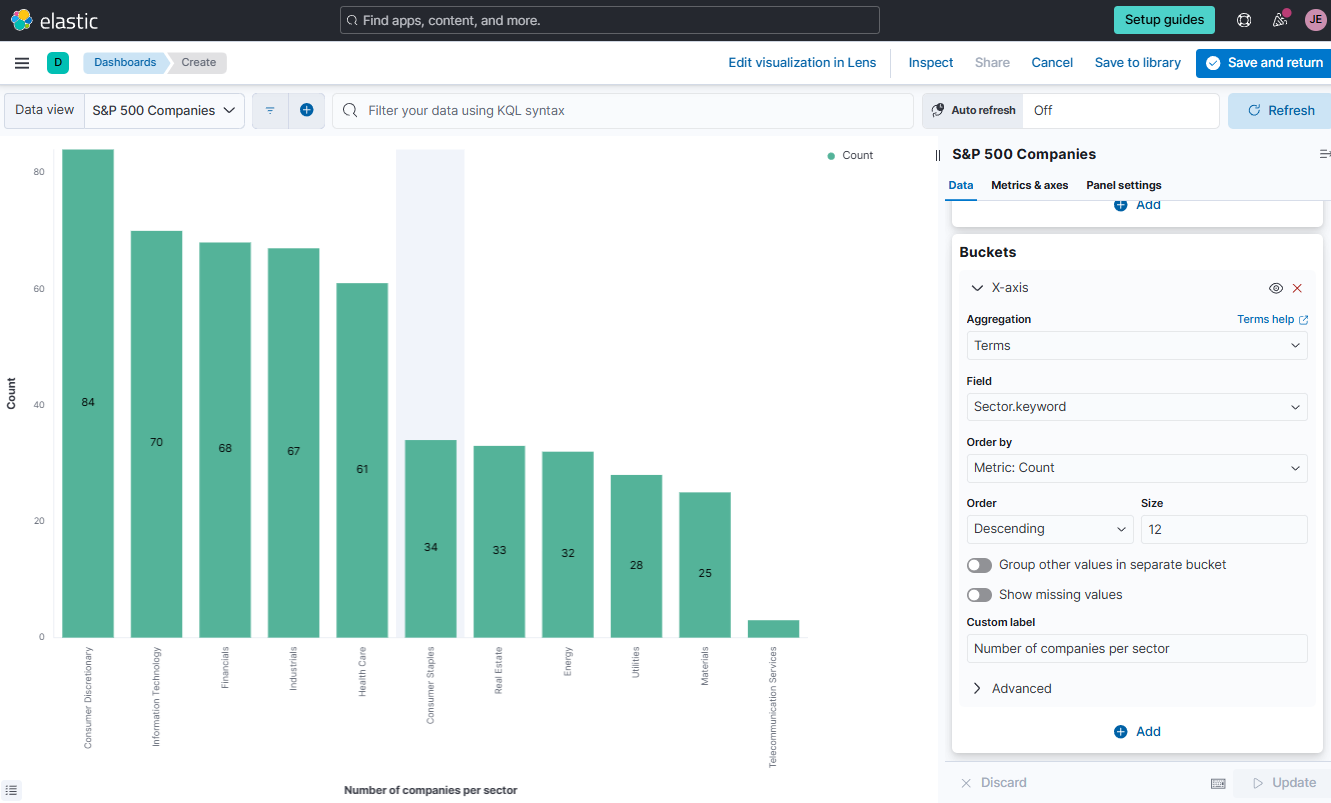
Visualization:
To visualize this aggregation, we have to select from the bucket tab term aggregation and next select Sector.keyword field.
-
Go back to Elastic Cloud console and go to Analytics > Dashboard > Select the Aggregation Samples dashboard.
-
Click Add panel and select Aggregation-based.
-
Select Vertical Bar and choose the "S&P 500 Companies" data view.
-
Set Metrics and Bucket values as shown below.
-
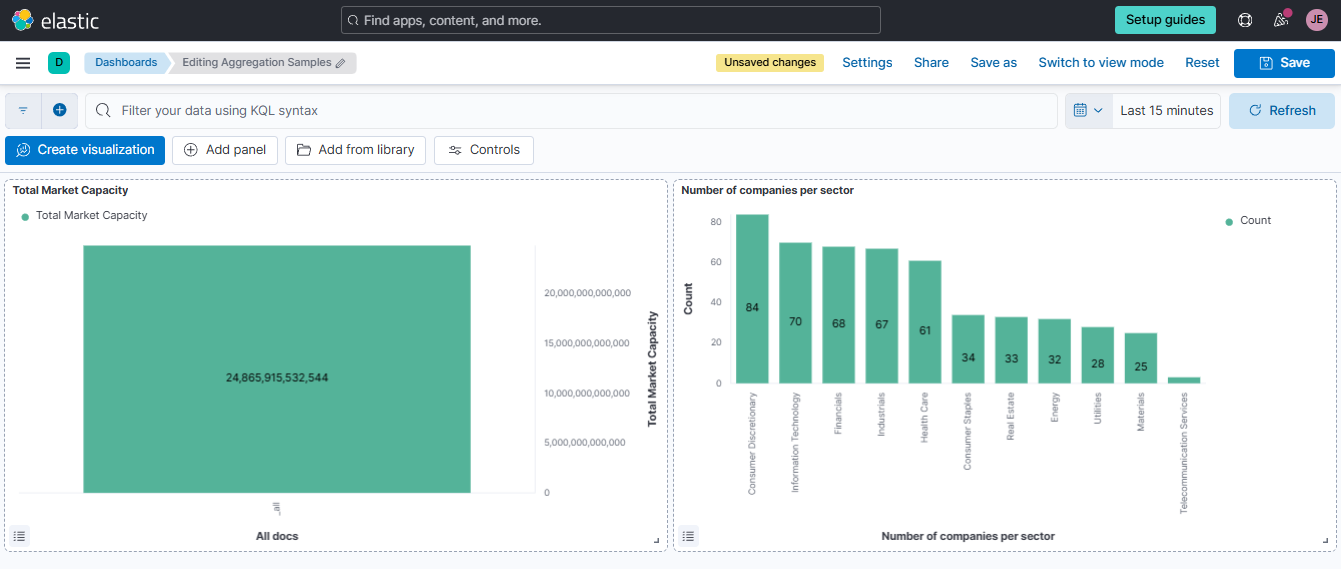
Click Save to library and enter "Number of companies per sector" as the visualization name. Click Save and Return. This panel will now be added to the Aggregation Samples dashboard. To save the dashboard, click Save at the upper right corner.
Bucket and Metric Aggregations
In the previous example, only basic counts were used. To analyze other metrics, such as average values, explicit metric aggregations are required.
To identify which sectors are most valued relative to their earnings, this example calculates the average P/E ratio and Earnings Per Share (EPS) for each sector. It combines one bucket aggregation (grouping by sectors) with two metric aggregations (average P/E ratio and average EPS) applied to each group.
{
    "query": {
        "match_all": {}
    },
    "size": 0,
    "aggs": {
        "group_by_sector": {
            "terms": {
                "field": "Sector.keyword",
                "size": 15
            },
            "aggs": {
                "avg_pe": {
                    "avg": {
                        "field": "Price/Earnings"
                    }
                },
                "avg_earnings_per_share": {
                    "avg": {
                        "field": "Earnings/Share"
                    }
                }
            }
        }
    }
}
In Postman, select "avg p/e and earnings/share in each sector with order" and hit Send. It will return the following output:
{
    "took": 1,
    "timed_out": false,
    "_shards": {
        "total": 1,
        "successful": 1,
        "skipped": 0,
        "failed": 0
    },
    "hits": {
        "total": {
            "value": 505,
            "relation": "eq"
        },
        "max_score": null,
        "hits": []
    },
    "aggregations": {
        "group_by_sector": {
            "doc_count_error_upper_bound": 0,
            "sum_other_doc_count": 0,
            "buckets": [
                {
                    "key": "Consumer Discretionary",
                    "doc_count": 84,
                    "avg_pe": {
                        "value": 25.53602409362793
                    },
                    "avg_earnings_per_share": {
                        "value": 4.879047624412037
                    }
                },
                {
                    "key": "Information Technology",
                    "doc_count": 70,
                    "avg_pe": {
                        "value": 37.179857635498045
                    },
                    "avg_earnings_per_share": {
                        "value": 3.1100000174716116
                    }
                },
                {
                    "key": "Financials",
                    "doc_count": 68,
                    "avg_pe": {
                        "value": 17.198970549246845
                    },
                    "avg_earnings_per_share": {
                        "value": 4.436911682433942
                    }
                },
                {
                    "key": "Industrials",
                    "doc_count": 67,
                    "avg_pe": {
                        "value": 21.494328413436662
                    },
                    "avg_earnings_per_share": {
                        "value": 5.344029854260274
                    }
                },
                {
                    "key": "Health Care",
                    "doc_count": 61,
                    "avg_pe": {
                        "value": 23.437833388646443
                    },
                    "avg_earnings_per_share": {
                        "value": 4.340491751544788
                    }
                },
                {
                    "key": "Consumer Staples",
                    "doc_count": 34,
                    "avg_pe": {
                        "value": 21.96323529411765
                    },
                    "avg_earnings_per_share": {
                        "value": 3.6594117704559777
                    }
                },
                {
                    "key": "Real Estate",
                    "doc_count": 33,
                    "avg_pe": {
                        "value": 22.459090868632
                    },
                    "avg_earnings_per_share": {
                        "value": 2.3912121283285543
                    }
                },
                {
                    "key": "Energy",
                    "doc_count": 32,
                    "avg_pe": {
                        "value": 38.55906283855438
                    },
                    "avg_earnings_per_share": {
                        "value": -1.6484375239233486
                    }
                },
                {
                    "key": "Utilities",
                    "doc_count": 28,
                    "avg_pe": {
                        "value": 16.84642846243722
                    },
                    "avg_earnings_per_share": {
                        "value": 2.0146428644657135
                    }
                },
                {
                    "key": "Materials",
                    "doc_count": 25,
                    "avg_pe": {
                        "value": 20.54240001678467
                    },
                    "avg_earnings_per_share": {
                        "value": 4.932000017166137
                    }
                },
                {
                    "key": "Telecommunication Services",
                    "doc_count": 3,
                    "avg_pe": {
                        "value": 11.190000216166178
                    },
                    "avg_earnings_per_share": {
                        "value": 4.426666776339213
                    }
                }
            ]
        }
    }
}
The output shows aggregated data grouped by sectors and provides the number of companies in each sector and financial metrics like the average Price-to-Earnings (P/E) ratio and average Earnings Per Share (EPS). For example:
- Consumer Discretionary sector has 84 companies, with average P/E of 25.54 and EPS of 4.88
- Energy sector has 32 companies, the highest P/E of 38.56 but a negative EPS of -1.65.
Adding Sorting
If we want to sort by our averages, we must specify sorting. In Postman, select the "avg p/e and earnings/share in each sector with sort" query and click Send.
{
    "query": {
        "match_all": {}
    },
    "size":0,
    "aggs": {
        "group_by_sector": {
            "terms": {
                "field": "Sector.keyword",
                "size": 15
            },
            "aggs" : {
                "avg_pe" : {
                    "avg" : {
                        "field" : "Price/Earnings"
                    }
                },
                "avg_earnings_per_share" : {
                    "avg" : {
                        "field" : "Earnings/Share"
                    }
                },
                "bucket_sort_by_pe": {
                    "bucket_sort": {
                        "sort": [{
                            "avg_pe": {
                                "order": "desc"
                            }
                        }],
                        "size": 15
                    }
                }
            }
        }
    }
}
Visualization