Measuring the Madness
Updated Jun 07, 2020 ·
Staying On Track
At the start of each sprint, the team forecasts the amount of work they can realistically complete. The objective is to ensure all forecasted work is finished by the end of the sprint.
To monitor progress throughout the sprint, it's essential to have effective tools and metrics in place.
Watch Out For Patterns
Be vigilant for these common patterns and address them promptly:
- Work is finished early in the sprint due to undercommitment.
- Forecasted work isn't completed because of overcommitment.
- The burndown chart shows steep drops due to tasks not being sufficiently broken down.
- Scope changes or additions during the sprint leading to scope creep.
Key Questions
- Are your metrics easily accessible to the project sponsor and other stakeholders who need regular updates?
- Is the team comfortable with the amount of work they commit to each sprint?
Meet The Burndown Chart
This chart is a simple yet effective tool for tracking sprint progress.
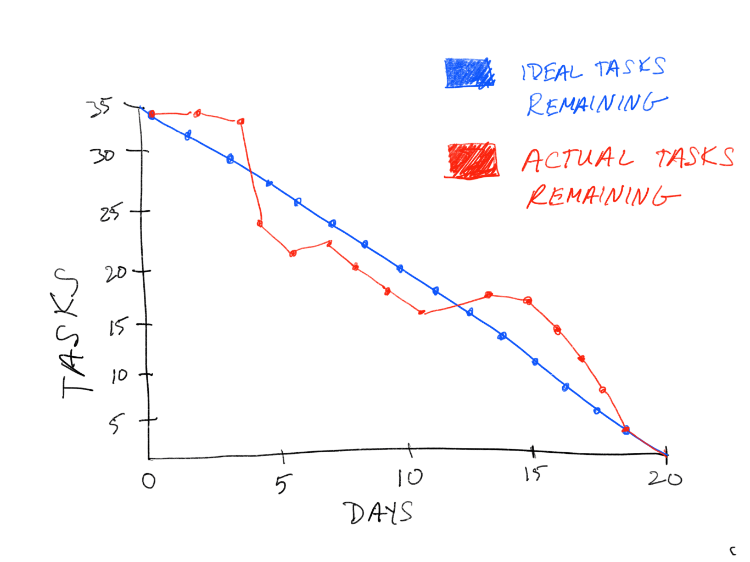
A sprint burndown chart visually represents work completion over time, with the x-axis indicating time and the y-axis showing remaining work in story points.