Prometheus Plugin
Overview
Prometheus is an open-source monitoring and alerting tool designed to collect and store time-series data.
- Developed by SoundCloud and part of the CNCF.
- Tracks system metrics like CPU, memory, and custom application metrics.
- Supports powerful querying with PromQL for real-time insights.
The Prometheus plugin integrates Prometheus with Kong Gateway to monitor API traffic and performance.
- Exposes Kong metrics like request counts, latencies, and error rates.
- Metrics are made available at
/metricsfor Prometheus scraping. - Helps analyze and optimize API performance with Kong-specific insights.
Lab Environment
This lab tests a Kong API Gateway deployment using a FastAPI endpoint. To simplify, both the containerized Kong API Gateway and the FastAPI endpoint are installed locally on a Windows 10 machine. A Docker Compose file is used to deploy Kong, along with other applications like Prometheus, Zipkin, the ELK Stack, and more.
Make sure that you have installed Docker Desktop.
Simply installing Docker in WSL2 without Docker Desktop may introduce some issue when configuring the communication between the containerized Kong API Gateway and the FastAPI application that is installed on the local host.
Pre-requisites
- Postman
- Setup the Kong API Gateway
- Setup Prometheus
- Setup Grafana
- Setup the FastAPI Endpoint
- Kong Manager OSS Access
- Create the Routes and Services
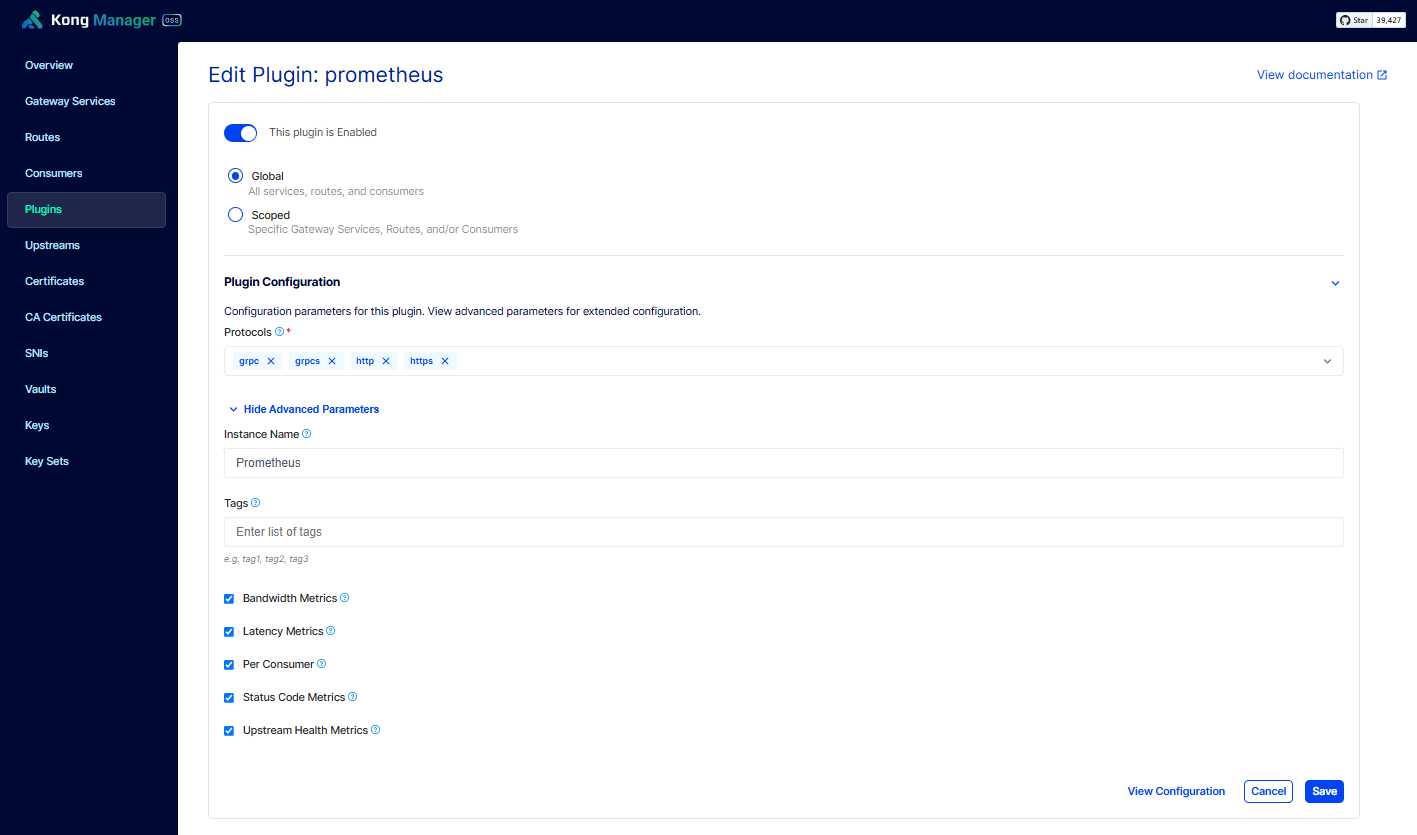
Enable the Prometheus Plugin
Login to the Kong Manager OSS UI and go to Plugins > New Plugin > Analytics & Monitoring > Prometheus. Enable the following and click Save.
- Bandwidth Metrics
- Latency Metrics
- Per Consumer
- Status Code Metrics
- Upstream Health Metrics
Generate Logs
To setup Postman, please see Testing with Postman
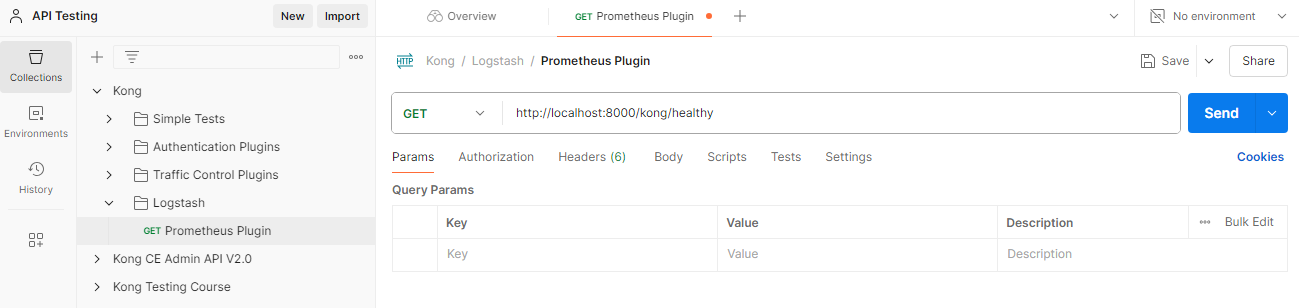
Open Postman and create a folder called Logstash. Right-click on the this folder and create a new GET request called Prometheus Plugin. Use this URL for the API request:
http://localhost:8000/kong/healthy
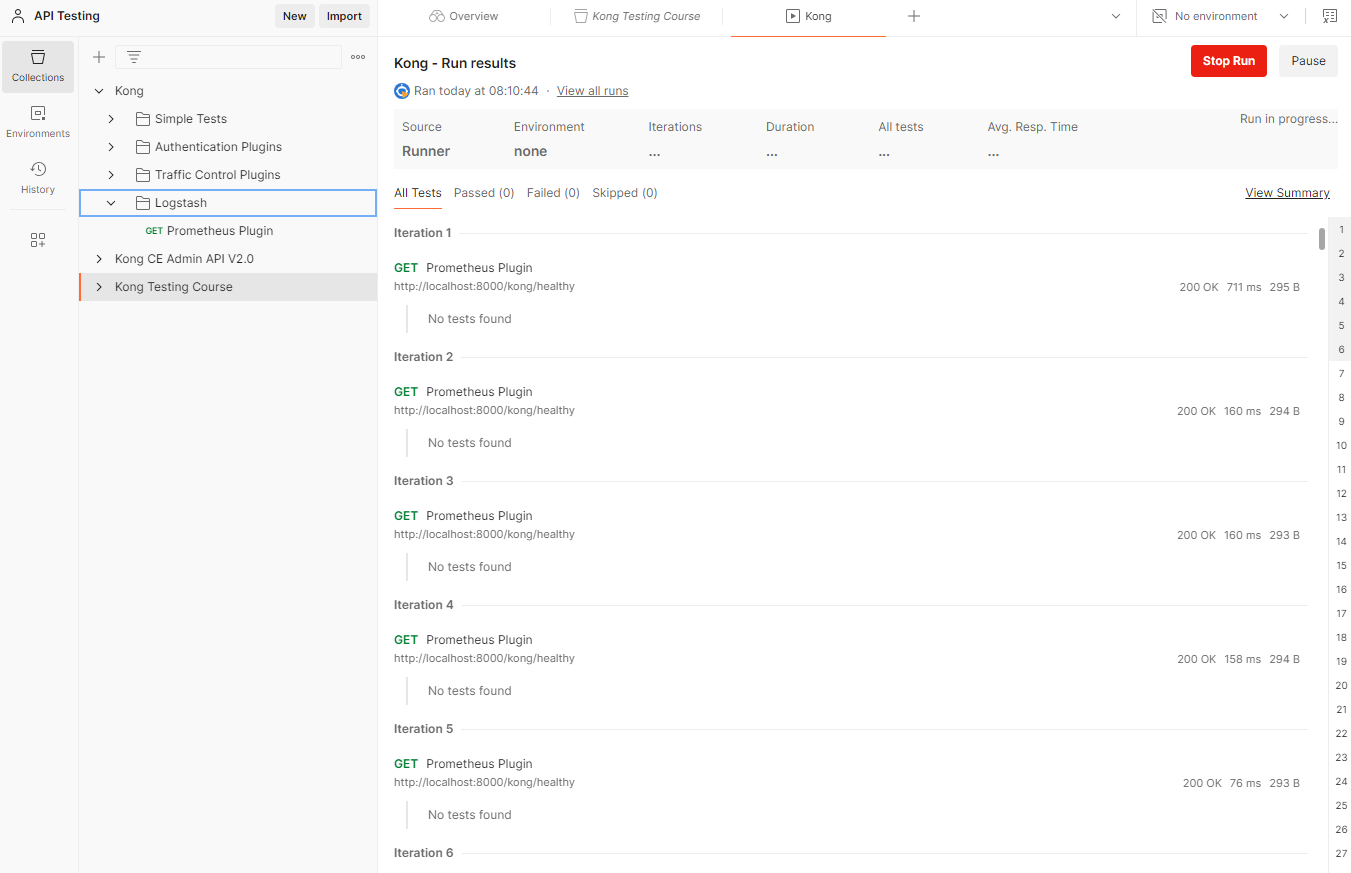
Right-click on the Logstash folder > Run folder. Then set Iterations to 1000. Click Run Kong.
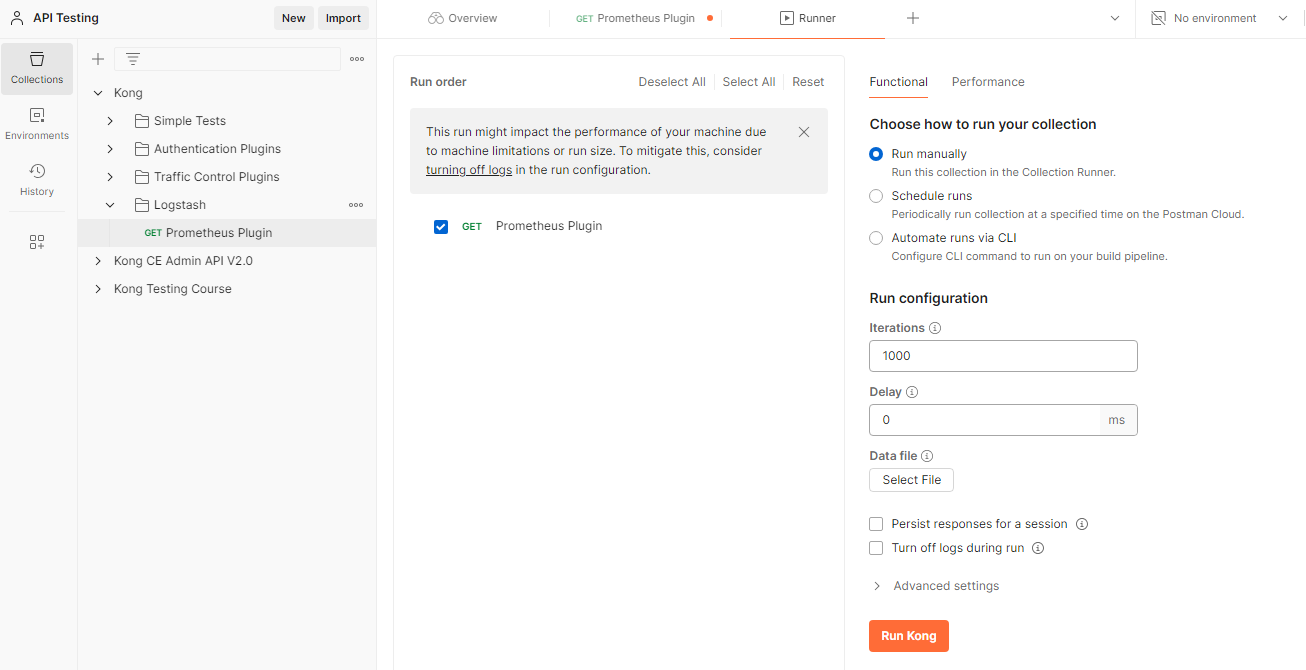
This will automatically create a loop and run the API requests 1000 times.
For this to work, you need to have the FastAPI Endpoint setup and the routes and gateway services must be configured.
Check Logs in Prometheus
Open a web browser and navigate to the Prometheus page:
http://localhost:9090/
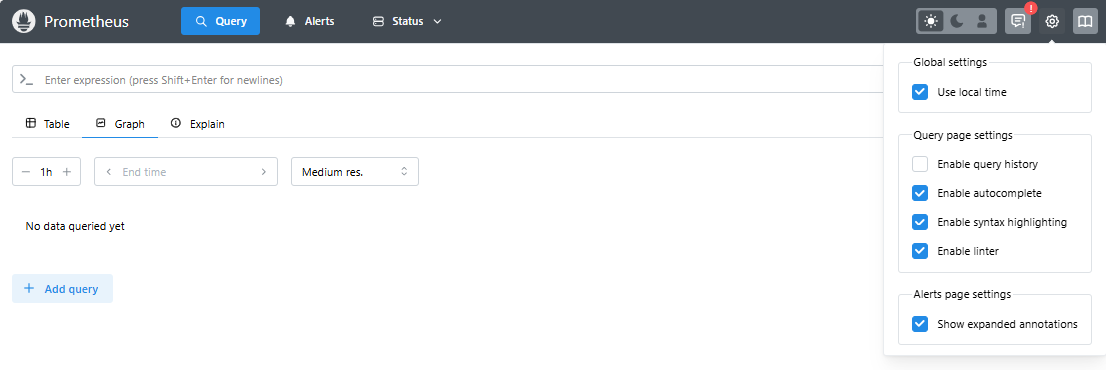
Click the gear icon on the right and make sure the following settings are enabled.
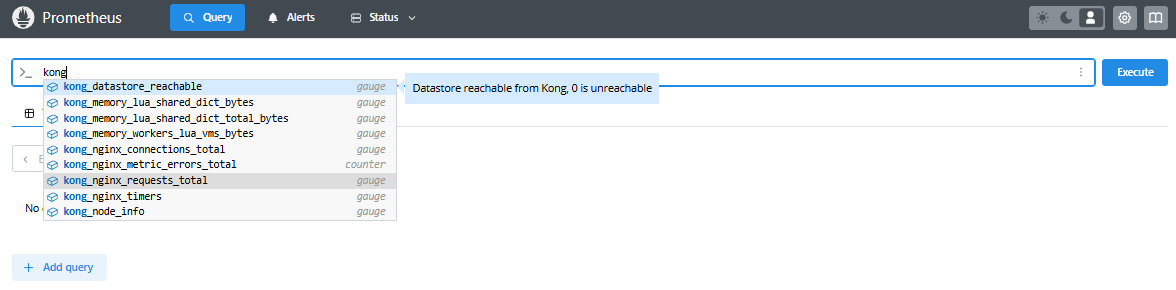
On the query field, type in 'kong` to show the available metrics. Select the correct one and click Execute.
kong_nginx_requests_total
If you don't see the Kong metrics, please see troubleshooting section.
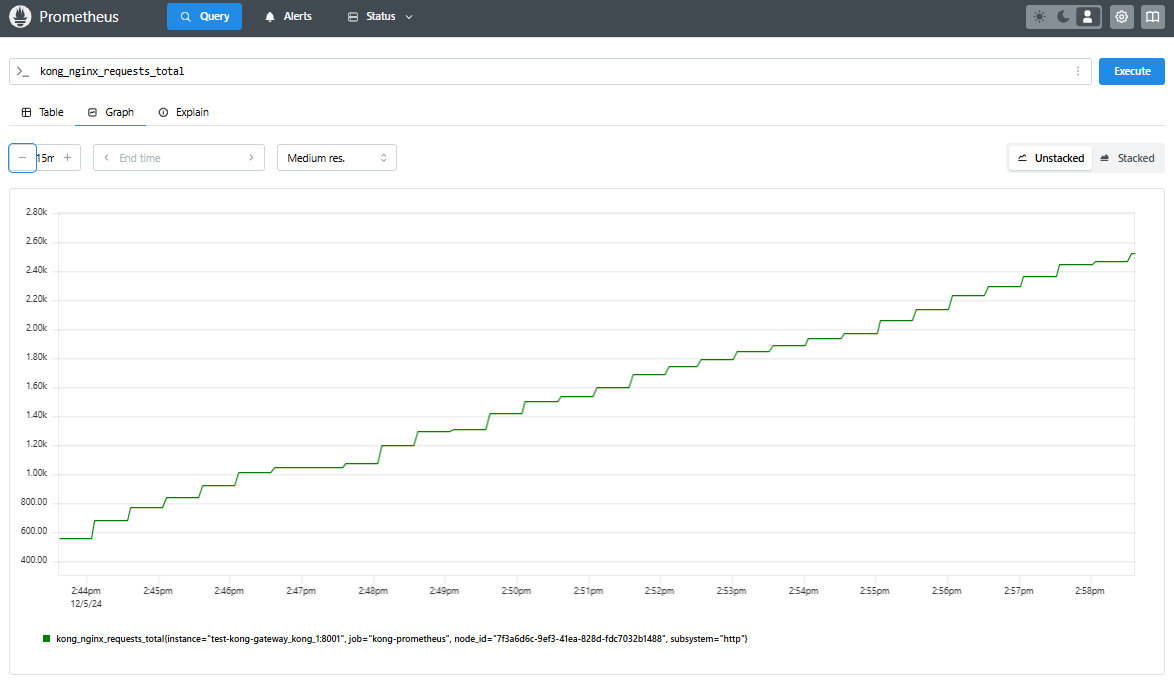
Click on the Graph tab. At the moment, there's not much data showing in the dashboard.
Create the Grafana Dashboard
Follow the steps below to add the data source and create the dashboard:
-
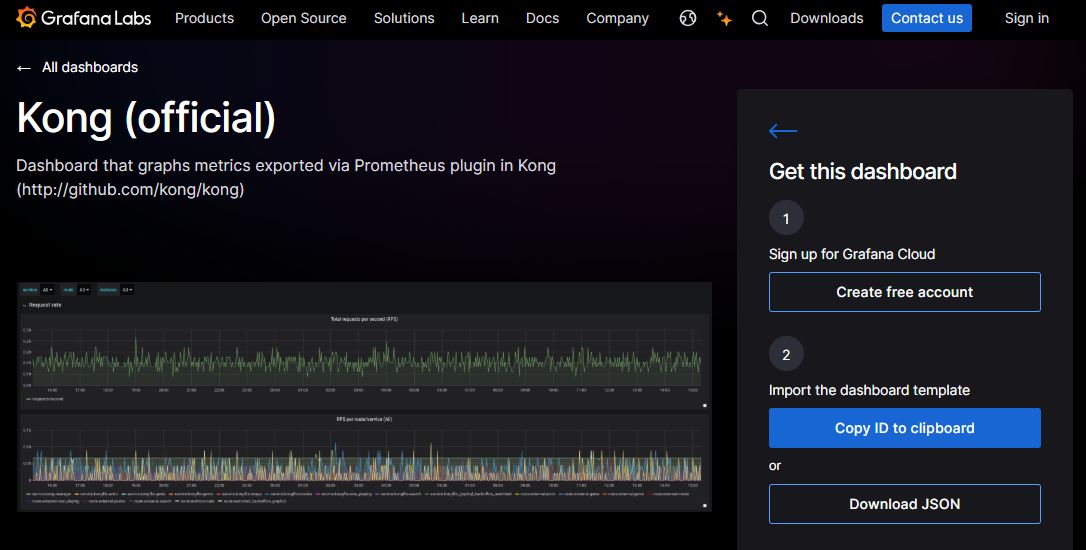
Go to Kong (official) - Grafana Labs and copy the dashboard ID. This will be used for later steps.
-
On another browser tab, open the Grafana page:
http://localhost:300
-
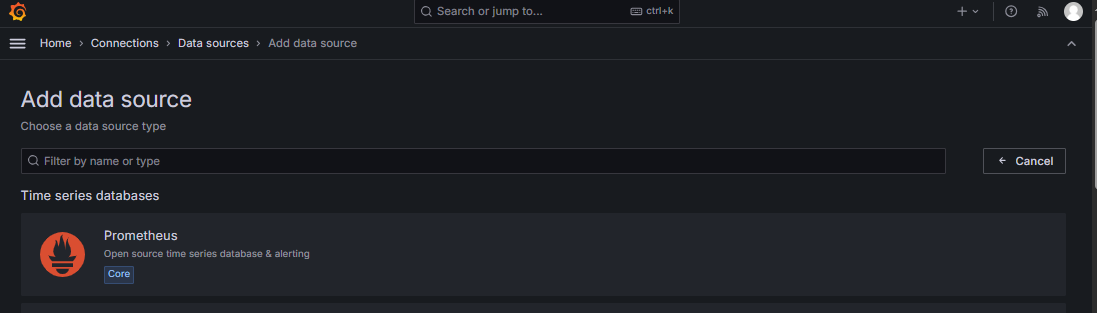
Click Add your first data source > Choose Prometheus as data source.
-
In the Connection settings, specify the server URL:
http://prometheus:9090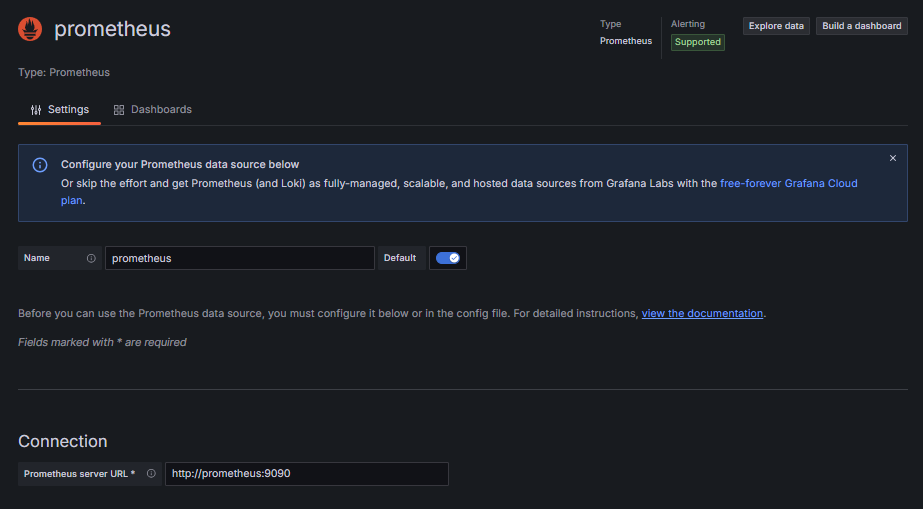
-
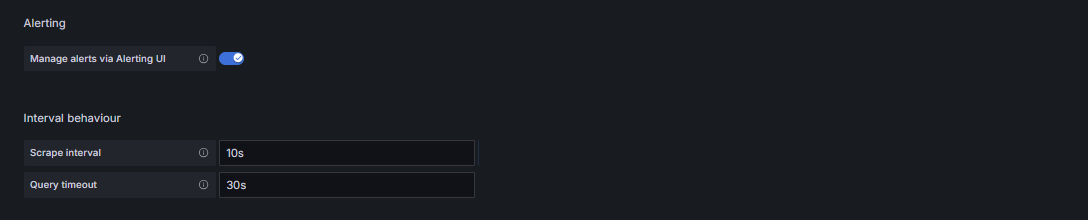
Under Alerting, set the following intervals.
-
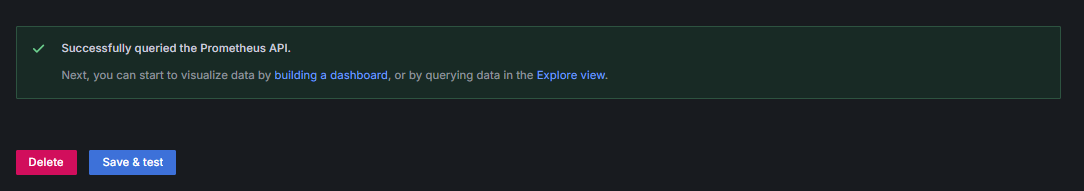
Click Save & test. Once its done, you should see the Success message.
-
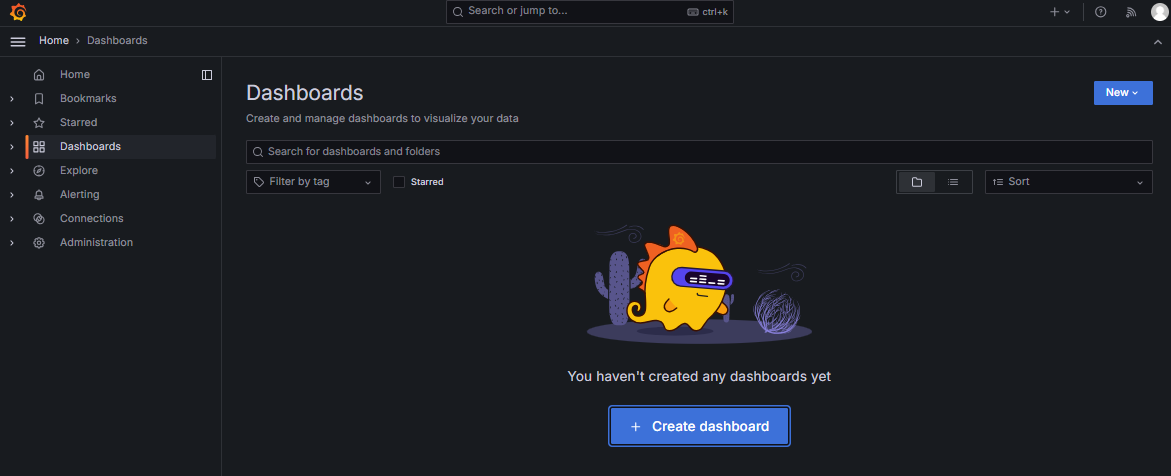
Click Dashboard on the left panel > Create dashboard
-
If prompted, discard any unsaved dashboard for now.
-
Enter the dashboard code from step 1. This code will be
7424. Click Load.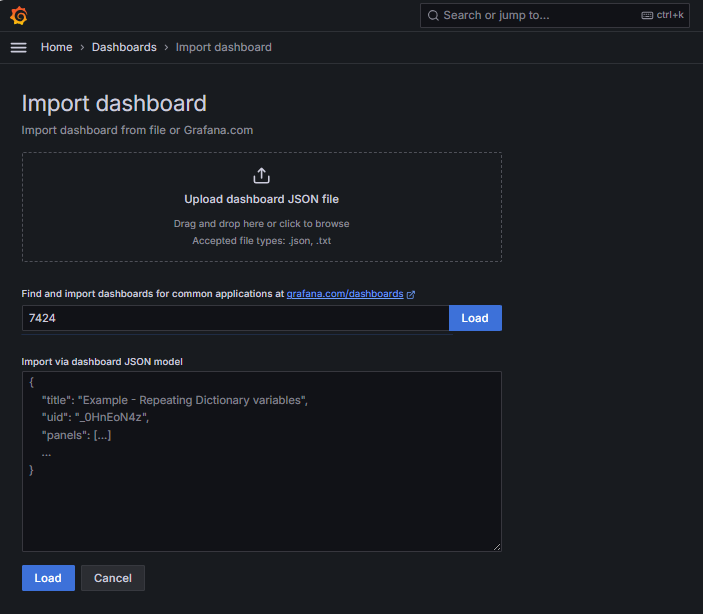
-
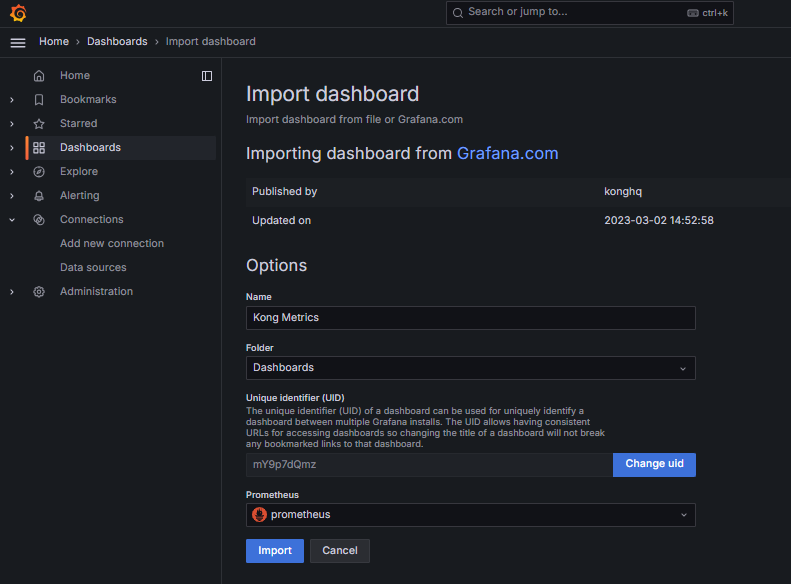
Select Prometheus as the data source. You may also change the dashboard name to "Kong Metrics". Click Import.
-
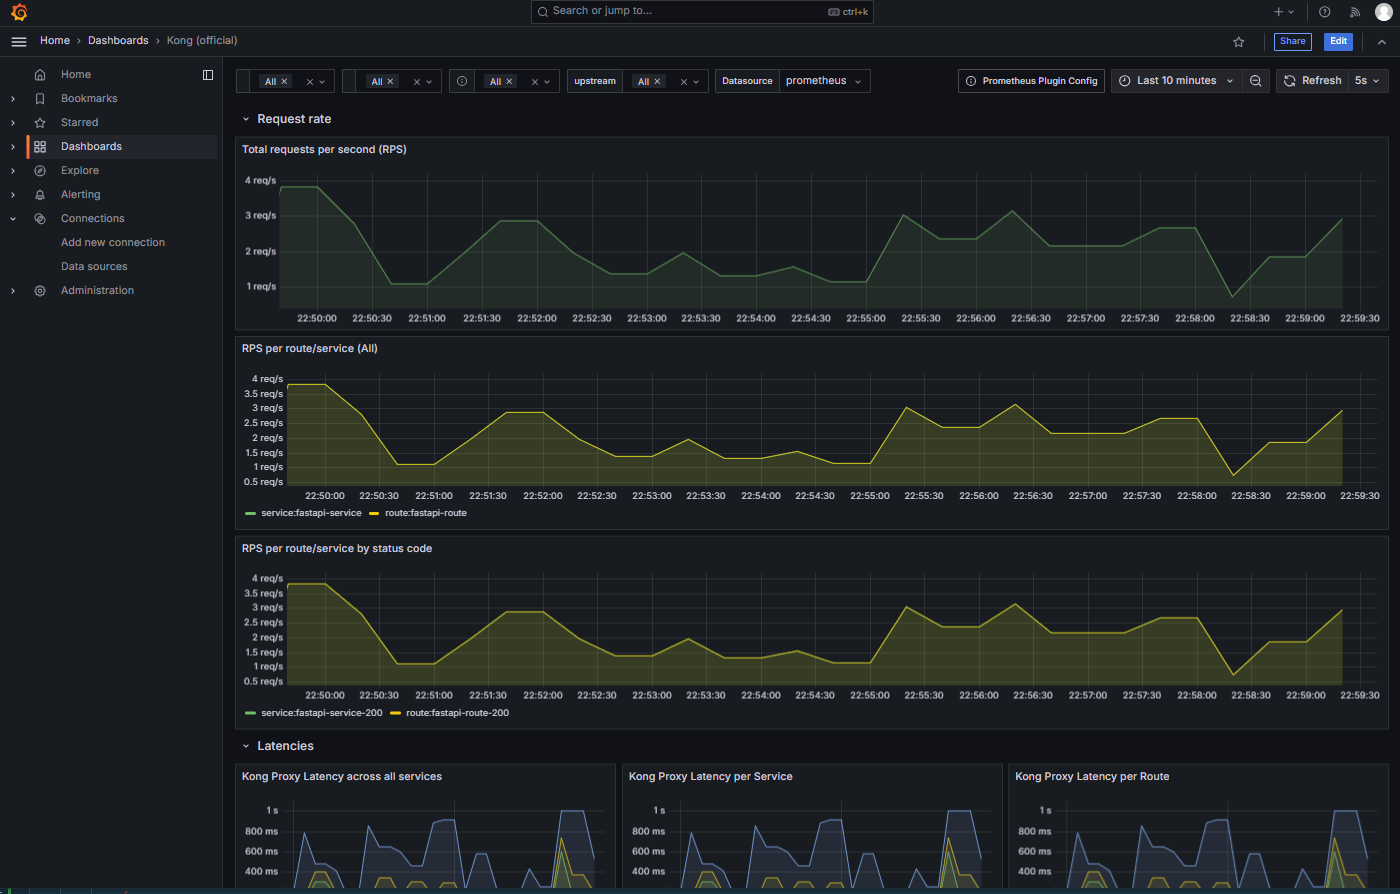
You should see more data coming in now:
Troubleshooting
Verify that the config file is being moutned correctly:
$ docker inspect prometheus | grep -A 10 "Mounts"

        "Mounts": [
            {
                "Type": "bind",
                "Source": "/path/to/config/prometheus.yml",
                "Destination": "/etc/prometheus/prometheus.yml",
                "Mode": "ro",
                "RW": false,
                "Propagation": "rprivate"
            },
            {
                "Type": "volume",
The config file should also be pointing to the correct container name for Kong. In the docker-compose file, the container name is test-kong-gateway_kong_1.
$ docker exec -it prometheus cat /etc/prometheus/prometheus.yml

global:
  scrape_interval: 30s

scrape_configs:
  - job_name: kong-prometheus
    static_configs:
      - targets: ['test-kong-gateway_kong_1:8001']