UDP Logs and ELK Stack
Overview
This guide covers the integration of UDP logs with the ELK Stack for efficient log collection and analysis.
- Collect and forward UDP logs
- Parse and index log data using ELK
Individual Components of ELK Stack:
- Elasticsearch: Centralized search and analytics engine for storing and querying log data.
- Logstash: Collects, processes, and transforms log data before sending it to Elasticsearch.
- Kibana: Visualization tool to explore and create dashboards from log data in Elasticsearch.
Lab Environment
This lab tests a Kong API Gateway deployment using a FastAPI endpoint. To simplify, both the containerized Kong API Gateway and the FastAPI endpoint are installed locally on a Windows 10 machine. A Docker Compose file is used to deploy Kong, along with other applications like Prometheus, Zipkin, the ELK Stack, and more.
Make sure that you have installed Docker Desktop.
Simply installing Docker in WSL2 without Docker Desktop may introduce some issue when configuring the communication between the containerized Kong API Gateway and the FastAPI application that is installed on the local host.
Pre-requisites
- Postman
- Setup the Kong API Gateway
- Setup the FastAPI Endpoint
- Kong Manager OSS Access
- Create the Routes and Services
- Create the Consumer
- Setup the ELK Stack
Setup Kibana
On your terminal, run the command below to get Kibana enrollment token:
docker exec -ti elasticsearch /usr/share/elasticsearch/bin/elasticsearch-create-enrollment-token --scope kibana
Next, get Kibana verification code:
docker exec -ti kibana /usr/share/kibana/bin/kibana-verification-code
Finally, reset the credentials to get a new password:
docker exec -ti elasticsearch /usr/share/elasticsearch/bin/elasticsearch-reset-password -u elastic
On a web browser, navigate to the Kibana UI:
http://localhost:5601
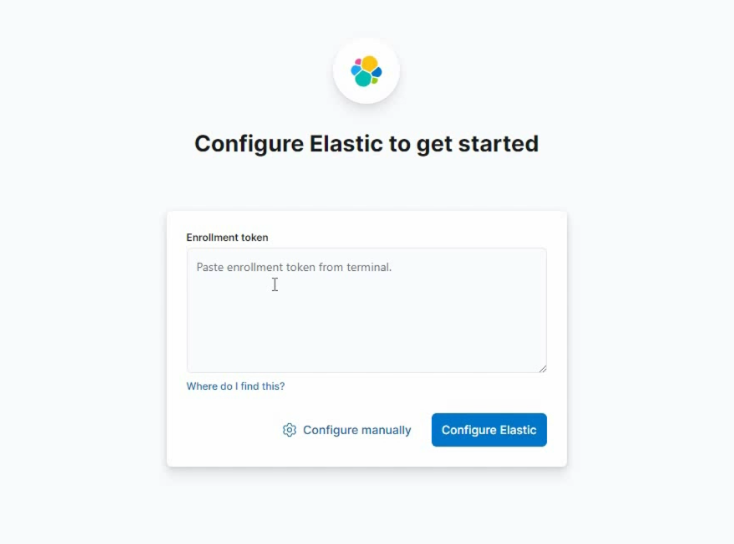
Provide the enrollment token when prompted:
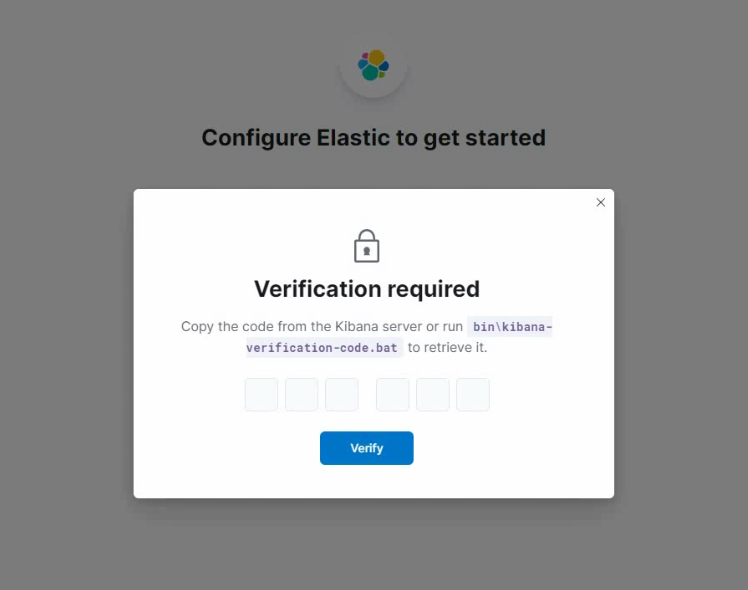
Next, provide the verification code:
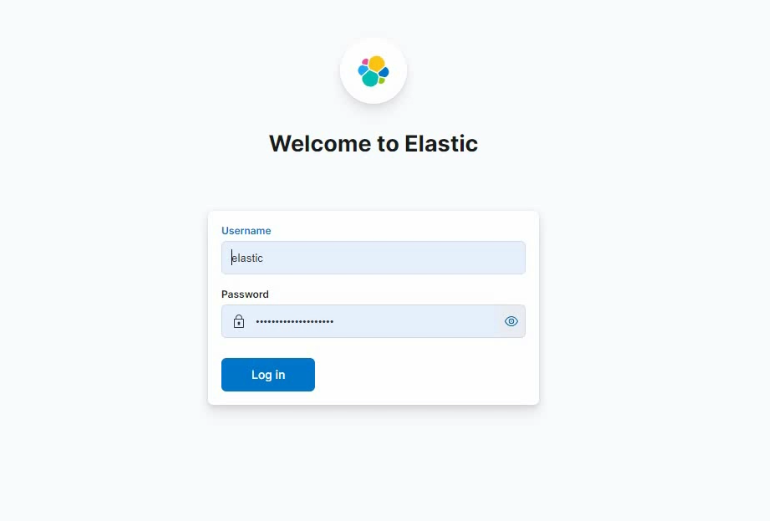
Once done with the configuration setup, the login page will appear. Enter the admin credentials with the new password:
The dashboard should now appear:
Update the Logstash Password
Go to the logstash directory and update the password in the pipeline.conf. Use the same password as the elastic user credentials:
output {
  elasticsearch {
    hosts => ["https://172.1.1.21:9200"]
    cacert => "/usr/share/logstash/certs/http_ca.crt"
	index => "kong-logs"
	user => "elastic"

	# change the password, between quote, e.g. "your-elasticsearch-password"
    password => "xxxxxxxxxxxxxxxxxxxxx"
  }
}
Restart the logstash container:
docker restart logstash
Copy the Certificate
First, find the self-signed SSL certificate and copy it to the container files:
docker exec -it elasticsearch sh -c "ls /usr/share/elasticsearch/config/certs/*.crt"
You will get the output indicating a file .crt.
/usr/share/elasticsearch/config/certs/http_ca.crt
Copy self-signed Elasticsearch certificate to current folder.
docker cp elasticsearch:/usr/share/elasticsearch/config/certs/http_ca.crt .
Create the directory in the logstash container to store the certificate:
docker exec -it logstash mkdir -p /usr/share/logstash/certs
Finally, copy the crt file to logstash container:
docker cp http_ca.crt logstash:/usr/share/logstash/certs/
Enable the UPD Logs Plugin
To enable the plugin, we can do it in the Kong Manager console or we can also run the curl command in your terminal:
curl -i -X POST http://localhost:8001/plugins \
    --header "Accept: application/json" \
    --header "Content-Type: application/json" \
    --data '{
        "name": "udp-log",
        "config": {
            "host": "logstash",
            "port": 5555
        }
    }'
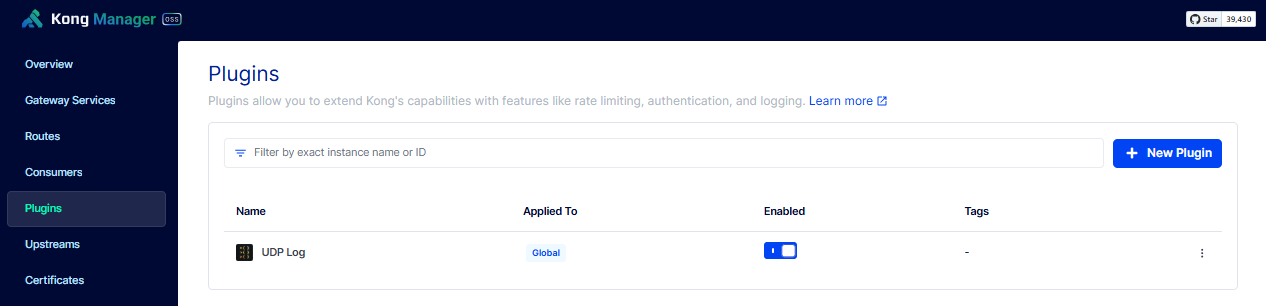
Login to the Kong Manager and confirm that the plugin is enabled:
Generate Logs
To setup Postman, please see Testing with Postman
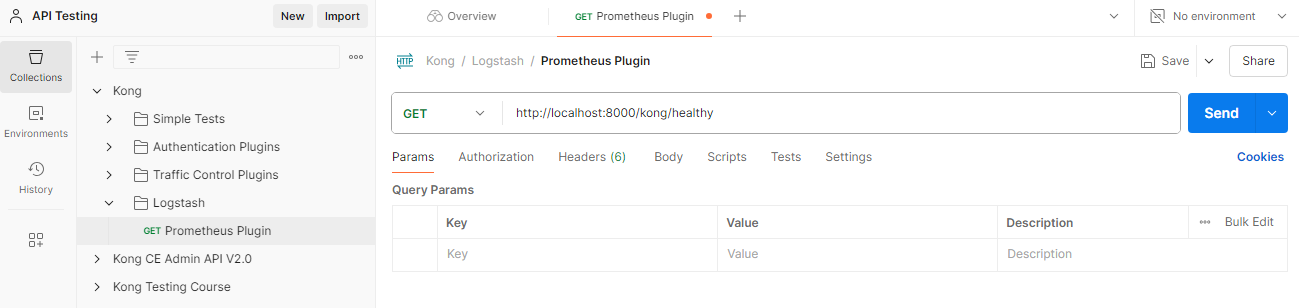
Open Postman and create a folder called Logstash. Right-click on the this folder and create a new GET request called FastAPI Endpoint. Use this URL for the API request:
http://localhost:8000/kong/healthy
Right-click on the Logstash folder > Run folder. Then set Iterations to 1000. Click Run Kong.
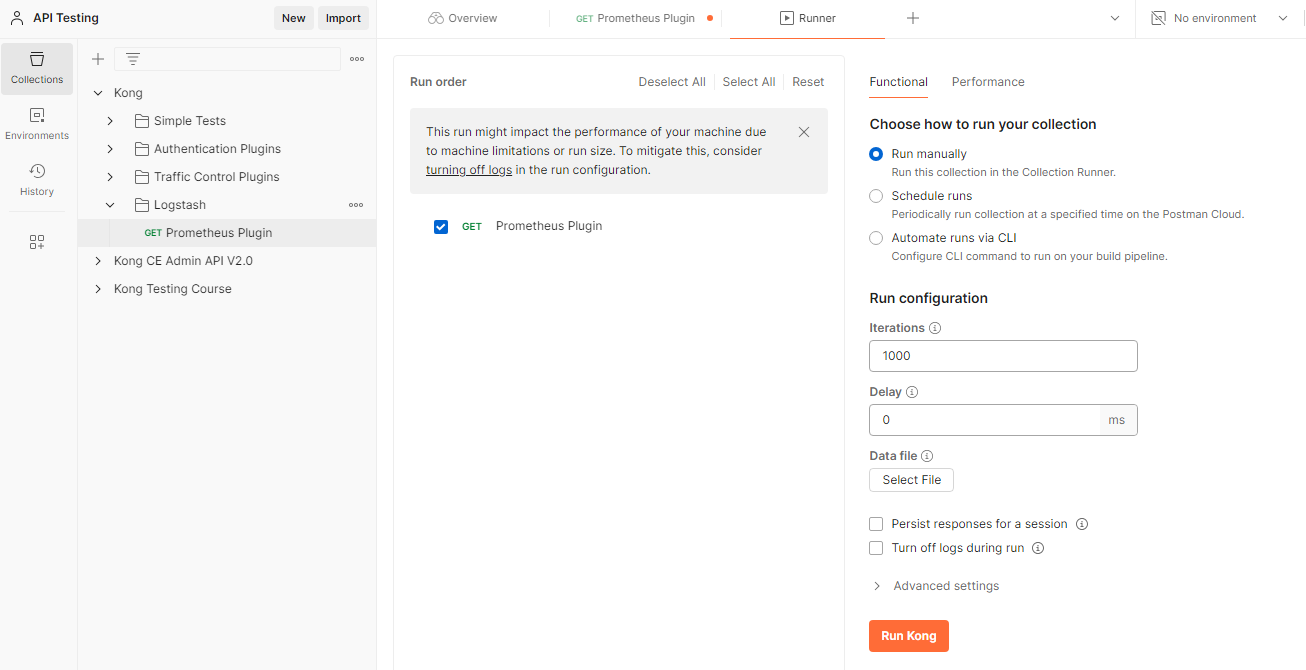
This will automatically create a loop and run the API requests 1000 times.
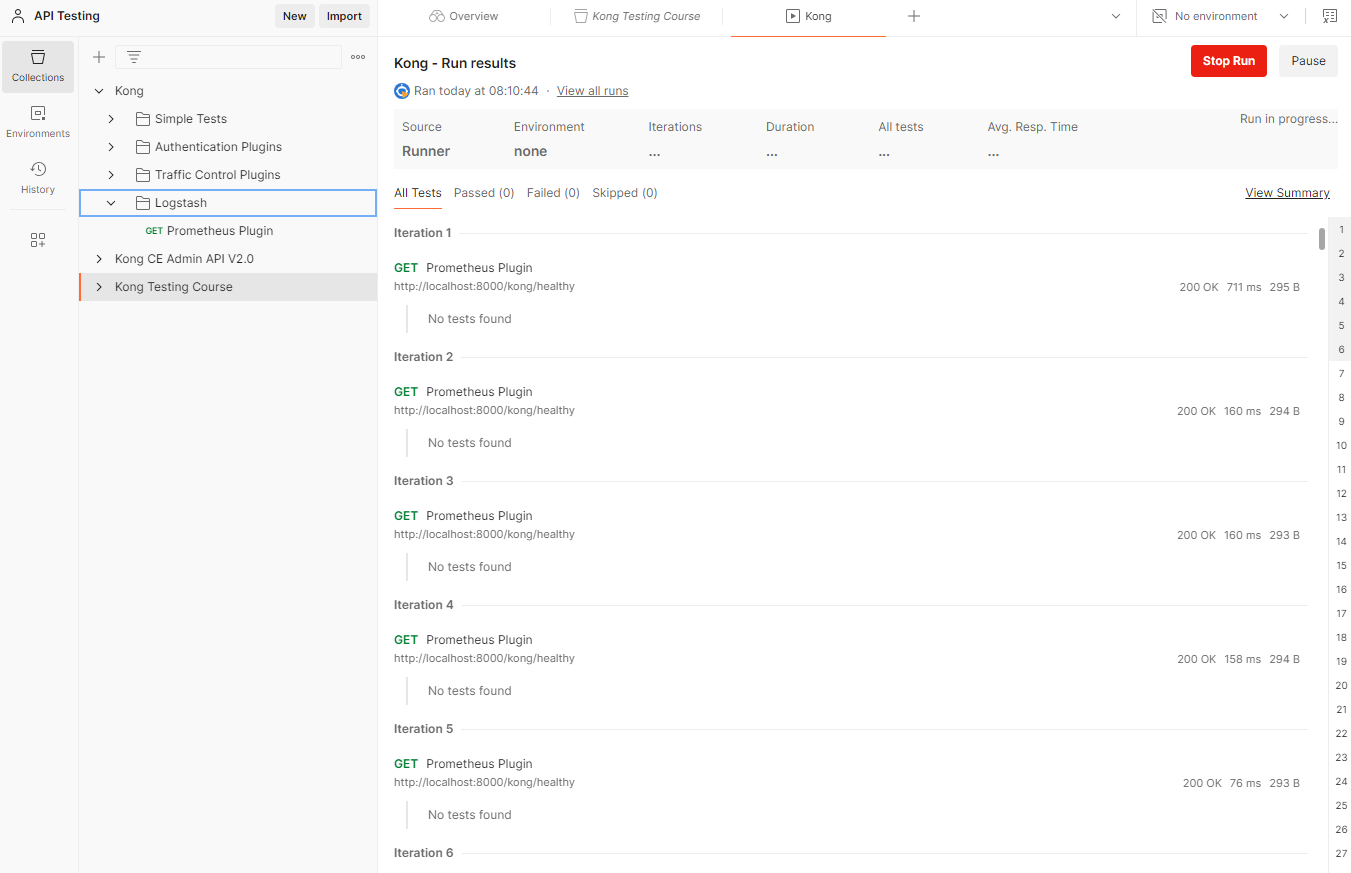
For this to work, you need to have the FastAPI Endpoint setup and the routes and gateway services must be configured.
Create the Dashboard in Kibana
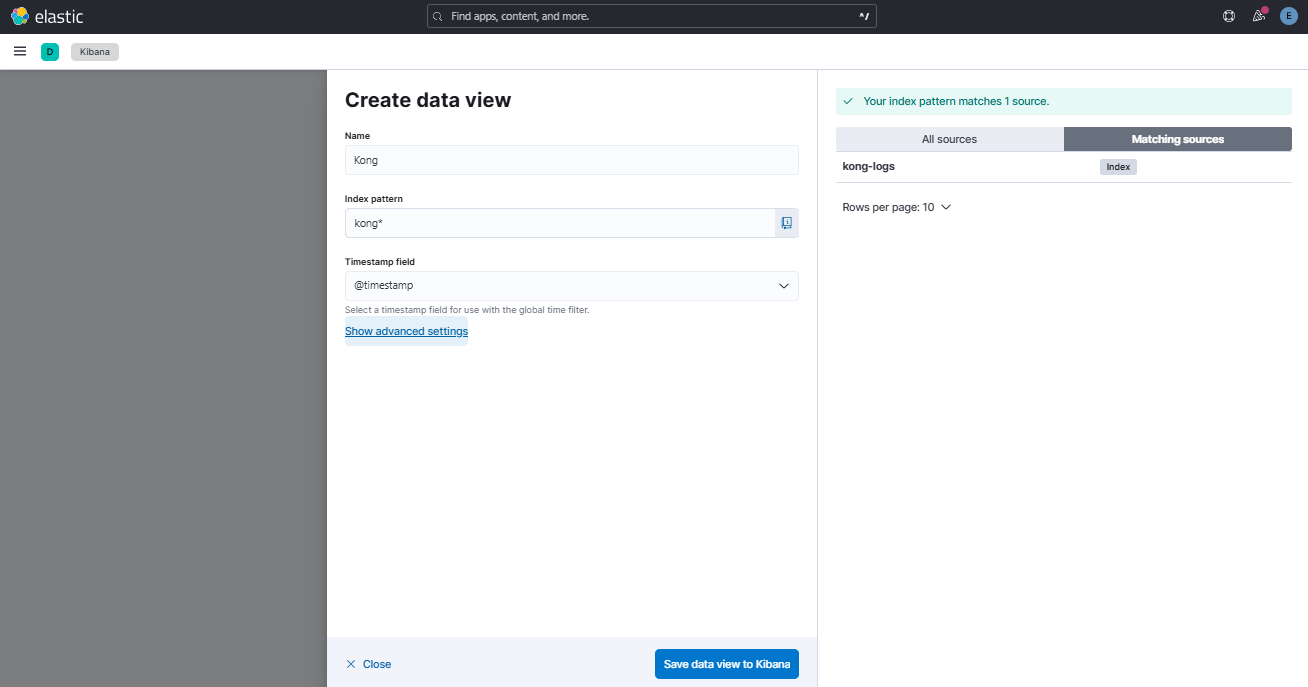
Go back to the Kibana dashboard, click the hamburger menu on the left > Analytics > Discover > Create data view.
The kong logs should appear on the right side as a log source. Specify the details below and clcik Save data view to Kibana.
| Field | Value |
|---|---|
| Name | Kong |
| Index pattern | kong* |
| Timestamp field | @timestamp |
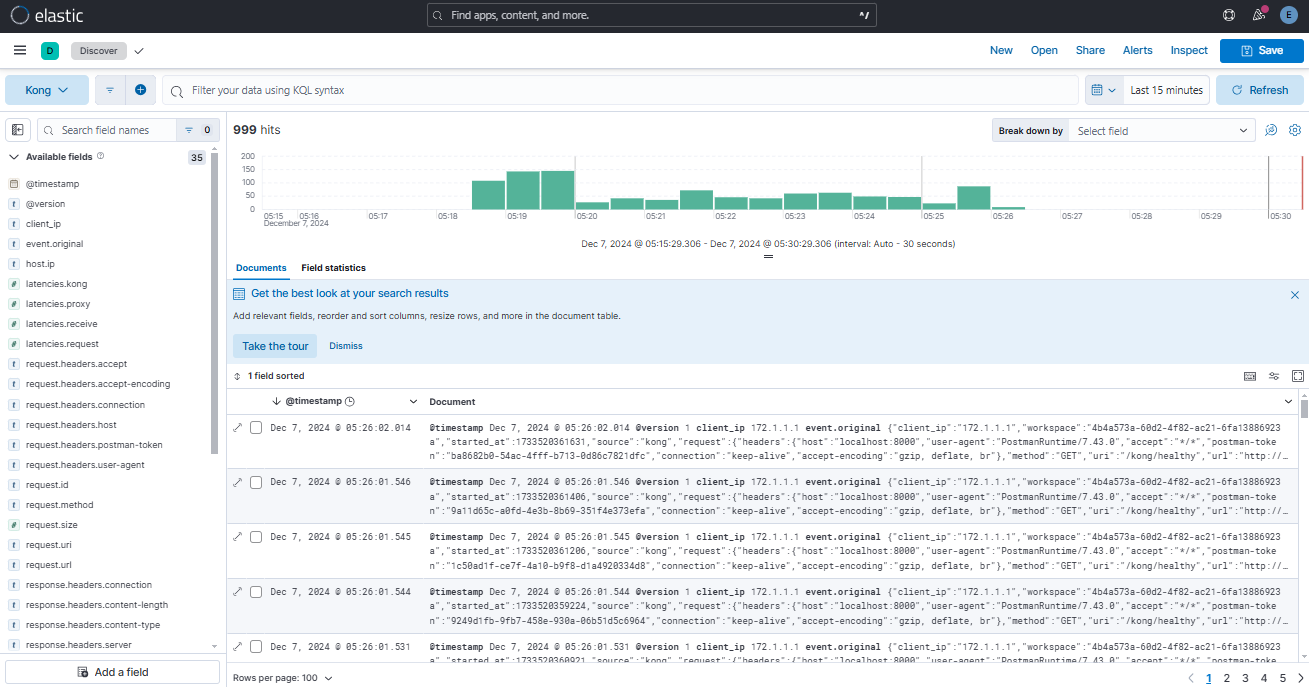
You should see the data coming in. Re-run the log generation in Postman in the previous step or change the iteration to a much higher number like 5000 to generate more traffic.
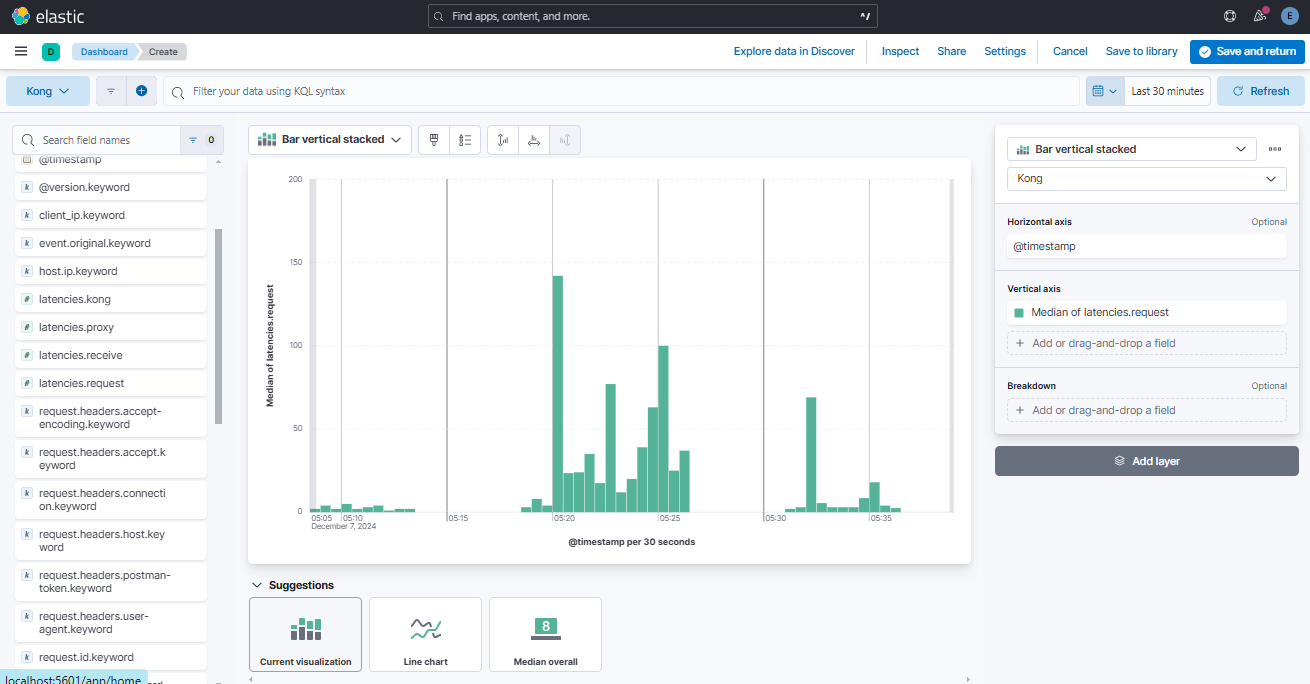
Create Visualization
On the Kibana dashboard, click the hamburger menu on the left > Analytics > Visualize Library > Create a dashboard > Create Visualization.
Select any of the metrics on the left panel and drag it to the middle.