Visualizations
Overview
Data storytelling is about presenting data in a way that tells a clear and engaging story. Visualizations play a big part in this, but we also need to focus on our message and audience.
The Right Visualization
To effectively communicate a message, pick a visualization that fits the audience's understanding.
- Technical audiences can handle complex graphs like density plots.
- Non-technical audiences prefer simpler visuals like histograms.
Different Audiences
Different audiences need different information.
-
For Investors
-
Share high-level graphs.
-
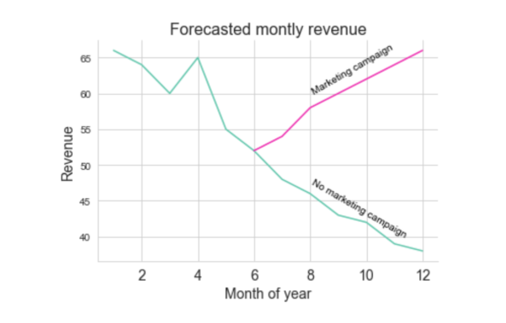
Show monthly revenue forecasts.
-
Display scenarios like launching or not launching a marketing campaign.
-
-
For Technical Leads
-
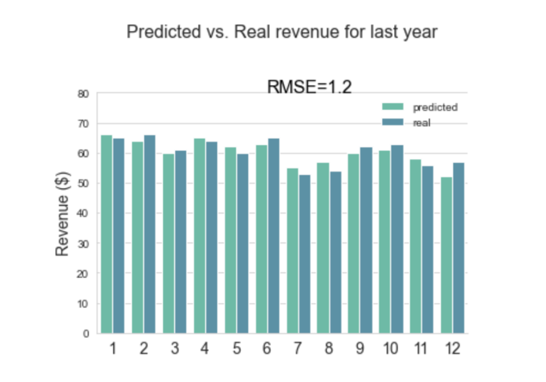
Show graphs with detailed model performance.
-
Focus on how the model performed with historical data.
-
Provide Context
Each visualization should offer context to help the audience understand the data better.
-
For Investors
-
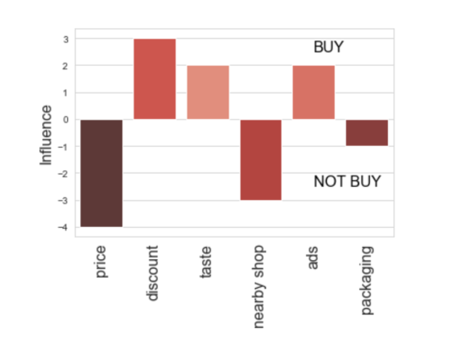
Include information on factors affecting customer buying decisions.
-
For example, higher prices lead to fewer purchases.
-
-
For Technical Leads
-
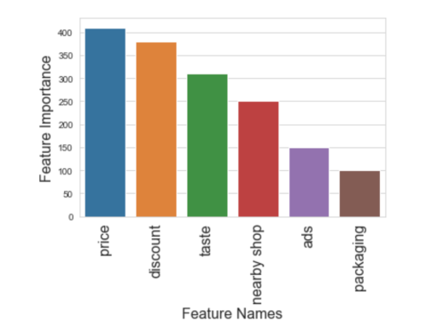
Provide a more detailed analysis.
-
Show the importance of different features in the model.
-
Simplify Data
Focus on the most important data. Not all data contributes directly to the message.
-
Reduce Noise
- Aggregate similar data to avoid overwhelming the audience.
- Example: Group products together instead of showing each individually.
-
Simplify Visuals
- Simple visuals are often more effective than complex ones.
- The goal is to help the audience grasp insights quickly.
McCandless Method
David McCandless, a data journalist, developed a method for presenting data effectively.
-
Headline
- Give the graph a clear, concise headline.
- The headline Should introduce the visualization.
- Focus the audience’s attention.
-
Anticipate Questions
- Answer common questions before they are asked.
- Key questions:
- Where does this data come from?
- Why focus on this feature?
-
Clarify Insights
- Explicitly explain what the audience is seeing.
- Don’t assume they will figure it out on their own.
-
Make It Relatable
- Help the audience relate to the data.
- Show how the insights connect to other parts of the story.
- Example: Explain how chocolate sales affect marketing strategies.