Application Map
Overview
Modern cloud apps aren’t a single server. They consist of multiple services, APIs, databases, and external dependencies. The hardest part of troubleshooting is figuring out where the problem is.
- Apps have multiple services and dependencies
- Issues can hide in any component
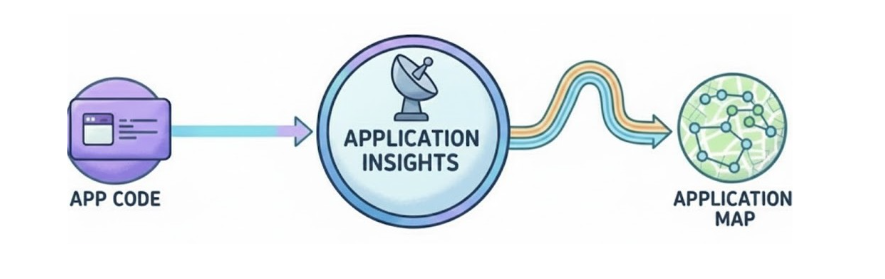
Application Map gives a live, visual view of your application and all the components it depends on.
- Shows web apps, APIs, databases, and external services
- Builds a live topology automatically
- Uses real telemetry data without manual setup
Distributed Tracing
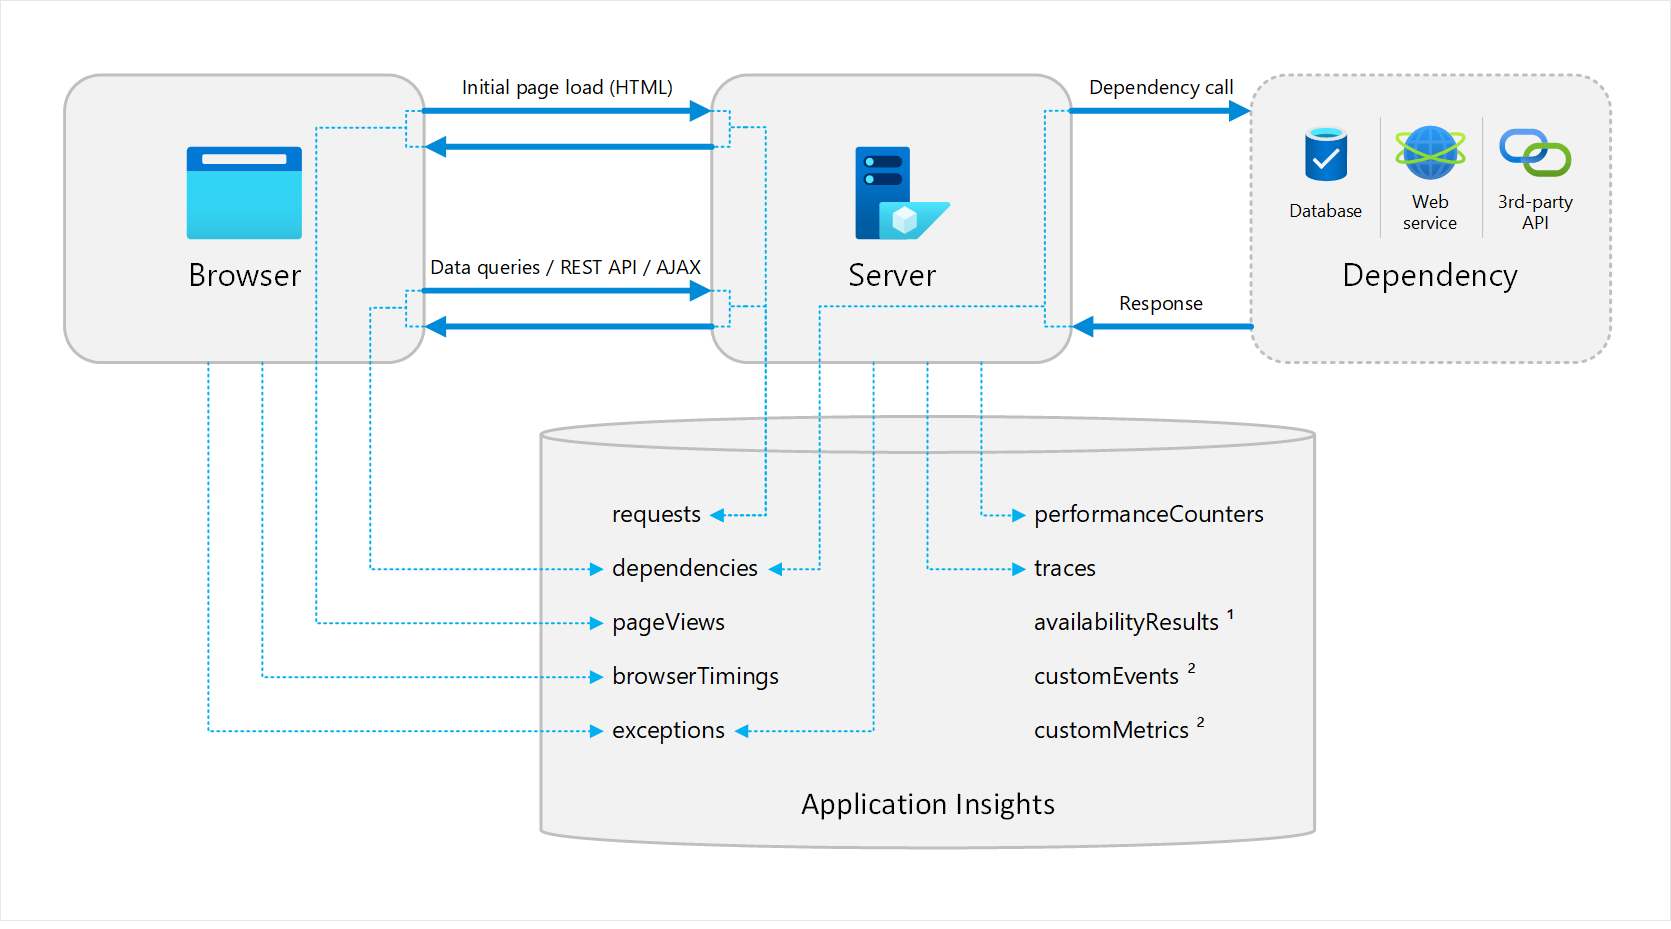
Application Map uses distributed tracing, which means every request that flows through your system leaves telemetry. Application Map stitches these traces into a dependency graph, no custom code needed.
Reading the Map
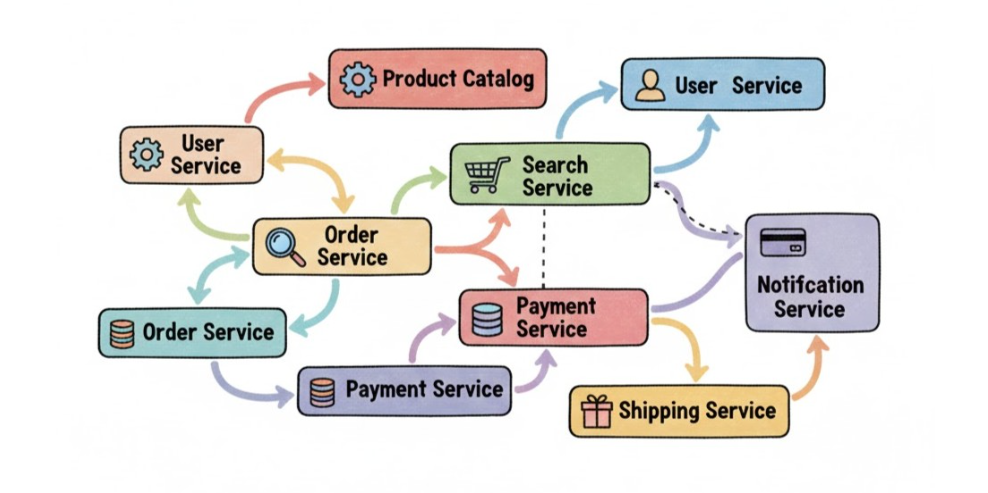
The application map shows your app as a network of nodes and connections. Each node represents a component like a web app or database. Lines show dependencies or outbound calls.
- Nodes represent individual services
- Lines show calls or dependencies between services
- Provides a clear view of the overall architecture
Even if you didn’t build the system, you can see how requests move through it.
Key Metrics
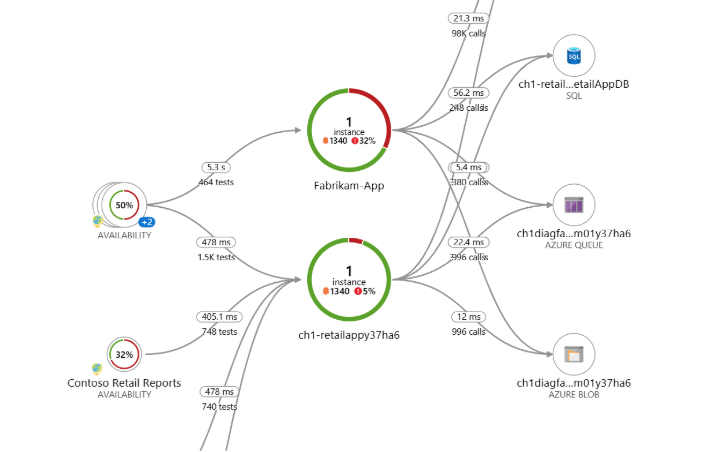
Every node displays metrics such as average latency, request count, and failure rate.
- Monitor latency and failures
- Identify problem services quickly
- Avoid writing queries for basic metrics
This helps you spot trouble in seconds.
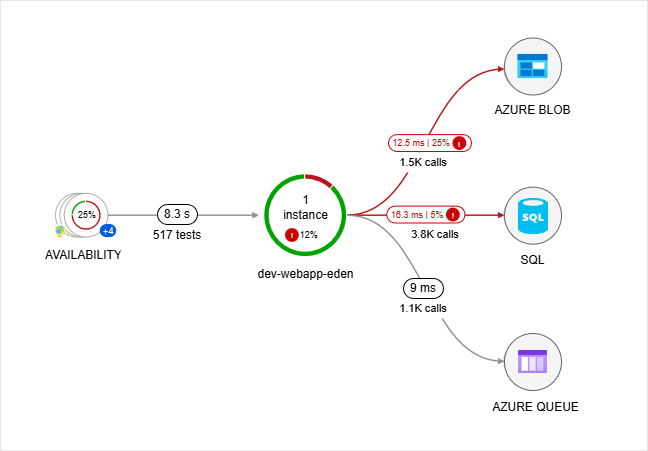
Dependency Health
Lines change color based on health. Red or orange indicates high latency or failures.
- Color shows dependency issues
- Helps distinguish slow services vs slow dependencies
- Makes root causes visible
You can quickly answer whether your app is slow or a dependent service is slow.
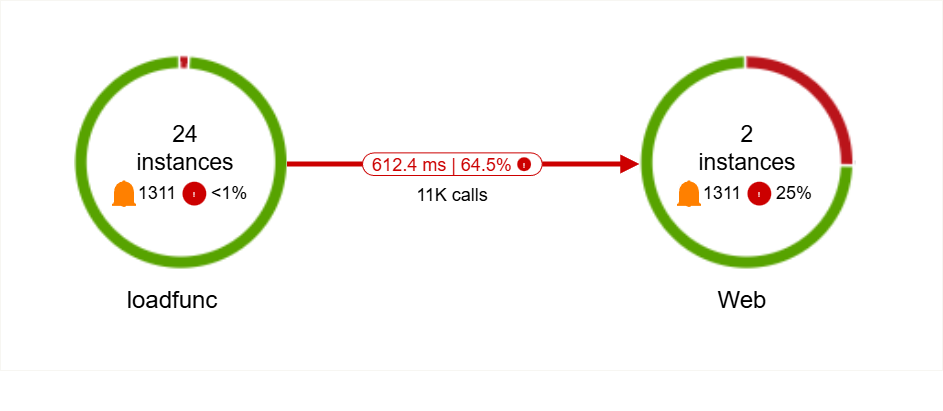
Application Map in Microservices
In microservice setups, requests pass through many independent services. Application Map shows the full flow.
- Visualizes request paths across services
- Exposes unhealthy dependencies
- Highlights failure patterns
This helps you understand cascading failures and focus on the services that matter.