DVC Metrics and Plots
Experiment Tracking
Metrics Tracking
DVC can track model performance metrics so you can compare experiments and choose the best model. Instead of treating metrics like normal outputs, they are stored separately.
- Metrics are defined using a
metricssection - Metrics files are tracked by Git, not DVC cache
- Cache is disabled using
cache: false
Metrics are written into a file such as metrics.json, and DVC treats this differently from large datasets or model artifacts. The metrics.json is then specified in the metrics section of the dvc.yaml file, instead of the outs section.
stages:
  preprocess:
    ...
  train:
    ...
    outs:
      - outputs/confusion_matrix.png
    metrics:
      - metrics.json:
          cache: false
This separation keeps experiment results lightweight and easy to compare across runs.
Querying and Comparing Metrics
After running experiments, DVC provides commands to inspect and compare results.
dvc metrics show
This shows the current metrics in terminal and also allows you to compare metrics across different commits or branches.
You can run an experiment, change a hyperparameter, and rerun the pipeline. Simply rerun:
dvc repro
This will create a new experiment version, and you can compare performance differences using built-in commands. To see whether the new model is better or worse than the previous one:
dvc metrics diff
DVC Metrics in GitHub Actions
DVC can be integrated into CI workflows to automate experiment tracking. Next, we will need to replace manual script execution with DVC pipeline execution in GitHub Actions by adding the dvc repro command to the workflow.
steps:
  ....
  - name: Setup DVC
    uses: iterative/setup-dvc@v2

  - name: Run DVC pipeline
    run: dvc repro
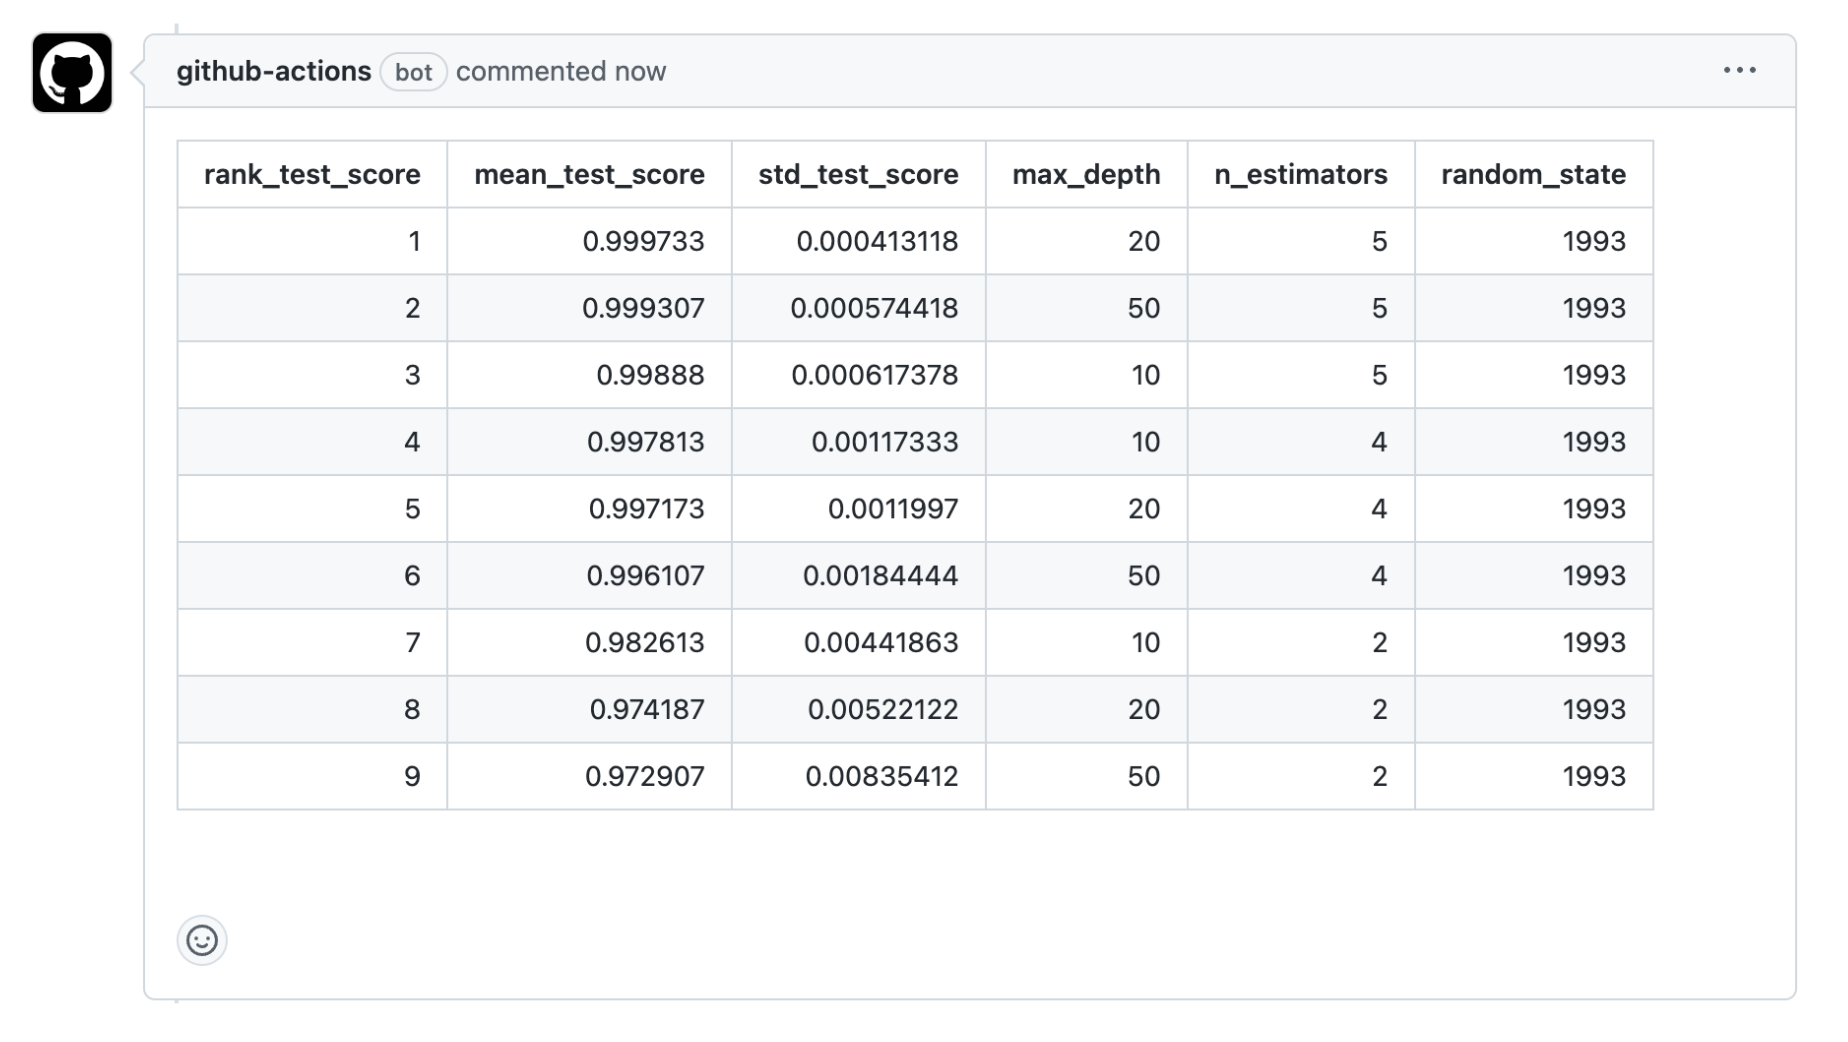
The CI pipeline can also fetch metrics and print them directly in the GitHub Actions logs or post them as comments in pull requests for easy comparison. This makes it easy to see whether a change improves performance before merging.
- name: Write metrics to PR comment
  env:
    GITHUB_TOKEN: ${{ secrets.GITHUB_TOKEN }}
  run: |
    # Post metrics.md content as a comment in the PR
    dvc metrics show --md > metrics.md
To compare the new metrics from the training branch with the main branch, we can add a dvc metrics diff step in the CI workflow:
- name: Write metrics to PR comment
  env:
    GITHUB_TOKEN: ${{ secrets.GITHUB_TOKEN }}
  run: |
    # Post metrics.md content as a comment in the PR
    dvc metrics show --md > metrics.md

    # Compare metrics with main branch and post diff
    git fetch --prune
    dvc metrics diff --md main >> report.md

    # Create CML report
    cml comment create report.md
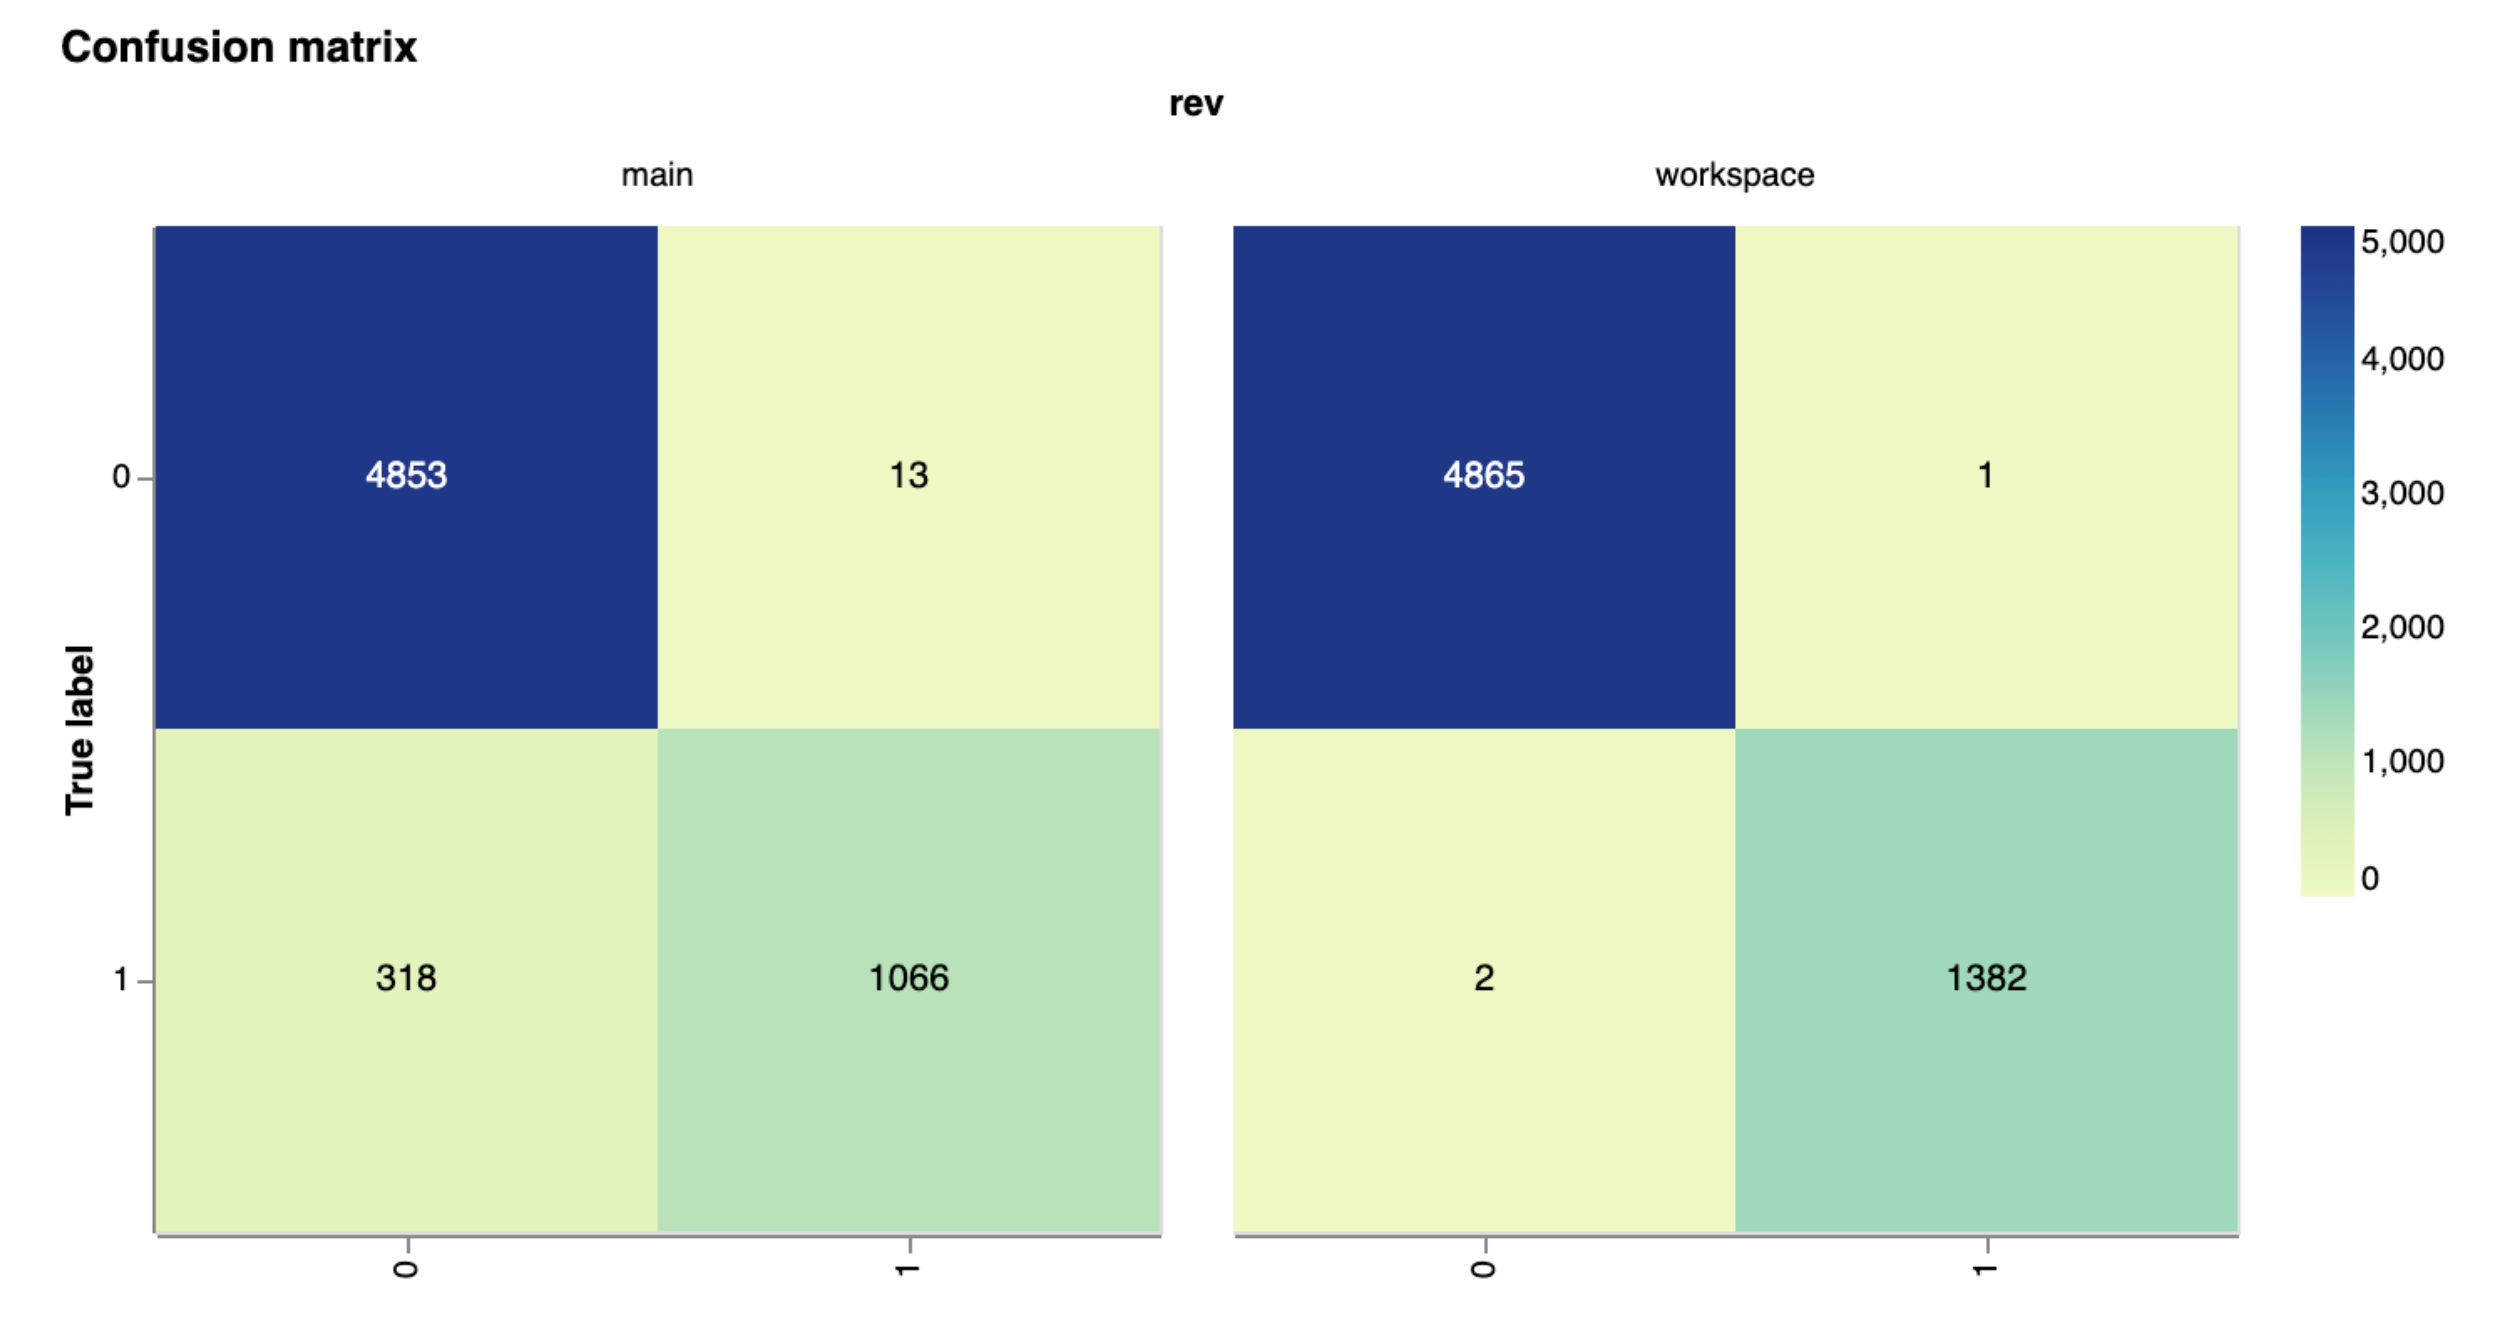
When a pull request is pushed, the CI pipeline runs and generates results.
- Metrics and diffs appear in PR comments
- First comparison may be empty if baseline is missing
- Results guide merge decisions
If the main branch has no previous metrics, the first comparison will not be meaningful. After that, every new experiment can be evaluated against a stable baseline.
This creates a continuous feedback loop for model improvements.
Plot Support
DVC also supports visual comparison of model behavior using plots. It supports the following types of plots:
| Type | Description |
|---|---|
| scatter | Shows relationship between two variables as points |
| line | Displays trends over continuous values using connected points |
| simple | Basic line plot without advanced styling or smoothing |
| smooth | Line plot with smoothing applied to reduce noise |
| confusion | Standard confusion matrix for classification results |
| confusion_normalized | Confusion matrix with values normalized as proportions |
| bar_horizontal | Horizontal bar chart for comparing category values |
| bar_horizontal_sorted | Horizontal bar chart with categories sorted by value |
Instead of saving images, DVC stores raw plot data. It then renders this data into interactive visualizations (HTML output) when needed.
Configuring Plots in dvc.yaml
Similar to metrics, the plots section specifies which data files to use and how to visualize them.
stages:
  train:
    ...
    plots:
      - predictions.csv:
          templates: confusion
          title: Confusion Matrix
          cache: false   ## Save in Git, not DVC cache
          x: true_labels
          y: predicted_labels
          x_label: True Labels
          y_label: Predicted Labels
Where:
templatesdefines the plot type (e.g.plot)- Columns define axes and structure
This ensures plots are reproducible and comparable across runs.
Viewing and Comparing Plots
We can also display plot using dvc commands in the terminal. By default, it will return the path to the generated HTML file. You can then open this file in a browser to view the interactive plot.
dvc plots show my-file.csv
Sample output:
file:///path/to/index.html
To compare plots between current branch and the main branch:
dvc plots diff --targets my-file.csv main
To compare plots between different branches and commits:
dvc plots diff --targets my-file.csv --rev1 main --rev2 feature-branch
This generates the interactive plot views and allows you to visually compare the plots across different versions of your data or model outputs.
Comparing ROC Curves
ROC curves show how well a classification model performs by comparing true positive rate and false positive rate at different thresholds. The values come from model outputs and are saved as structured data, which DVC can plot as a simple line chart.
- Plotted across different thresholds
- Compared across different branches
DVC then uses this data to draw line plots so we can quickly see which model performs better.
Python code:
y_proba = model.predict_proba(X_test)
fpr, tpr, _ = roc_curve(y_test, y_proba[:, 1])
DVC config:
plots:
- roc_data.csv:
    templates: simple
    title: ROC Curve
    cache: false
    x: fpr
    y: tpr
    x_label: False Positive Rate
    y_label: True Positive Rate
Optimizing Hyperparameters
Hyperparameters are values set before training and they control how a model learns. They strongly influence model performance, so they must be chosen carefully. Unlike model parameters such as weights and biases, hyperparameters are not learned from data during training.
- Set before training begins
- Control how the model learns
- Strongly affect model performance
Common examples include:
- Model architecture choices in neural networks
- Number of branches in decision trees
- Learning rate
Hyperparameter tuning improves model performance by trying different parameter combinations and selecting the best one based on evaluation results.
- Searches different parameter values
- Evaluates multiple configurations using metrics
- Selects the best-performing model
This process helps identify the best training configuration before final model training.
For a full workflow including DVC pipelines and CI/CD automation, see Hyperparameter Tuning