A/B Testing
Experiments in Data Science
Experiments are key in data science for making informed decisions and understanding patterns. The process typically starts with a question and hypothesis, followed by data collection, statistical testing, and interpretation. This approach helps to uncover insights and guide actions based on data.
- Start with a question and hypothesis
- Collect data, often by dividing subjects into groups
- Use statistical tests to check significance
- Interpret results to make decisions
Case Study: Blog Post Titles
Imagine you're trying to choose the best blog post title. You might wonder if Title A or Title B gets more clicks. You hypothesize that both titles will get the same clicks.
Why Data Science is the Hottest Career Choice You’ve Never Considered!
Ever wonder why data science is being hailed as the career of the future? Prepare to be amazed! From jaw-dropping salaries to cutting-edge innovations, this field is exploding with potential. You won't believe the impact you can make with just a laptop and some data. Don't miss out - your dream job might be just a click away!
The Secret to Massive Success: How Data Science Can Change Your Life!
Ready for a game-changer? Discover how data science can catapult your career to new heights and transform your life. This field is not just about numbers, it's about unlocking hidden patterns, making groundbreaking discoveries, and creating solutions that can change the world. Click now to find out how you can be part of this thrilling revolution!
To test this, you randomly split your audience so each group sees a different title.
- Randomly divide the audience into two groups
- Collect data on clicks for each title
- Analyze the click-through rate for each title
- Determine which title performs better or if results are inconclusive
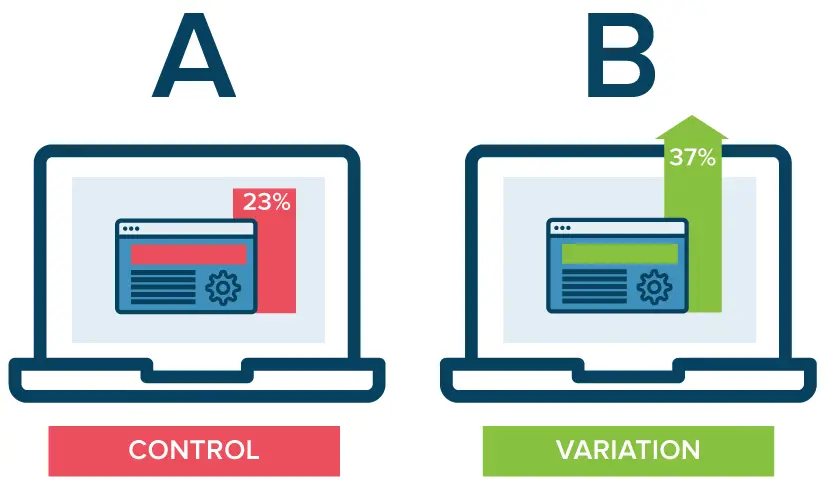
A/B Testing
A/B Testing, also called Champion/Challenger testing, is used to compare two options and make a choice.
- Sample size - number of data points used
- Statistical significance - result is not likely due to chance
The main steps in A/B testing include picking a metric, calculating sample size, running the experiment, and checking for significance.
- Pick a metric
- Calculate sample size
- Run the experiment
- Check for significance
Pick a metric
In the previous example of the blog titles, the metric we can use is the click-through rate, which is the percentage of people who lcicked on the link after viewing the title.
Calculate sample size
Next, we'll continue the experiment until we achieve a sample size that is sufficient to ensure that our results aren't due to random chance. This size is determined by a "baseline metric".
This baseline metric measures typical behavior - the usual frequency of clicks on our blog links. If this click-rate deviates significantly from 50%, a larger sample size is required. Given that our click-rate typically hovers below a small percentage, a substantial sample size will be necessary.
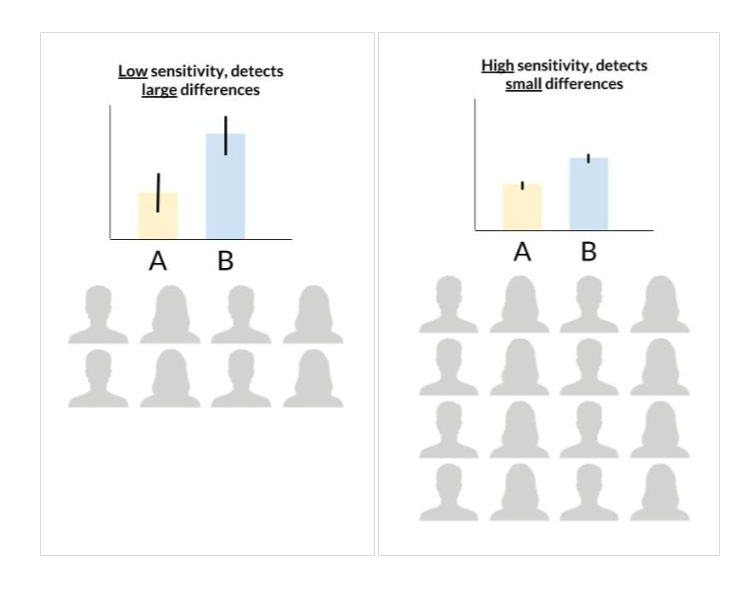
The sample size we need depends on the sensitivity we’re aiming for. Sensitivity shows how small of a change we can detect in our metric. Larger samples help us spot tinier differences. While you might think we want high sensitivity, it's more practical to aim for what's meaningful to our question.
Run the experiment
As mentioned, if 5% of viewers click on the first title and 5.01% click on the second, that extra 0.01% isn't significant for us. We'll run the experiment until we hit the calculated sample size. Stopping it too early or too late could skew our results.
Check for significance
Once we reach the target sample size, we examine our metric. We might see some differences between the titles, but how can we tell if they're meaningful? We do this by performing a test of statistical significance. If the differences are significant, we can be reasonably confident that they’re due to an actual difference in preference and not just random chance.
What if the results aren't significant? If there are differences in click rates, they're smaller than the threshold we set for sensitivity. Extending the test won't help because it would only detect smaller differences, which we’ve already decided are irrelevant. There might still be a difference in click rates between the titles, but it's not significant enough to impact our decision-making.