Time-Series Forecasting
Modeling in Data Science
Modeling is a fundamental part of data science where we use statistical methods to simulate real-world processes. By creating models, we define how different variables interact with each other based on historical data and statistical assumptions.
- Models use statistical equations to represent real-world processes
- Mathematical relations between variables, including random variables
Predictive Modeling
Predictive modeling is a type of modeling focused on making forecasts. It helps us predict outcomes based on different inputs, whether it’s future values or probabilities. It can predict things like future unemployment rates or the likelihood of a tweet being fake.

Time Series Data
Time series data involves tracking measurements over time, such as daily stock prices or monthly unemployment rates. This type of data is valuable for identifying trends and making predictions. It’s often displayed as a line graph with time on the x-axis.
- Stock prices
- Gas prices
- Unemployment rates
- Heart rates
- CO2 Levels
- Height of ocean tides
Seasonality and Patterns
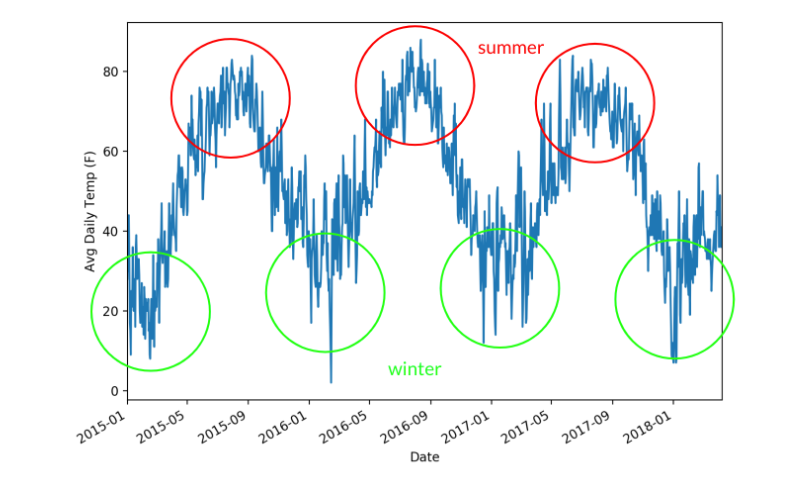
Analyzing time series data often reveals patterns or trends, such as seasonal variations. For example, you might notice higher temperatures in summer or increased ice cream sales during warm months.
- Patterns such as seasonality are common in time series data
- Seasonality shows repeating trends based on time, like monthly or seasonal changes
As an example, the graph below shows a pattern of highs and lows on certain months.
Forecasting time series
Forecasting uses time series data to predict future values and trends. This technique combines statistical methods and machine learning to generate accurate predictions.
- Forecasting applies historical time series data to predict future values
- It uses a mix of statistical and machine learning techniques for accurate predictions
Examples of Time Series Forecasting:
- Stock prices based on historical price trends and trading volumes
- Daily temperatures or rainfall based on past weather patterns and climatic conditions
- Future product demand to optimize inventory levels and reduce stockouts
- Future electricity usage based on historical consumption data and seasonal factors
- GDP growth or unemployment rates using historical economic data and trends
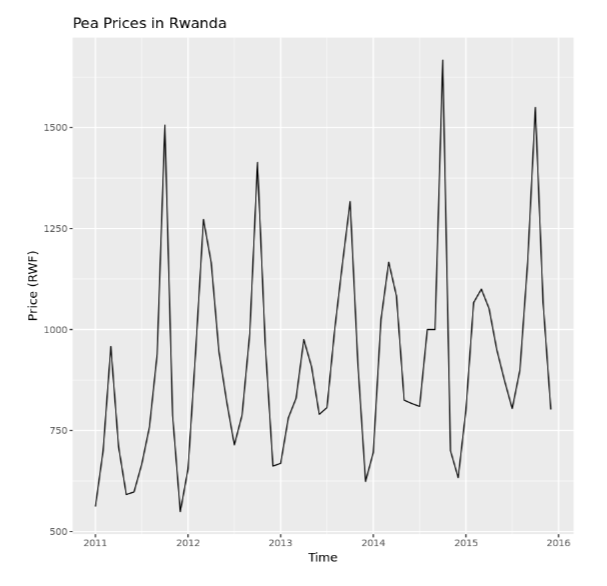
Case Study: Pea Prices in Rwanda
An example of forecasting is predicting pea prices in Rwanda using historical data. By analyzing past price trends and seasonality, we can make informed predictions about future prices.
Predictions:
- Historical data shows patterns and seasonal trends in pea prices
- Confidence intervals to help assess prediction reliability and manage uncertainties
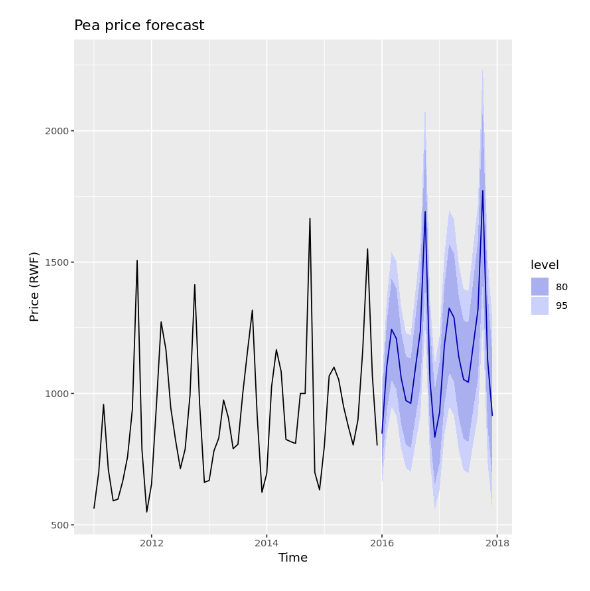
Here’s the forecast from the predictive model. The blue line shows the predicted trend, indicating continued increases in pea prices with visible seasonal fluctuations. Two shaded blue areas represent confidence intervals: 80% and 95%. The model is 80% confident the true value will fall within the 80% interval and 95% confident within the 95% interval. These intervals help account for uncertainty when making significant decisions.