Observability by Design
Overview
Observability should be designed into the architecture before deployment, not added after the system is already running.
At minimum, the system should provide:
- Logs for events, errors, and important state changes.
- Metrics for infrastructure health, application performance, and business outcomes.
- Traces for following requests across services.
- Alerts for conditions that require action.
Good observability helps teams understand what the system is doing, investigate failures, measure user impact, and determine whether the architecture is meeting its requirements.
Three important observability decisions should be made before deployment:
| Area | Main Decision | Goal |
|---|---|---|
| Instrumentation | Decide what metrics, logs, and trace context the application should produce | Connect technical behavior to application and business outcomes |
| Alerting | Decide which conditions are important enough to trigger action | Generate meaningful and actionable alerts |
| Retention | Decide which logs to retain, how long to retain them, and where to store them | Balance operational needs, compliance requirements, and cost |
Instrumentation
Infrastructure metrics are a starting point, but they do not provide the complete picture.
For example, high CPU utilization tells you that a container is busy. It does not tell you whether customers can successfully place orders or whether payments are failing.
Observability should therefore combine infrastructure telemetry with application-specific telemetry.
| Type | Examples | Purpose |
|---|---|---|
| Infrastructure Metrics | CPU, memory, request count, and network activity | Measure the health and utilization of infrastructure |
| Custom Metrics | Orders per minute, payment failures per hour, and processing latency | Measure application behavior and business outcomes |
| Structured Logs | Request details, application events, errors, and state changes | Provide searchable context for troubleshooting |
| Traces | Trace IDs, spans, service calls, and request duration | Follow a request across multiple services |
Infrastructure metrics are commonly emitted automatically by the platform. Custom metrics usually need to be identified and designed into the application.
Custom Metrics
Custom metrics should represent outcomes that matter to the application or business.
Useful examples include:
- Orders completed per minute
- Payment failures per hour
- Authentication failures
- Jobs successfully processed
- Processing latency
- API success rate
- Queue processing time
A system can have healthy CPU and memory utilization while still failing its business purpose. Custom metrics help expose this difference.
Structured Logs and Trace Context
Logs become much more useful when they are structured and correlated with distributed traces.
Without trace IDs, a request passing through several services may produce thousands of unrelated log entries. Engineers must manually determine which entries belong to the same request.
With trace context, the same trace identifier can be propagated across services:
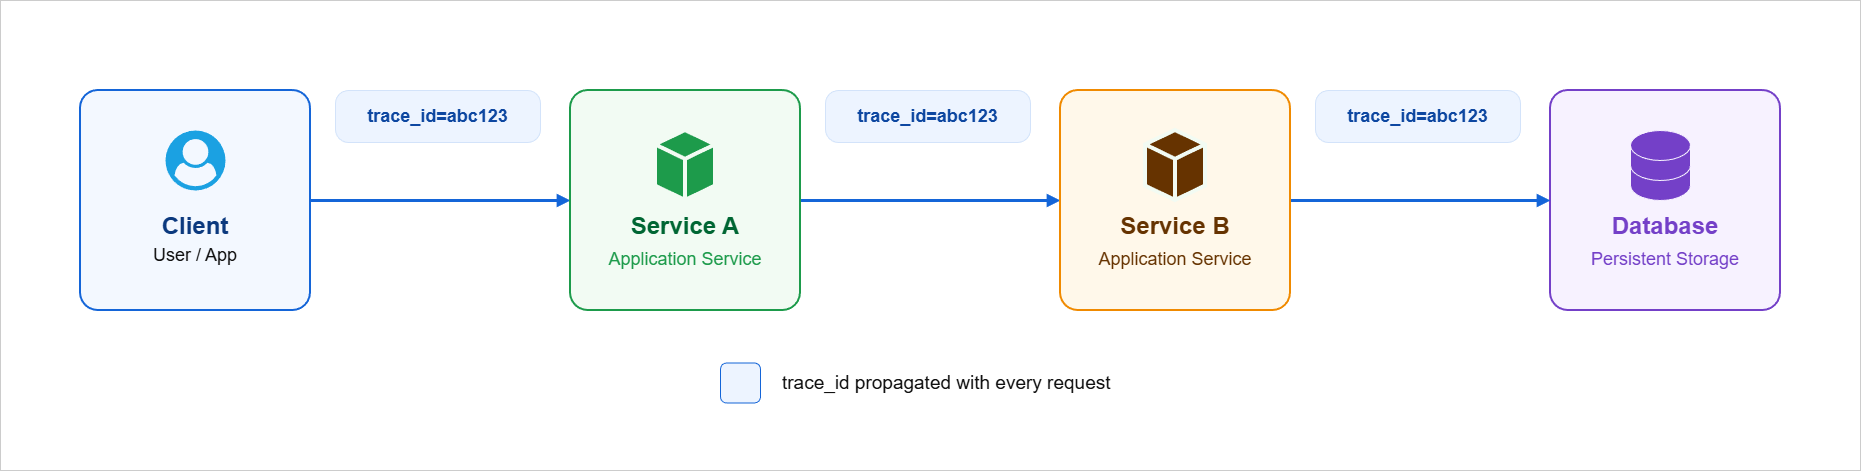
The trace ID can then be used to filter logs and reconstruct the complete request sequence across the system.
Trace context should be designed into the application from the beginning. Logs that were generated without trace information cannot later be automatically associated with a trace that was never recorded.
Alerting
Alerting should focus on conditions that require action.
Creating alerts for every unusual metric can lead to alert fatigue. When too many alerts are generated, engineers may begin ignoring them, including the important ones.
For example:
| Alert Type | Example | Problem or Benefit |
|---|---|---|
| Raw Threshold | CPU > 80% | May trigger during normal workloads such as batch processing |
| SLO Burn Rate | Error budget is being consumed at 5 times the expected rate | Indicates that a service commitment is at risk |
A temporary CPU spike may be completely normal. An SLO error budget being consumed rapidly is more meaningful because it is connected to service reliability.
The goal is not simply to have fewer alerts. The goal is to have better signals.
SLI, SLO, and Burn Rate
Meaningful alerting can be built around a simple chain:

| Concept | Purpose | Example |
|---|---|---|
| SLI | Measures actual service behavior | Percentage of successful requests |
| SLO | Defines the expected service target | 99.9% successful requests |
| Error Budget | Defines how much failure is acceptable while still meeting the SLO | Remaining allowable failures |
| Burn Rate | Measures how quickly the error budget is being consumed | 5 times the expected consumption rate |
Burn-rate alerts help connect monitoring to an actual reliability commitment instead of an arbitrary infrastructure threshold.
For example:
Normal
Error budget burn rate: 1x
→ No alert

Abnormal
Error budget burn rate: 5x
→ Alert and investigate
Log Retention
Not all logs have the same value, and retaining logs has a cost.
Retention requirements should therefore be defined before deployment.
For each log type, determine:
- Which logs need to be collected.
- How long the logs need to be retained.
- Where the logs should be stored.
- How frequently the logs need to be queried.
- Whether regulatory or compliance requirements apply.
Operational logs may only need short-term retention, while audit logs may need to remain available for months or years.
Example: Google Cloud Logging and Log Sinks
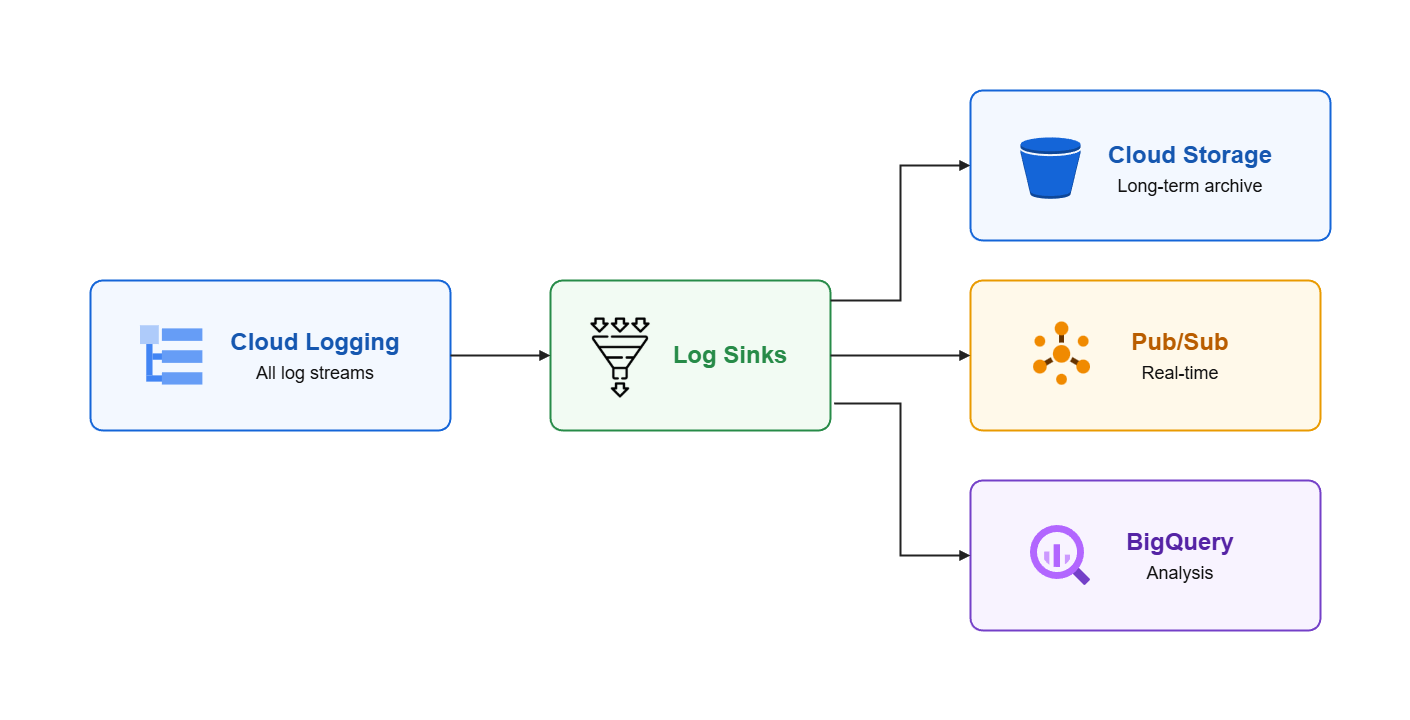
Google Cloud Logging can collect logs centrally and use log sinks to route selected logs to other services.
| Destination | Typical Purpose |
|---|---|
| Cloud Storage | Long-term archival, compliance retention, and low-cost storage |
| BigQuery | Log analysis, reporting, and audit queries |
| Pub/Sub | Real-time log processing, integrations, and alerting |
Log sinks allow different categories of logs to follow different retention and processing strategies instead of treating every log identically.
Compliance and Audit Logs
For regulated workloads, log retention may be a requirement rather than an operational preference.
Examples include:
| Industry | Example Requirement | Architectural Impact |
|---|---|---|
| Healthcare | HIPAA audit trails | Security and audit logs may require defined retention and protection |
| Finance | PCI DSS and SOX requirements | Transaction and audit records may require controlled retention |
| Government | FedRAMP requirements | Logging and retention requirements may be mandated |
These requirements can affect storage architecture, access controls, retention periods, and deletion policies.
Compliance requirements should therefore be identified during architecture design rather than after deployment.
Operational Value
Observability is not just for troubleshooting.
It helps teams:
- Detect failures before they create significant user impact.
- Follow requests across distributed services.
- Determine whether failures are isolated or widespread.
- Measure application behavior instead of relying only on infrastructure health.
- Connect technical metrics to business outcomes.
- Determine whether SLOs are being met.
- Reduce alert fatigue by focusing on actionable signals.
- Support incident investigation and root cause analysis.
- Meet audit and compliance requirements.
- Control logging and retention costs.
The main principle is simple: observability is designed in, not switched on after the fact.