Kibana Canvas
Overview
Kibana Canvas is a tool for creating dynamic, live infographic dashboards. It allows users to design visually rich presentations with real-time data.
- Similar to a PowerPoint presentation
- Can generate bar charts, plots, and other visualizations
Canvas can pull data from multiple sources for flexible and dynamic visualizations.
- Elasticsearch SQL queries – Retrieve data using SQL-like queries
- Timelion expressions – Perform time-series analysis and visualizations
- Raw documents – Use raw data directly from Elasticsearch
Components
Kibana Canvas consists of three main components:
-
Workpad
- A workspace where graphical representations are built
- Single page or multiple pages, similar to visualization panels
-
Pages
- Contain graphical elements that display data
- Allow organizing and structuring the presentation of data
-
Elements
- Charts – Area, bubble, coordinate, bar charts
- Shapes – Shapes and textboxes, formatted with Markdown
- Images – Static or dynamic images based on data
- Supporting Elements – Dropdown filters, time filters
Piping Functions
Kibana allows chaining functions by piping results, known as contexts, from one function to another for further processing.
Pre-requisites
This guide uses Elastic Cloud for the hosted Elasticsearch cluster and Kibana.
Importing the Data
We'll use an Nginx log file as our dataset. Download the files here:
First, we need to convert the log file into a format compatible with the Elasticsearch Bulk API. This can be done using awk:
awk '{print "{\"index\":{}}\n" $0}' nginx_json_logs > nginx_json_logs_bulk
Next, store the Elasticsearch endpoint and credentials in variables:
ELASTIC_ENDPOINT="https://your-elasticsearch-endpoint"
ELASTIC_USER="your-username"
ELASTIC_PW="your-password"
Create the index and define mappings, ensuring the Nginx timestamp is correctly formatted:
curl -s -u $ELASTIC_USER:$ELASTIC_PW \
-X PUT "$ELASTIC_ENDPOINT/nginx" \
-H "Content-Type: application/json" \
-d '{
  "settings": {
    "number_of_shards": 1,
    "number_of_replicas": 0
  },
  "mappings": {
    "properties": {
      "time": { "type": "date", "format": "dd/MMM/yyyy:HH:mm:ss Z" },
      "response": { "type": "keyword" }
    }
  }
}'
Finally, index the data using the Bulk API:
curl -s -u $ELASTIC_USER:$ELASTIC_PW \
-X POST "$ELASTIC_ENDPOINT/nginx/_bulk" \
-H "Content-Type: application/x-ndjson" \
--data-binary "@nginx_json_logs_bulk" | jq '.errors'
If there are no errors during indexing, it should return false.
Create the Canvas Workpad
Follow these steps to build a Canvas workpad in the Elastic console.
-
In the Elastic console, go to Analytics > Dashboard and click Create Workpad.
-
In the Workpad, click Add element > Shape.
-
On the right panel, set the Fill color to
#0b974d. -
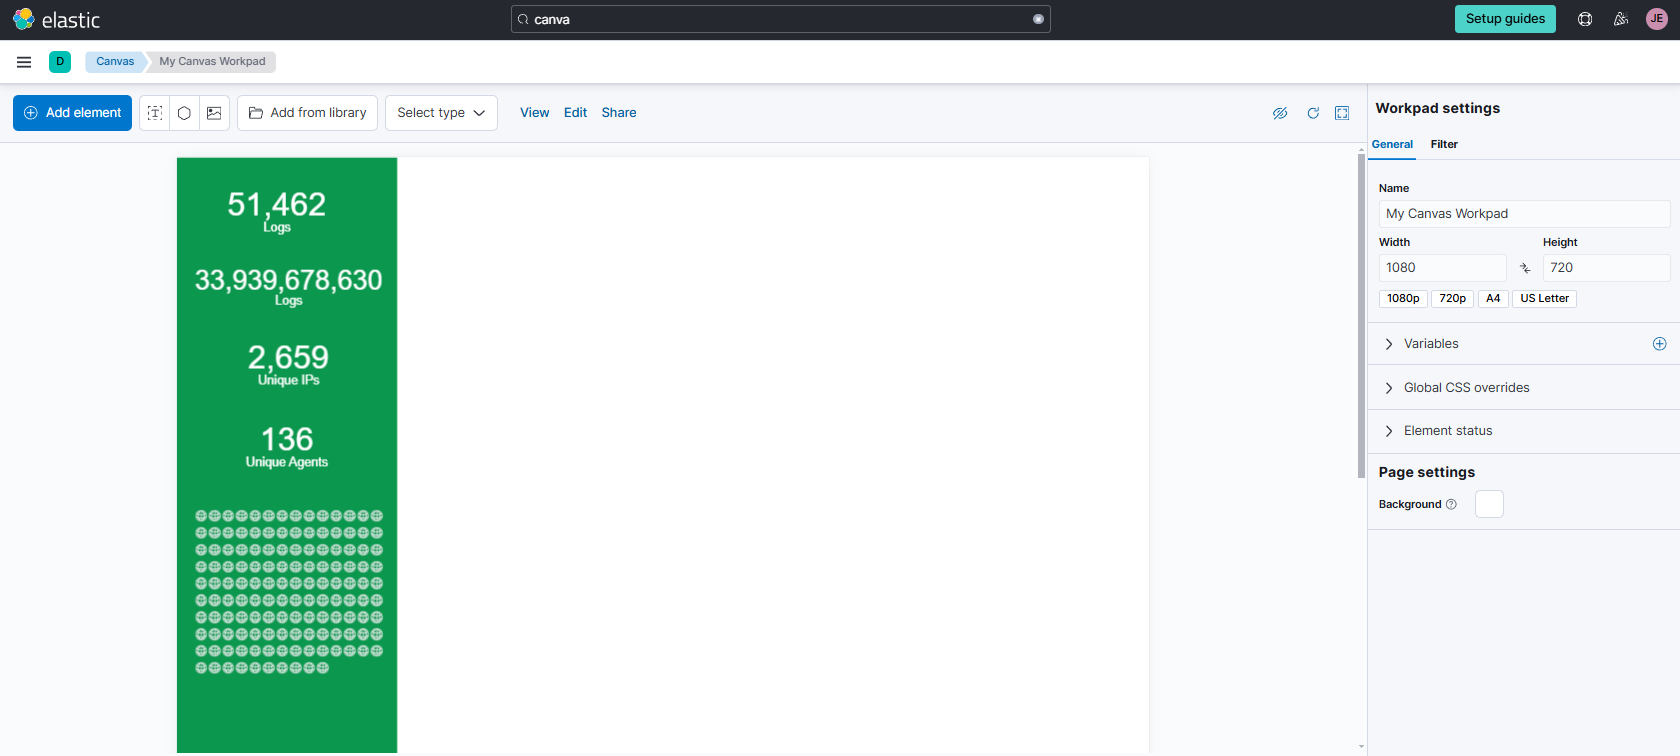
Click Add element again and select Chart > Metric.
-
Click the Data tab on the left, select Demo data > Elasticsearch SQL, and click Select.
-
Enter the following query and click Save:
SELECT COUNT(*) AS count_documents FROM nginx -
Click the Display tab and set:
- Value to
Valueandcount_documents - Label to
Logs
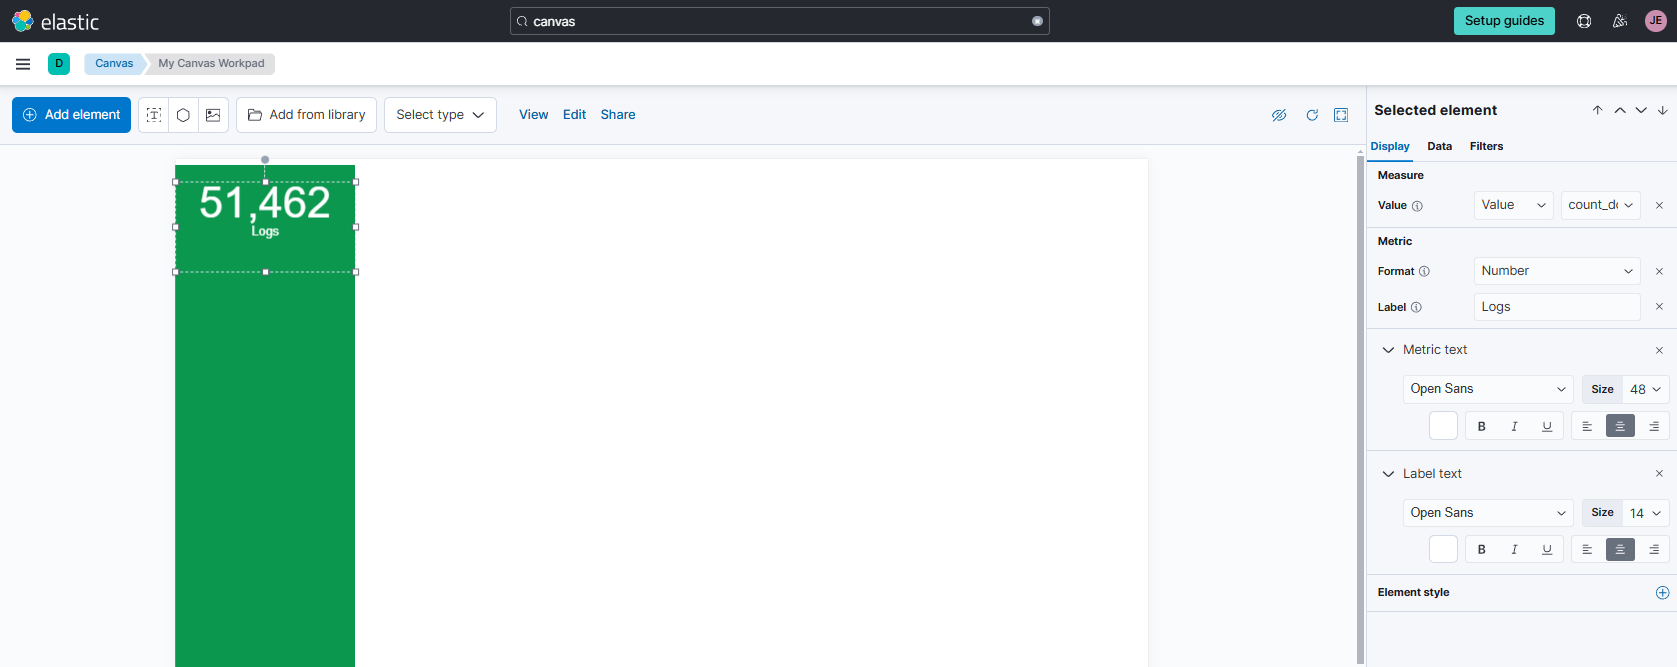
- Value to
-
Clone the metric element four times using
Ctrl+CandCtrl+V.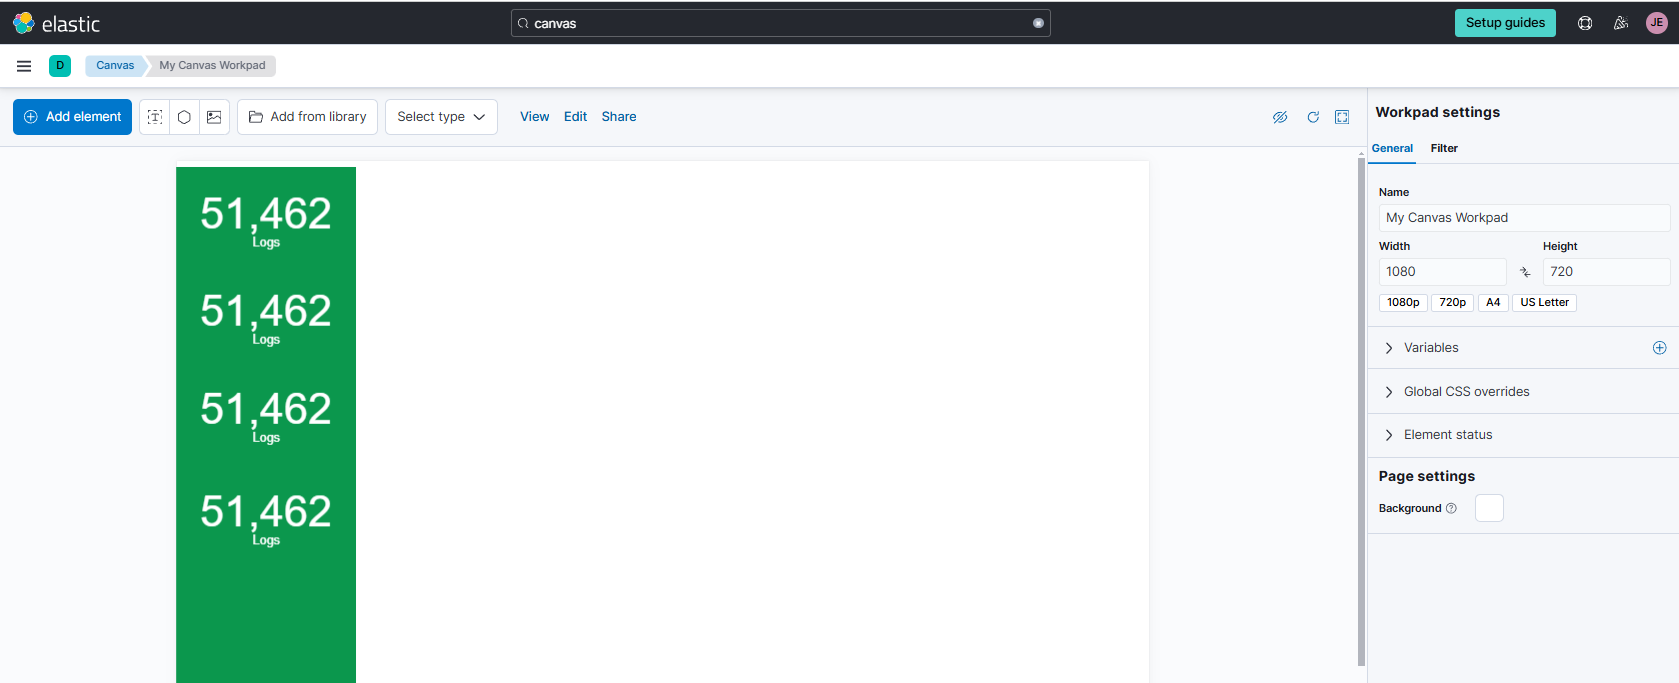
-
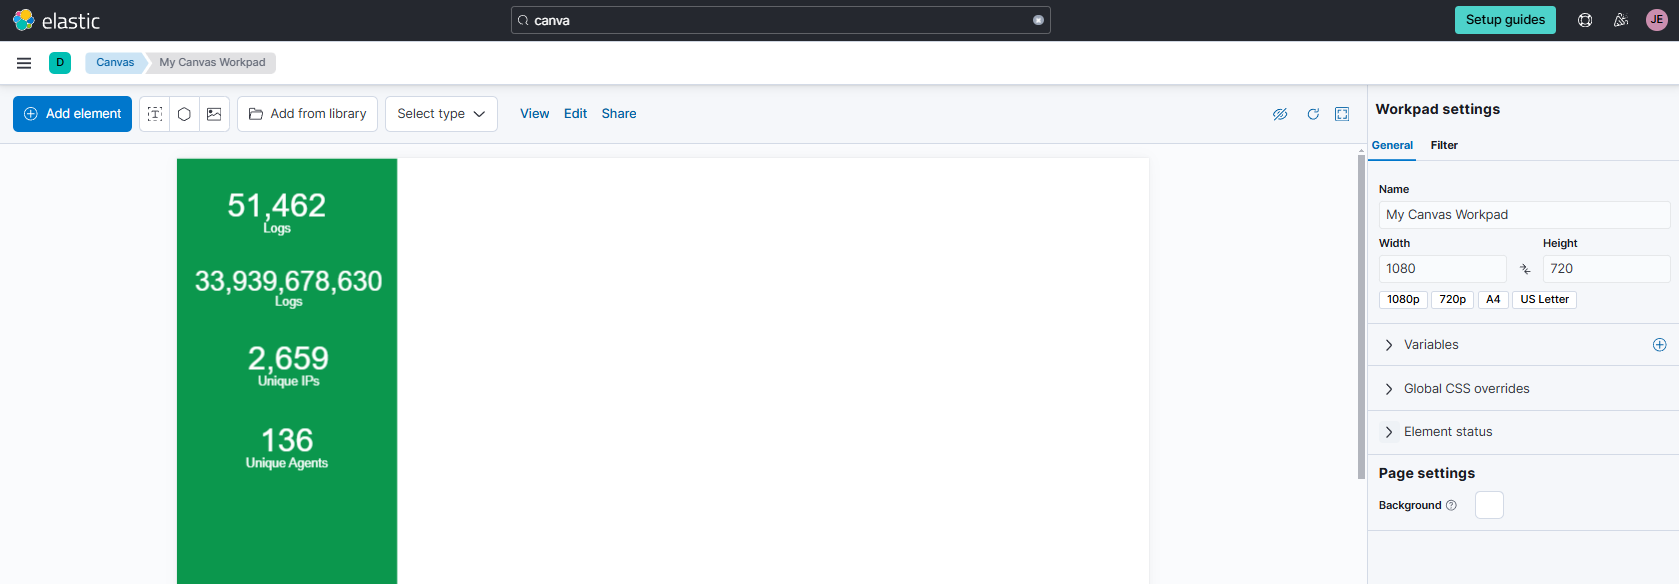
For the second metric, update the Data tab with the following query:
SELECT SUM(bytes) AS bytes FROM nginx- Set Value to
Valueandbytes - Set Label to
Bytes Transferred
- Set Value to
-
For the third metric, update the Data tab with this query:
SELECT COUNT(DISTINCT remote_ip) AS remote_ip FROM nginx- Set Value to
Valueandremote_ip - Set Label to
Unique IPs
- Set Value to
-
For the fourth metric, update the Data tab with this query:
SELECT COUNT(DISTINCT agent) AS agents FROM nginx- Set Value to
Valueandagents - Set Label to
Unique Agents
- Set Value to
-
Adjust the elements and their positions as needed.
-
Click Add element > Image > Image repeat.
-
In the Display tab, set Image size to
20. -
Click Import and select the desired icon.
infoYou can use any icon. For this example, download the agent icon here.
-
Update the Data tab with the following query:
SELECT COUNT(DISTINCT agent) AS agents FROM nginx- Adjust Value to
Valueandagents
- Adjust Value to
-
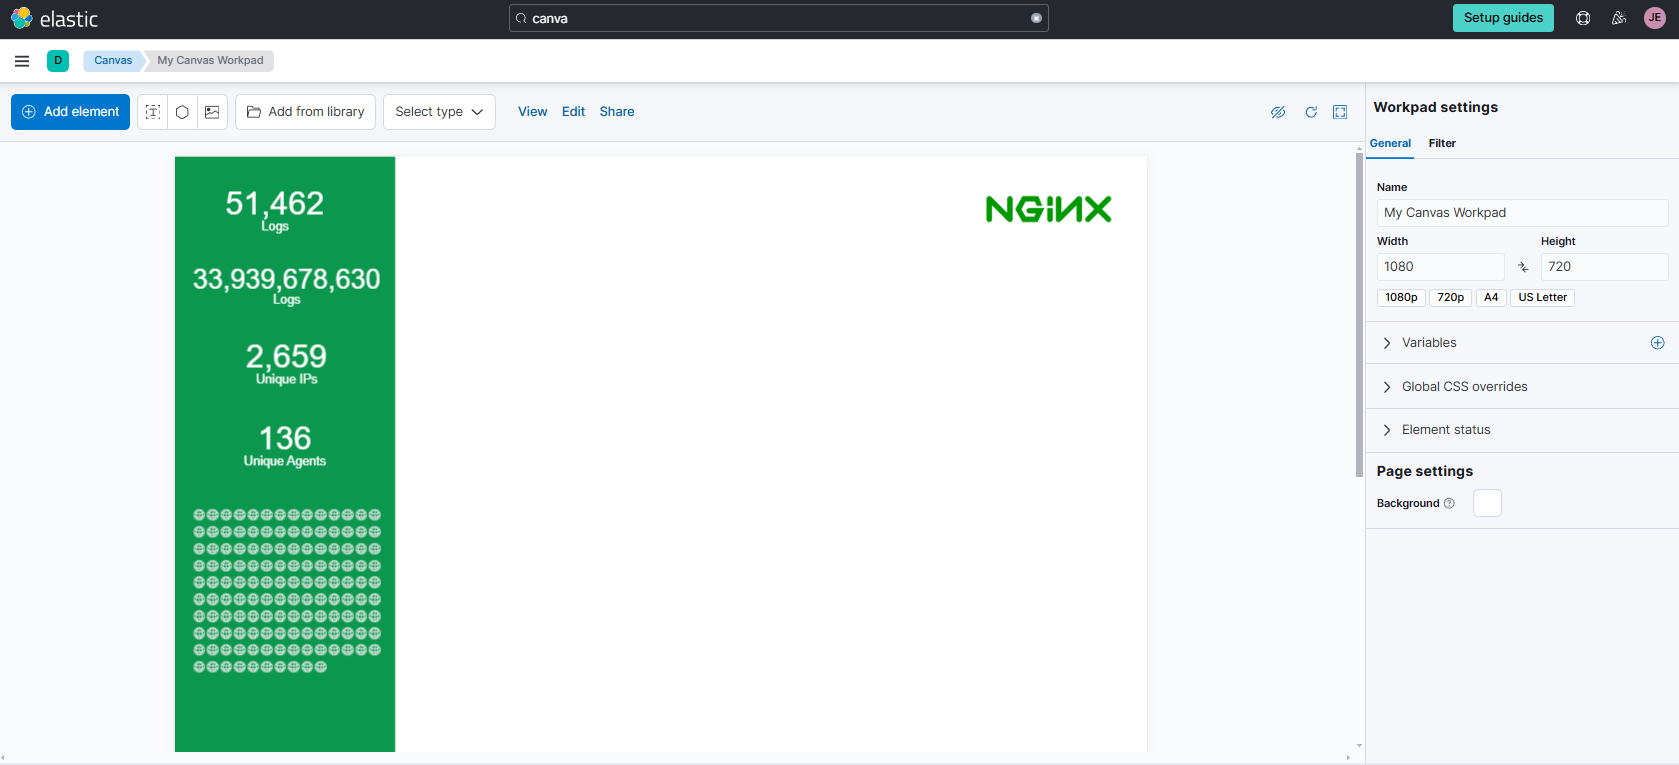
Add the NGINX logo:
- Click Add element > Image > Image
- In the Display tab, click Import and select the NGINX icon
infoDownload the NGINX logo here.
-
Click Add element > Text twice to create two text elements. Use the following markdown for each:
## REQUEST STATISTICS - NUMBER OF REQUESTS## TOP 5 IP ADDRESSES - TRANSFERRED BYTES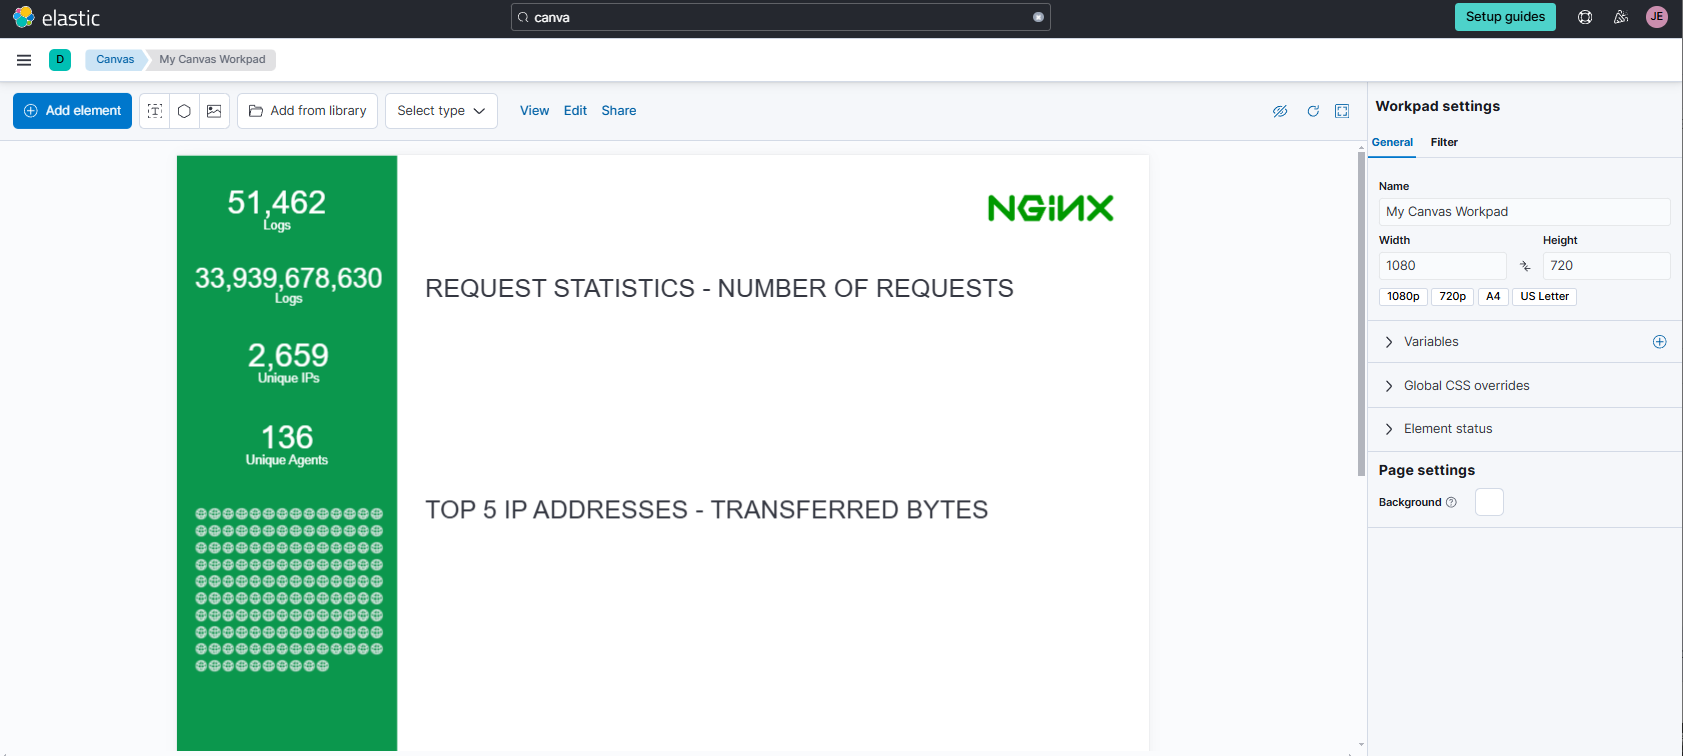
-
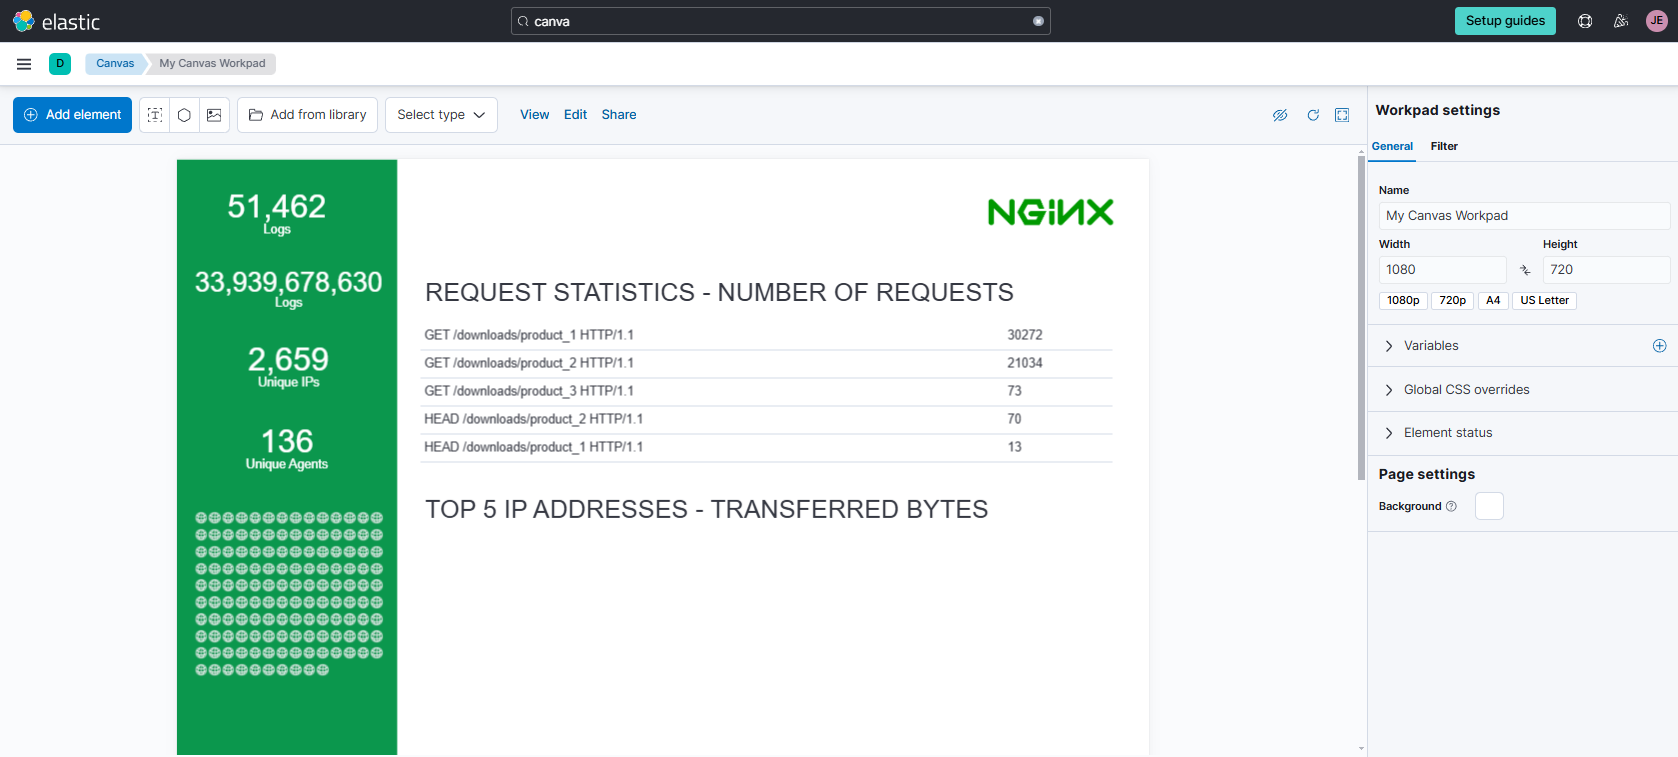
Add a data table:
-
Click Add element > Chart > Data table
-
In the Data tab, use the following query:
SELECT request, COUNT(*) AS count_requestsFROM nginxGROUP BY requestORDER BY count_requests DESC -
In the Display tab, untoggle Show pagination controls
-
Untoggle Show the header row
-
-
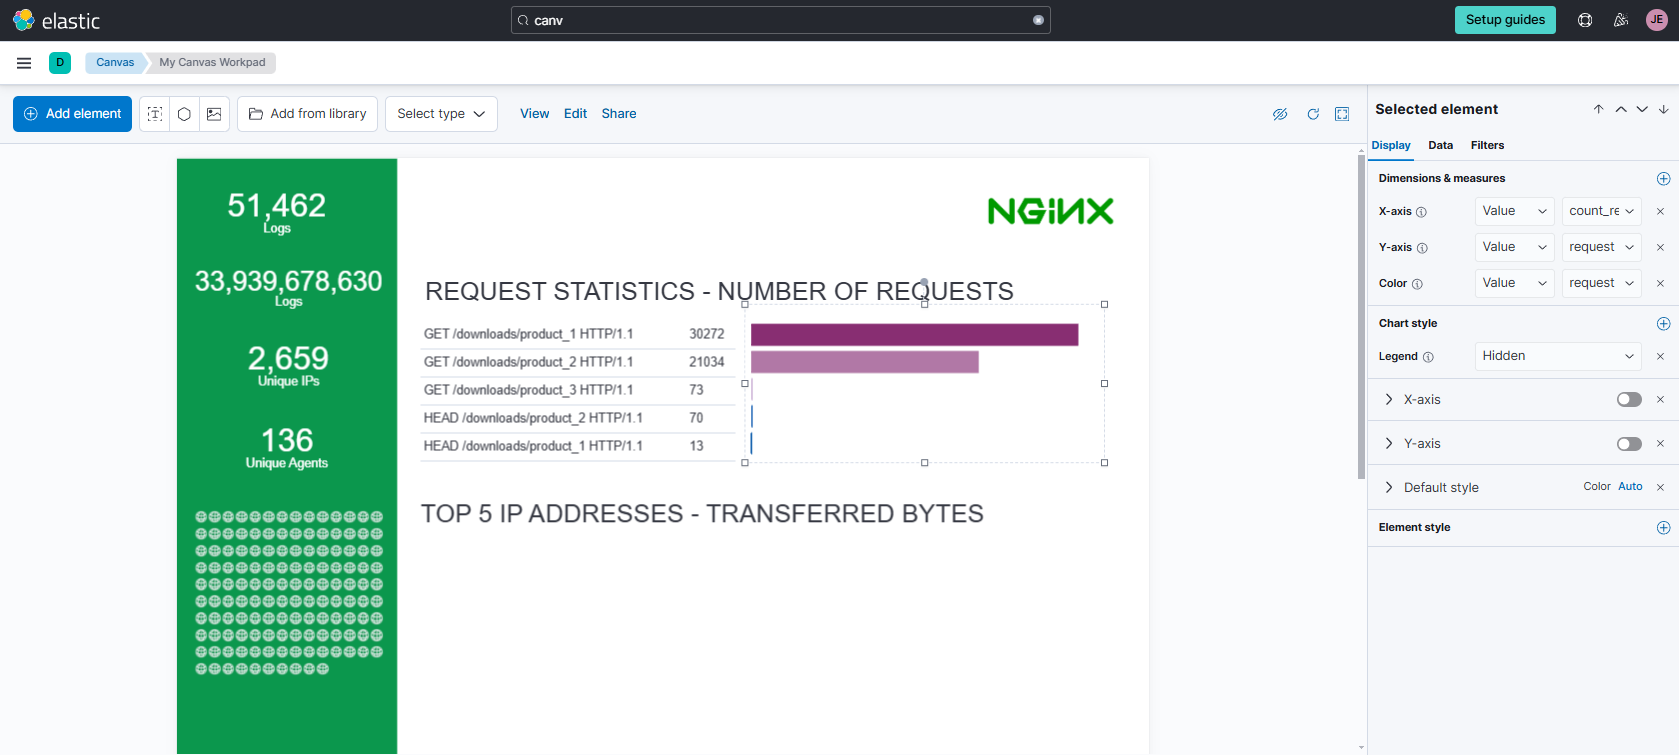
Add a bar chart:
- Click Add element > Chart > Horizontal bar and place it next to the data table
- In the Data tab, use the same query as the data table
- Configure the Display settings as shown below
-
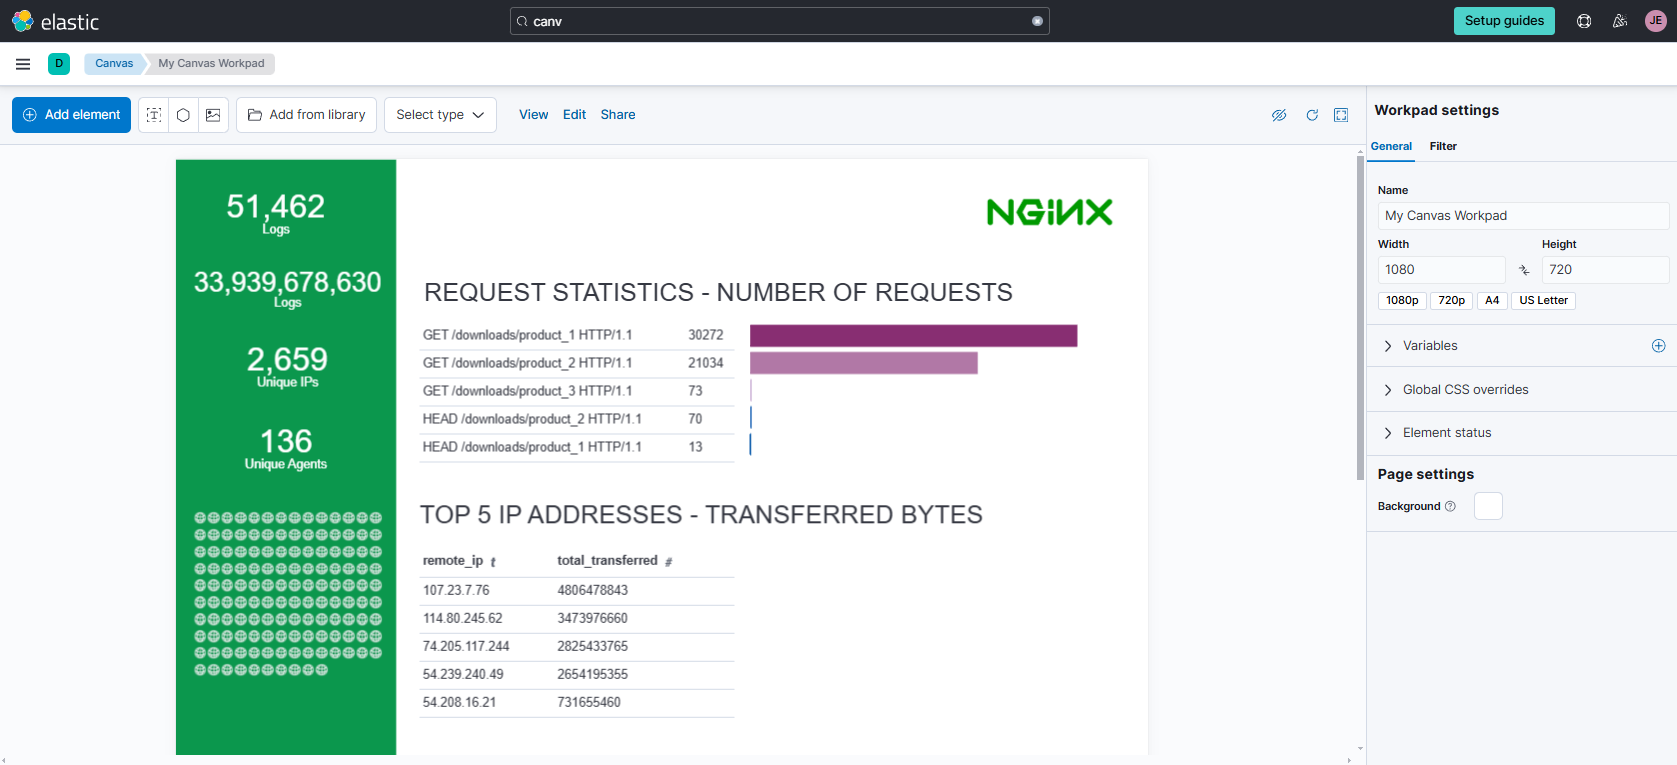
Add another data table below the second text element:
-
Click Add element > Chart > Data table
-
In the Data tab, use the following query:
SELECT remote_ip, SUM(bytes) AS total_transferredFROM nginxGROUP BY remote_ipORDER BY total_transferred DESC NULLS LAST LIMIT 5 -
In the Display tab, untoggle Show pagination controls
-
Untoggle Show the header row
-
-
Add a gauge chart next to this data table:
-
Click Add element > Progress > Gauge
-
Open the Expression Editor and enter the following expression, then click Run
filters| essqlquery="SELECT SUM(bytes) AS total_transferred_5FROM nginxGROUP BY remote_ipORDER BY total_transferred_5 DESC NULLS LAST LIMIT 5"| math {string "sum(total_transferred_5)/" {filters | essql query="SELECT SUM(bytes) AS total_transferredFROM nginxGROUP BY remote_ipORDER BY total_transferred DESC NULLS LAST"| math "sum(total_transferred)"}}| progress shape="gauge" label={formatnumber "0%"}font={font size=24 family="'Open Sans', Helvetica, Arial, sans-serif" color="#000000" align="center"}| render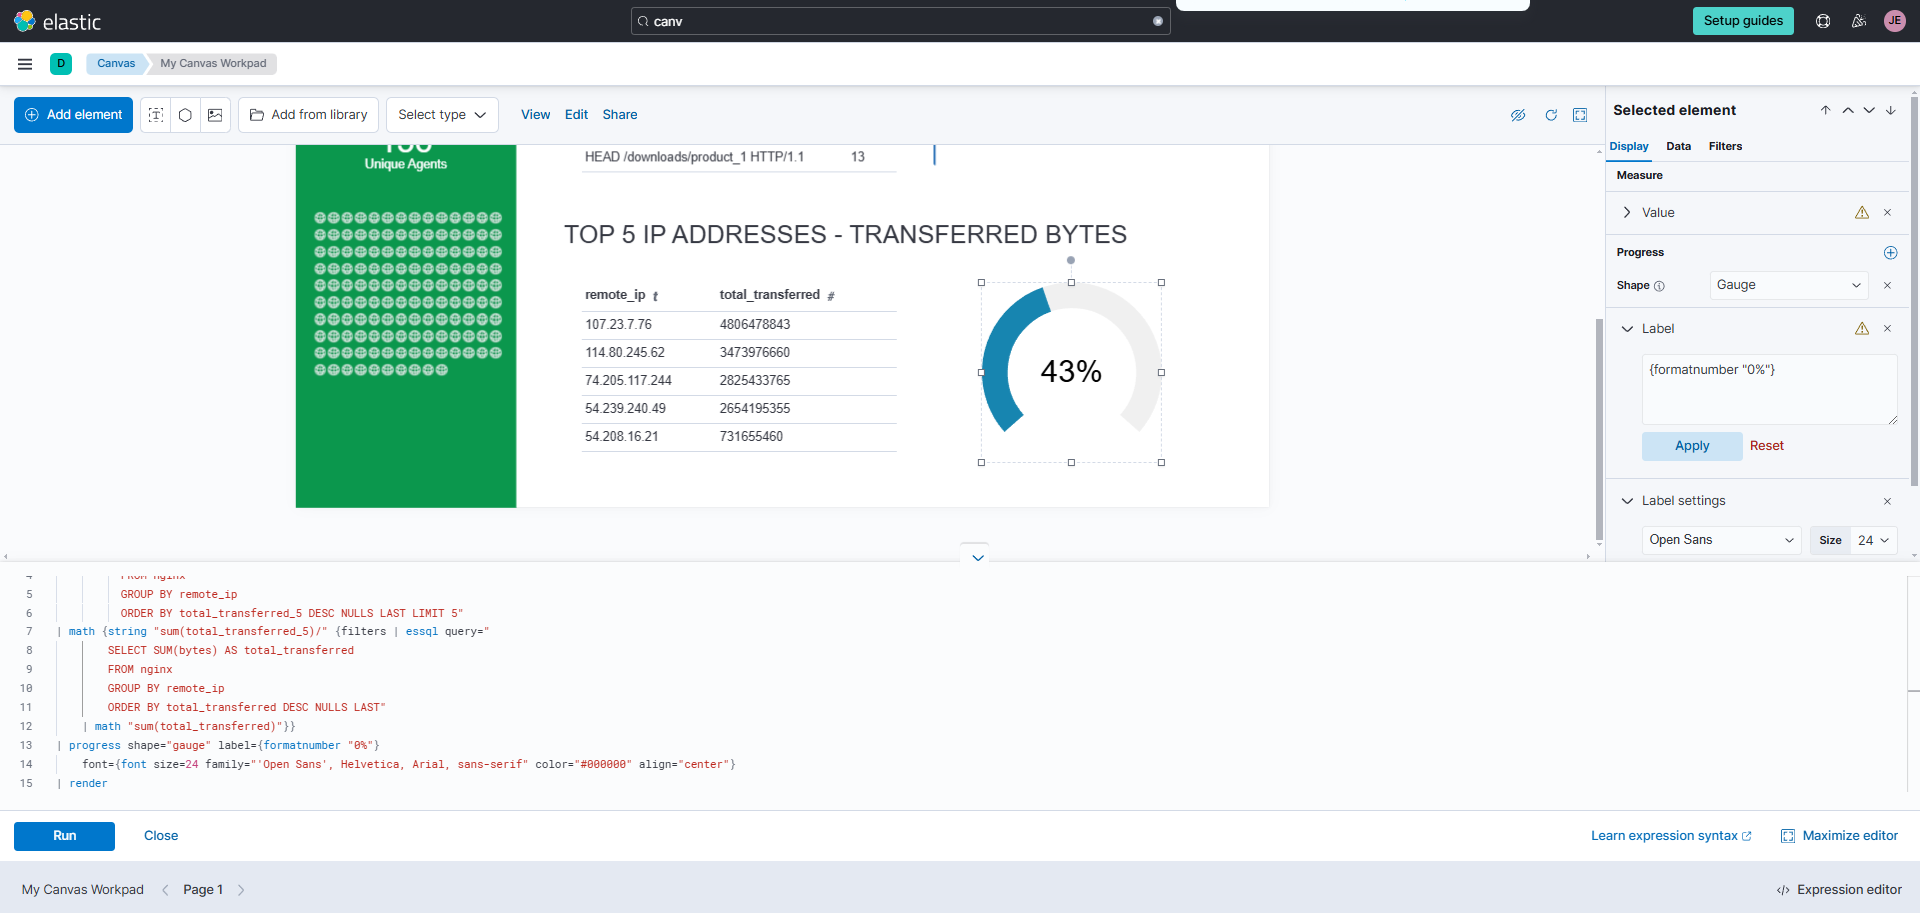
-
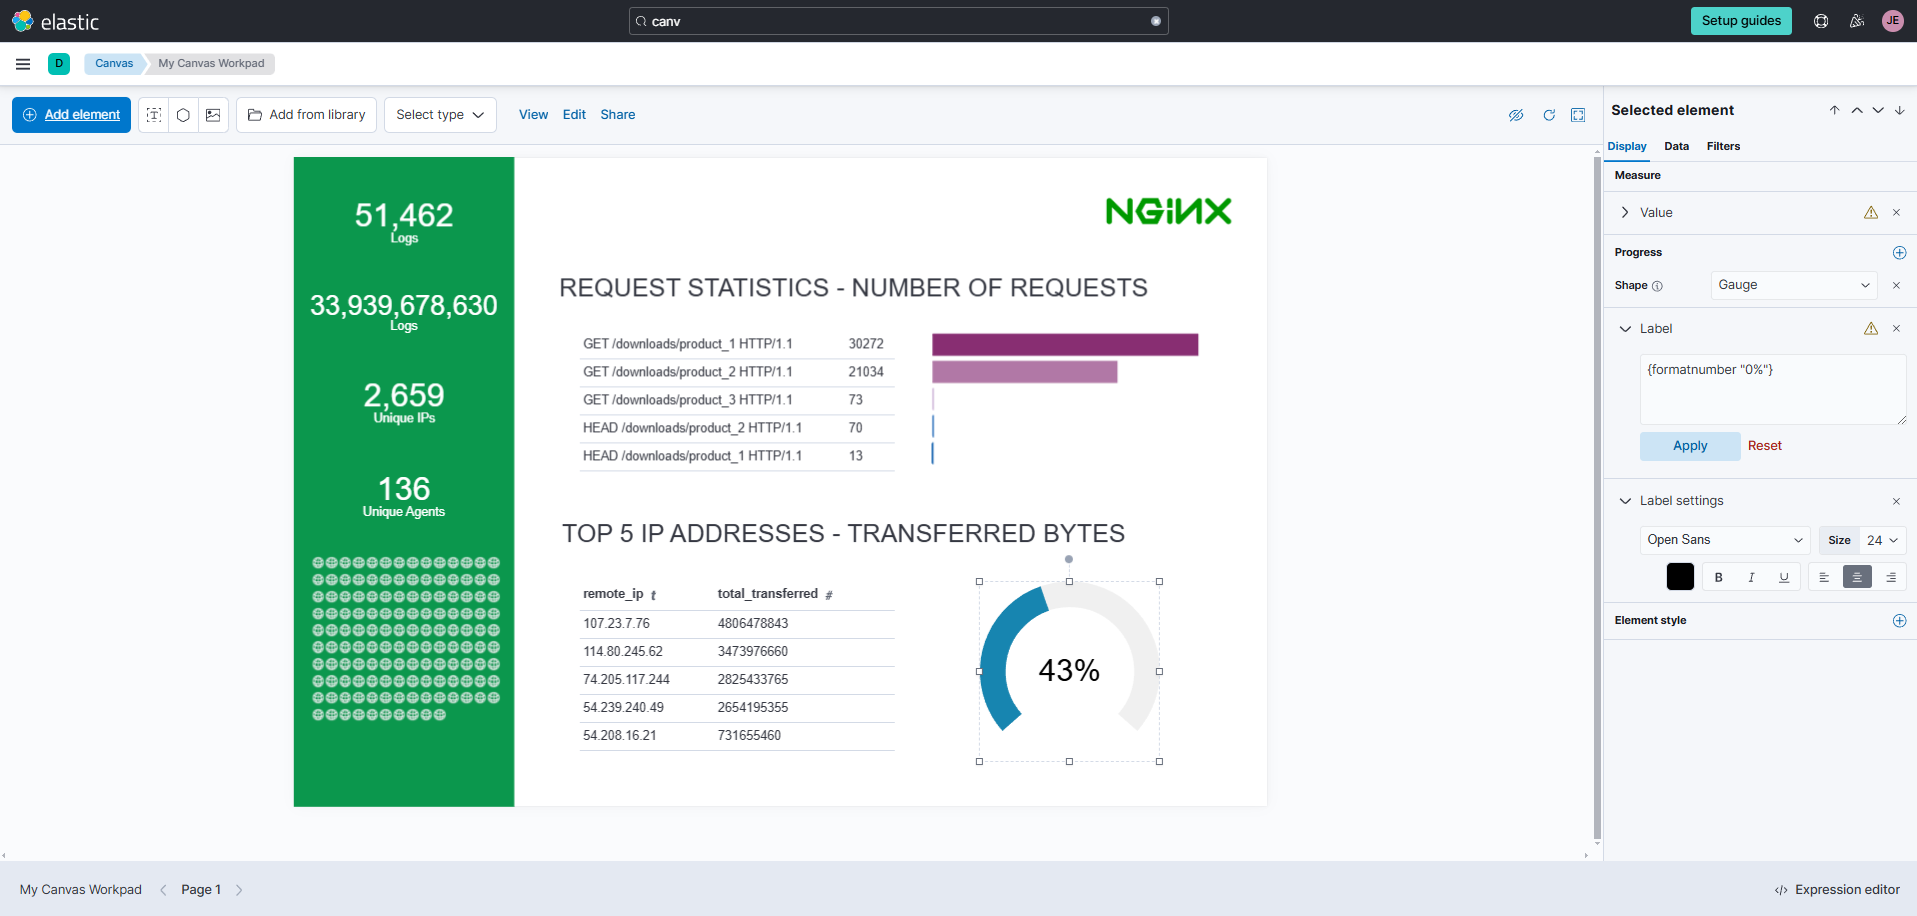
-
Adjust positions and colors as needed. The final workpad should provide a dynamic visualization of your data.
Cleanup
-
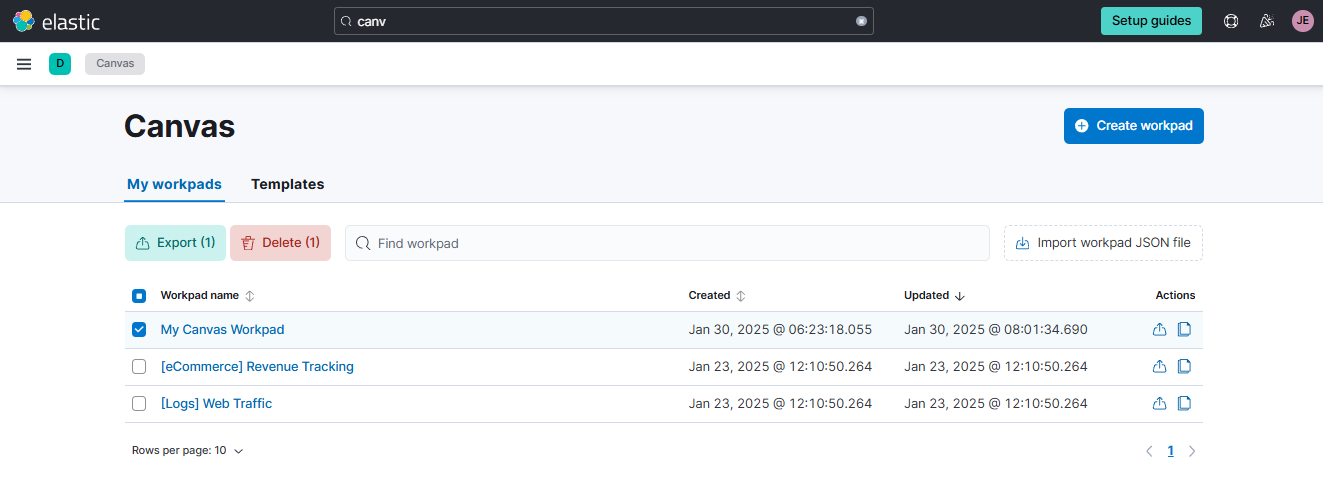
To delete the Workpad, go to Canvas, select your workpad, and click Delete.
-
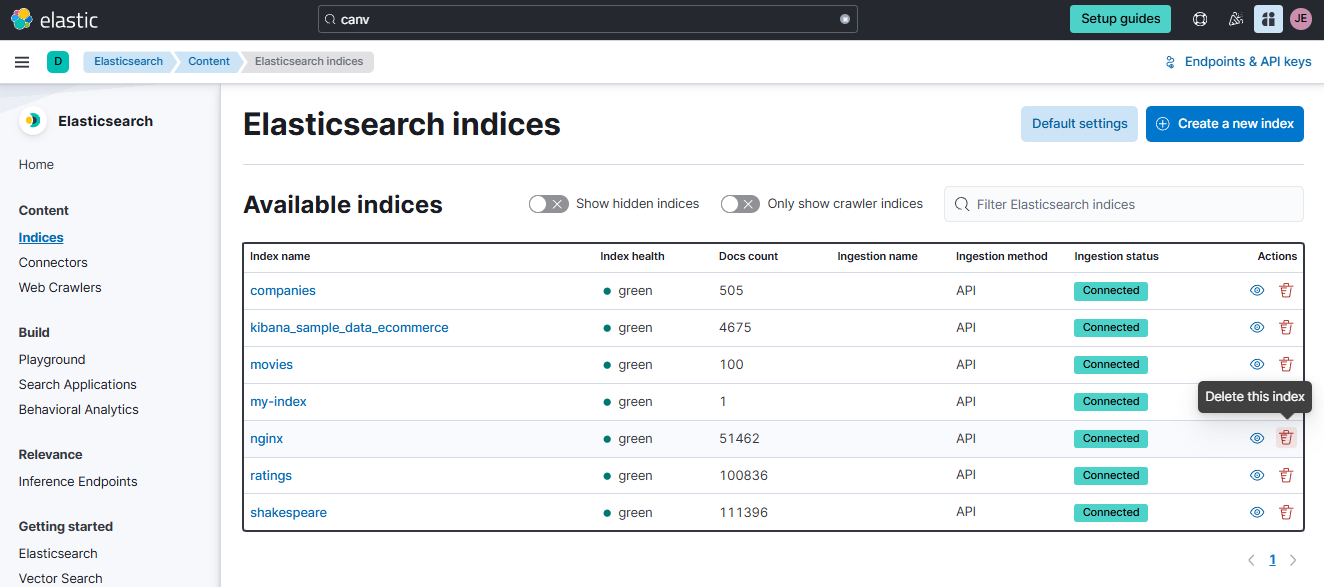
To delete the
nginxindex, go to Elasticsearch > Indices, find the index, and click the delete icon.