Kibana Lens
Overview
This guide explains how to use Kibana Lens to monitor and visualize EC2 performance under stress.
- Install Metricbeat on a Linux EC2 instance
- Connect Metricbeat to an Elastic Cloud deployment
- Run a stress test on the EC2 instance
- Create visualizations for EC2 metrics in Kibana Lens
Pre-requisites
This guide uses Elastic Cloud for the hosted Elasticsearch cluster and Kibana.
You can use either a cloud-based instance or a local virtual machine for the Linux setup.
Install Metricbeat
Login to your EC2 instance and perform the following.
-
Verify your VM can connect to the Elastic endpoint:
curl -u elastic:add-password-here -XGET https://add-elastic-endpoint-here:443If successful, you’ll see a JSON response with Elasticsearch details.
{"name" : "instance-0000000000","cluster_name" : "dfkhsfkjhdfksdkfjshdfkhsdfkjh","cluster_uuid" : "QMwQk4tIQyidcGrNoJyp0A","version" : {"number" : "8.17.1","build_flavor" : "default","build_type" : "docker","build_hash" : "fldjkajdflkajklsdjflkjdasflkajlkjalkdsjas","build_date" : "2023-01-10T10:08:26.972230187Z","build_snapshot" : false,"lucene_version" : "9.12.0","minimum_wire_compatibility_version" : "7.17.0","minimum_index_compatibility_version" : "7.0.0"},"tagline" : "You Know, for Search"} -
Install Metricbeat based on your operating system. More about it here.
For Ubuntu, use:
curl -L -O https://artifacts.elastic.co/downloads/beats/metricbeat/metricbeat-8.17.1-amd64.debsudo dpkg -i metricbeat-8.17.1-amd64.deb -
Modify the
metricbeat.yml.sudo vi /etc/metricbeat/metricbeat.ymlSpecify the
cloud.idof your Elasticsearch Service, and setcloud.authto a user who is authorized to set up Metricbeat.cloud.id: "environment:xxxxxxxxxxxxxxxxxx"cloud.auth: "elastic:YOUR_PASSWORD"infoNote: Avoid hardcoding passwords. Use the secrets keystore for sensitive values.
-
Identify the modules you need to enable.
metricbeat modules listMetricbeat uses modules to collect metrics. Each module defines the basic logic for collecting data from a specific service, such as Redis or MySQL. A module consists of metricsets that fetch and structure the data. If you accept the default configuration without enabling additional modules, Metricbeat collects system metrics only.
Enable the Linux module.
metricbeat modules enable linux -
Metricbeat comes with predefined assets for parsing, indexing, and visualizing your data. To load these assets:
metricbeat setup -einfoMake sure to setup the Elasticsearch endpoint and credentials in the configuration file (see step 3).
If successful, you should see:
Loading dashboards (Kibana must be running and reachable){"log.level":"info","@timestamp":"2023-01-26T13:21:27.495Z","log.logger":"kibana","log.origin":{"function":"github.com/elastic/elastic-agent-libs/kibana.NewClientWithConfigDefault","file.name":"kibana/client.go","file.line":181},"message":"Kibana url: https://12345678asdfghjkkl.asia-southeast1.gcp.elastic-cloud.com:443","service.name":"metricbeat","ecs.version":"1.6.0"}{"log.level":"info","@timestamp":"2023-01-26T13:21:28.523Z","log.logger":"kibana","log.origin":{"function":"github.com/elastic/elastic-agent-libs/kibana.NewClientWithConfigDefault","file.name":"kibana/client.go","file.line":181},"message":"Kibana url: https://12345678asdfghjkkl.asia-southeast1.gcp.elastic-cloud.com:443","service.name":"metricbeat","ecs.version":"1.6.0"}{"log.level":"info","@timestamp":"2023-01-26T13:23:30.849Z","log.origin":{"function":"github.com/elastic/beats/v7/libbeat/cmd/instance.(*Beat).loadDashboards","file.name":"instance/beat.go","file.line":1306},"message":"Kibana dashboards successfully loaded.","service.name":"metricbeat","ecs.version":"1.6.0"}Loaded dashboards -
Enable and start Metricbeat.
sudo systemctl enable --now metricbeatsudo systemctl status metricbeat
Run Load Testing
To generate system metrics, use the stress tool:
-
Install the stress tool.
sudo apt install -y stress -
Before running the test, check your system resources.
Find the number of CPU cores of your virtual machine:
nprocCheck available memory:
free -hFor example, if 2 GB of memory is free, you can allocate it during testing.
total used free shared buff/cache availableMem: 3.8Gi 284Mi 2.0Gi 0.0Ki 1.5Gi 3.3GiSwap: 0B 0B 0B -
Run the load tests.
The first load will spin up a worker that will max out the CPU core for 2 minutes
stress --cpu 1 --timeout 120Next, use 5 workers to consume 256 MB of memory each for 3 minutes:
stress --vm 5 --timeout 160
Visualize Top Processes
-
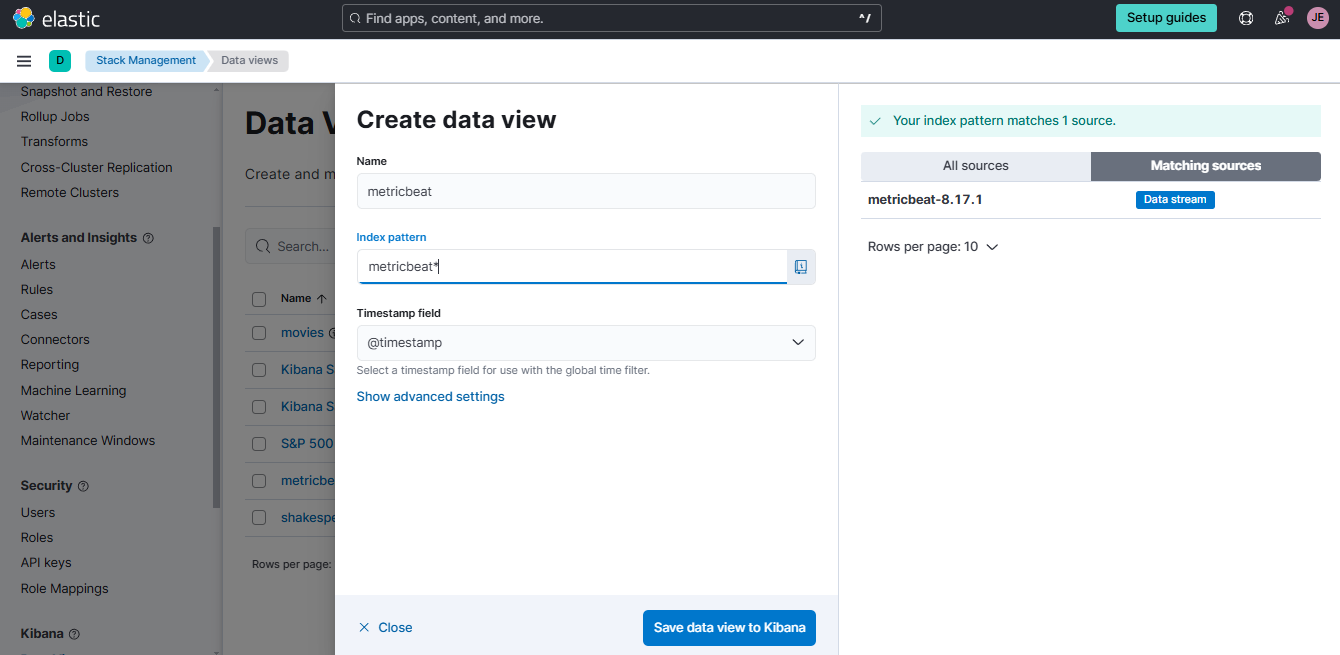
Login to your ELastic Cloud account and go to Stack Management > Kibana > Data Views > Create data view. Use the details below and click Save data view in Kibana.
-
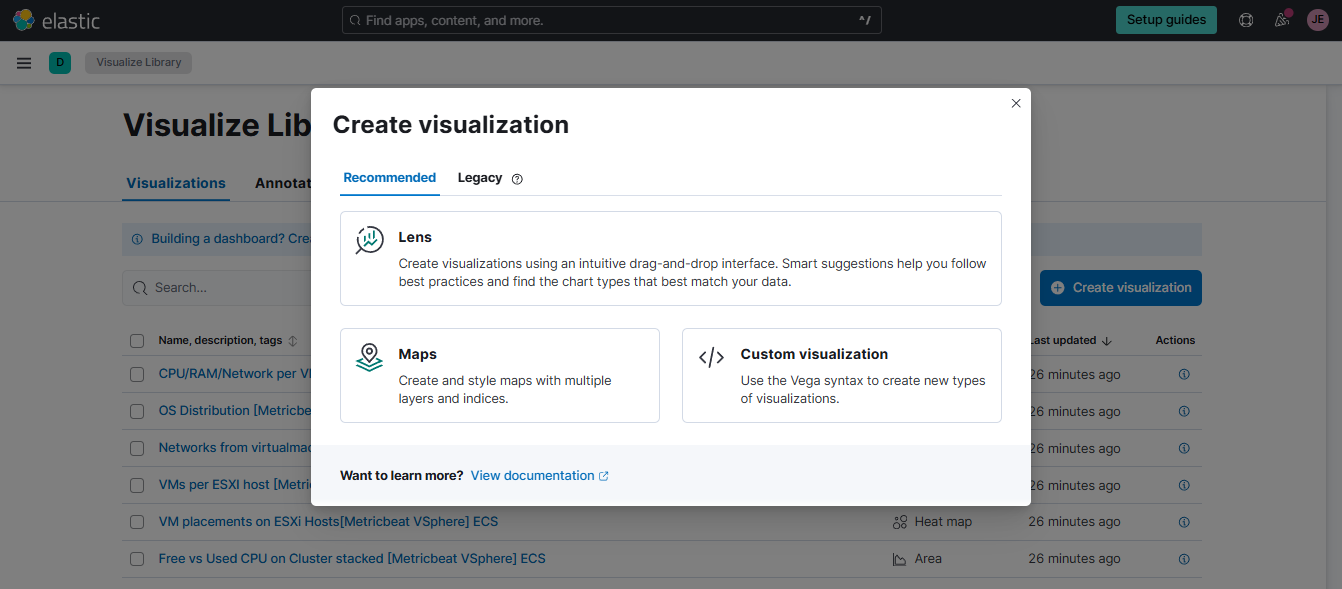
Go to Analytics > Visualize Library > Create new visualization > Select Lens.
-
Set the data view at the upper left to
metricbeat. In the search bar below it, look forprocess.cpu.total.pctand drag it to the main area at the middle. Set the vertical axis to useMaximum, as shown below.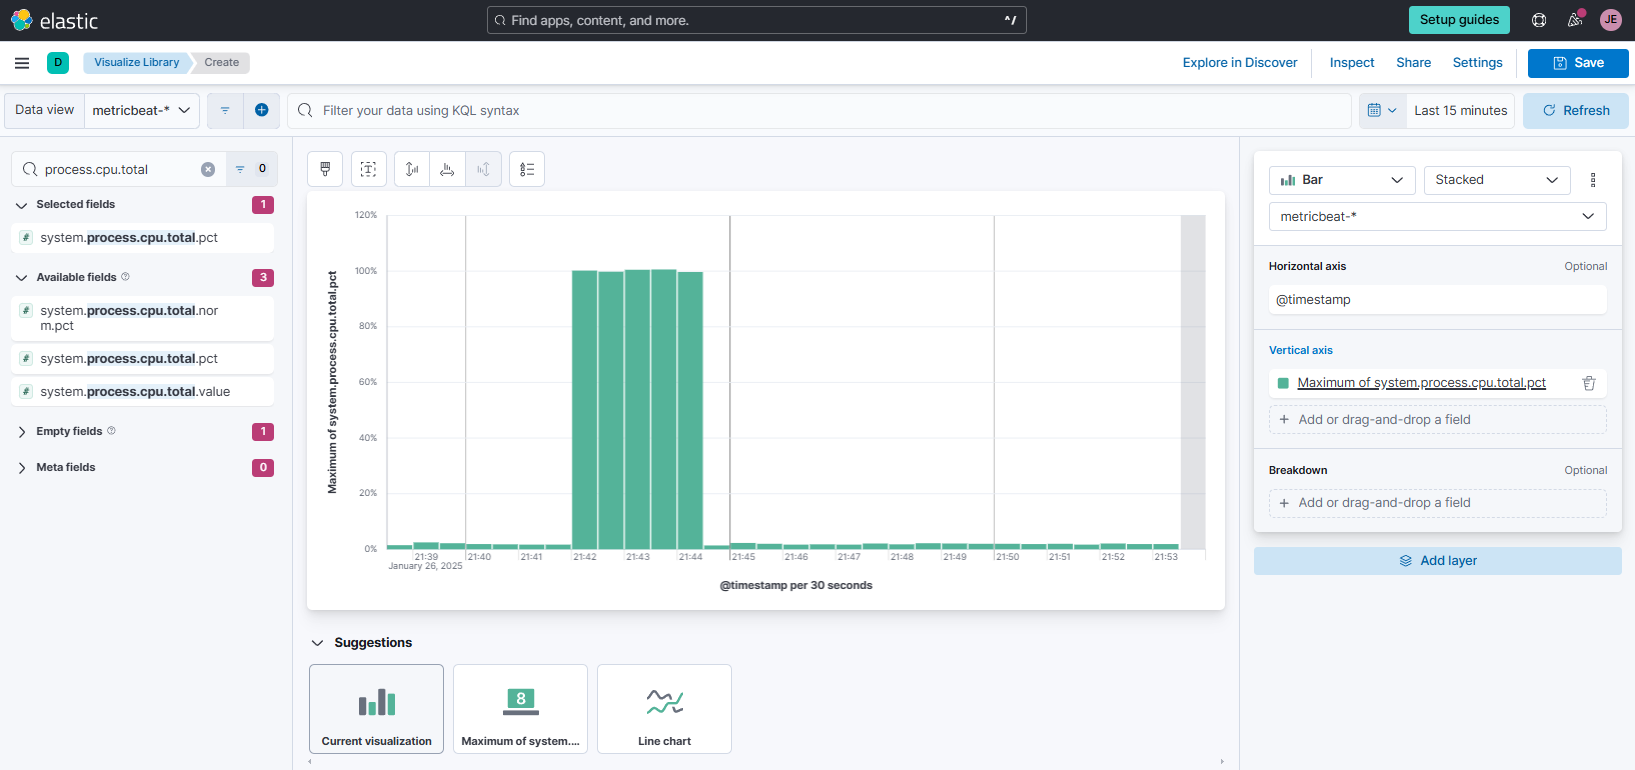
-
On the left search bar, look for
process.executableand drag it to the main area. Then set the timeframe on the upper right ot 15 minutes. Finally, click Breakdown and set the number of values to 10.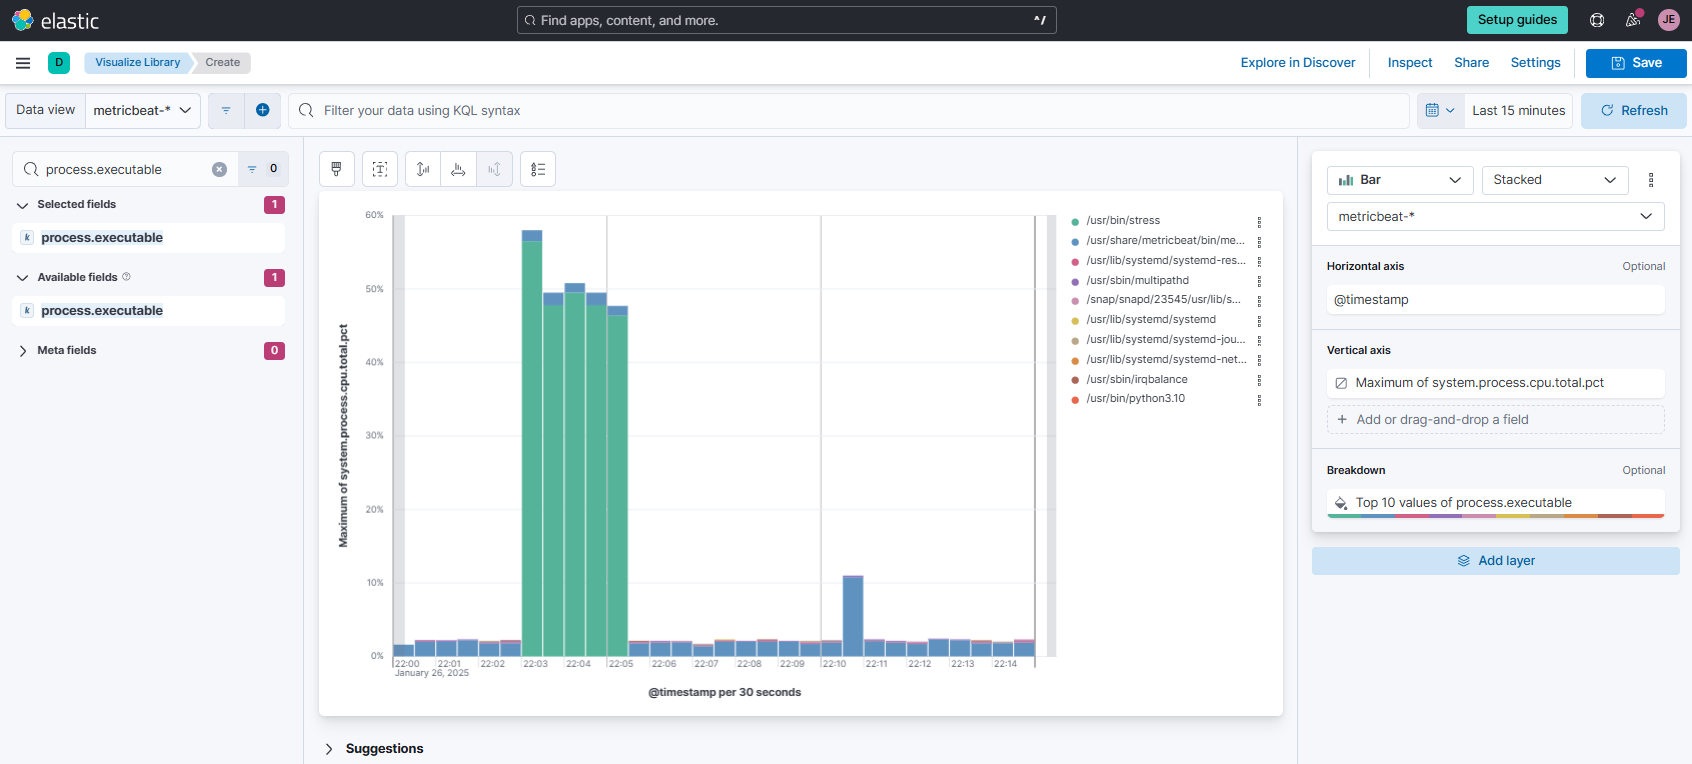
-
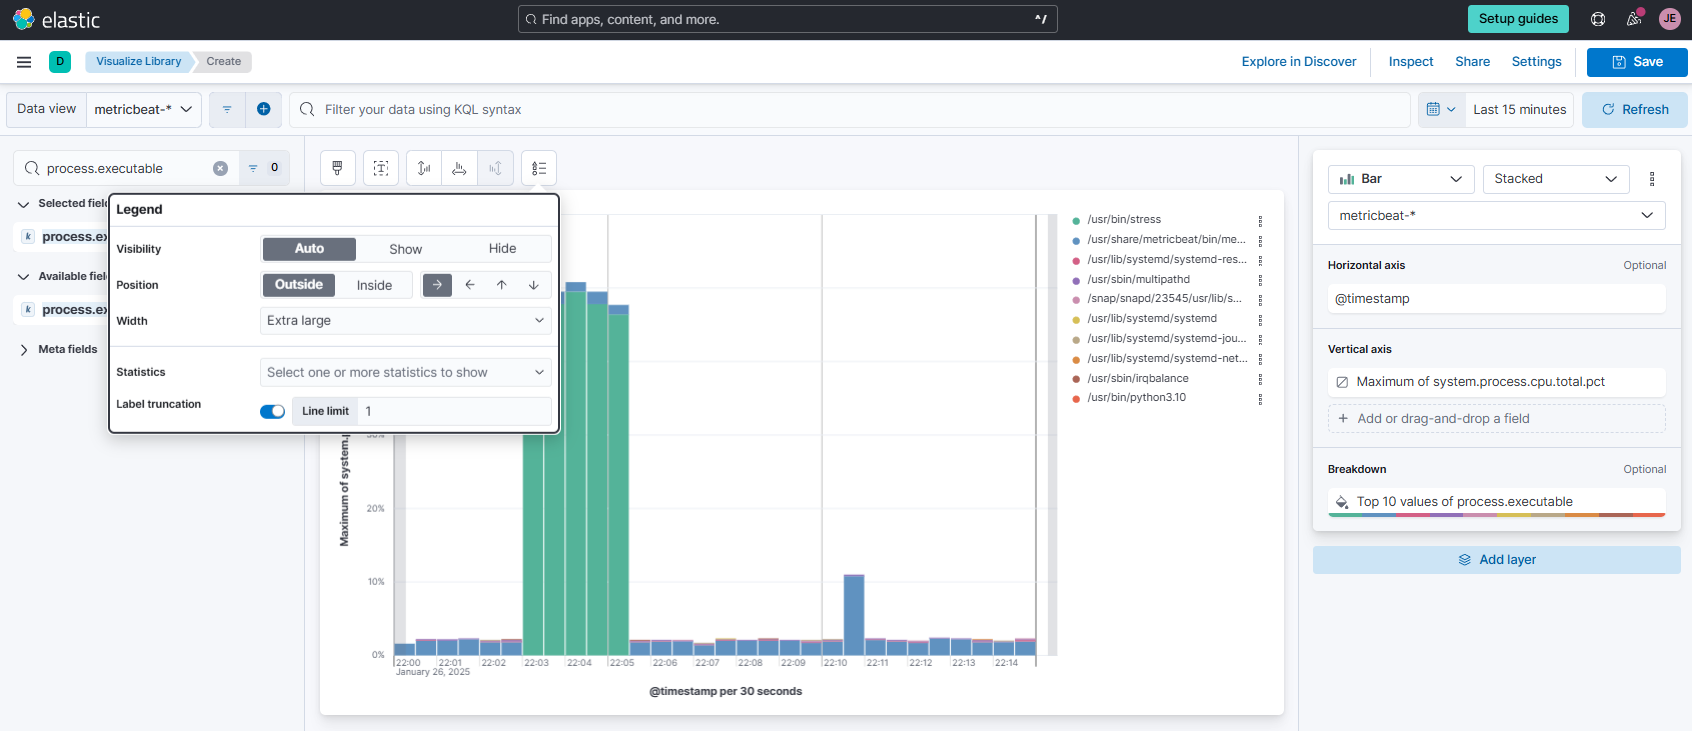
Click the Legend tab and modify the settings.
-
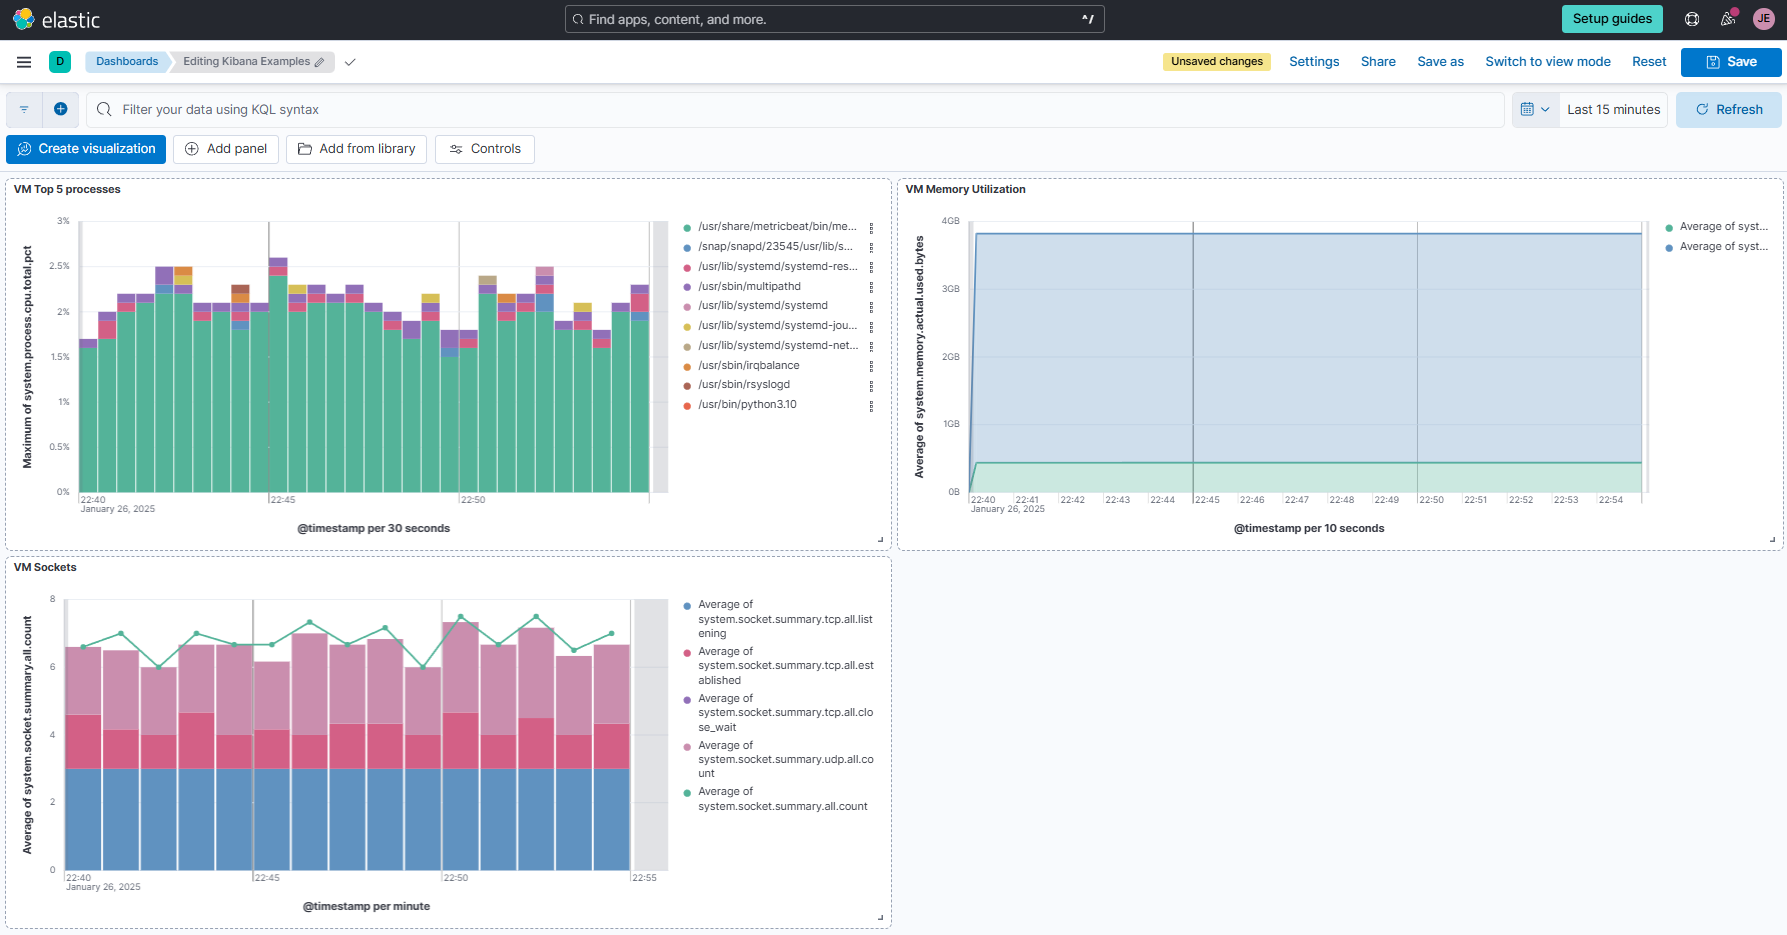
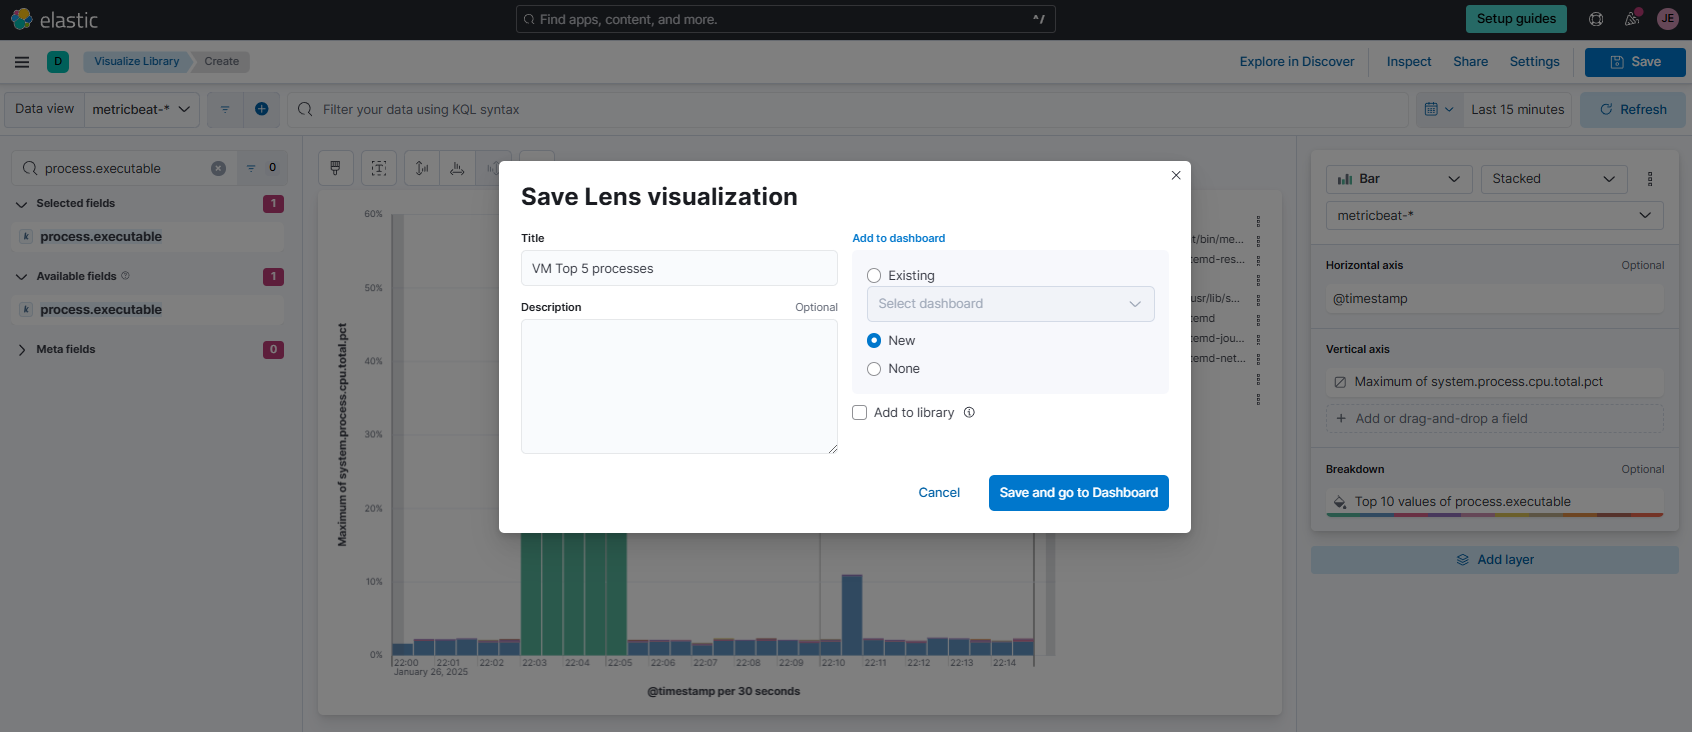
Click Save on the upper right corner and enter "VM Top 5 processes" as the name. Select new for Dashboard and click Save and go to Dashboard.
-
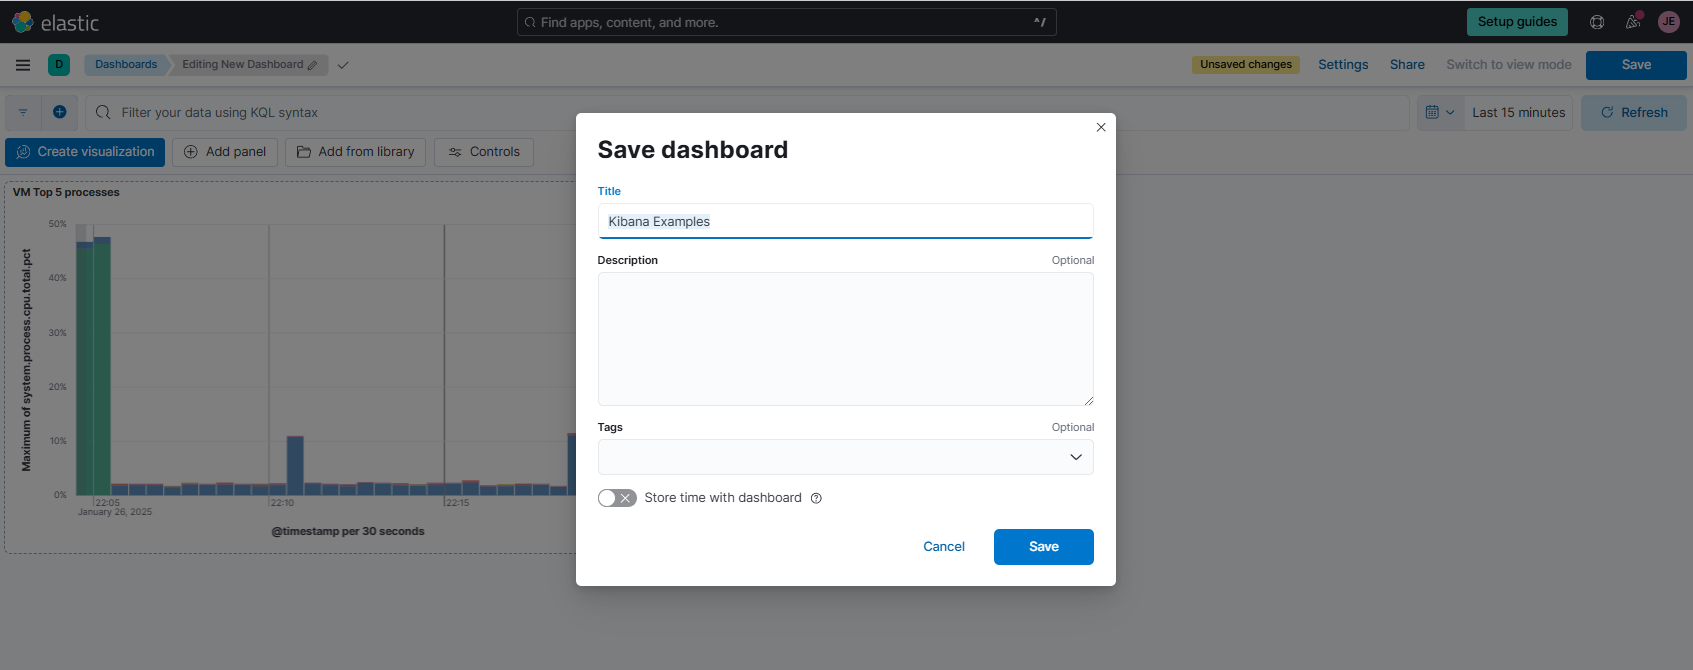
To save the dashboard, click Save and enter "Kibana Examples" as the dashbaord name. Click Save.
Visualize Memory
-
Click Create new visualization > Select Lens again. Make sure the data view is set to
metricbeat. In the search bar below it, look formemory.actual.used.bytesandmemory.actual.free, and drag both to the main area at the middle.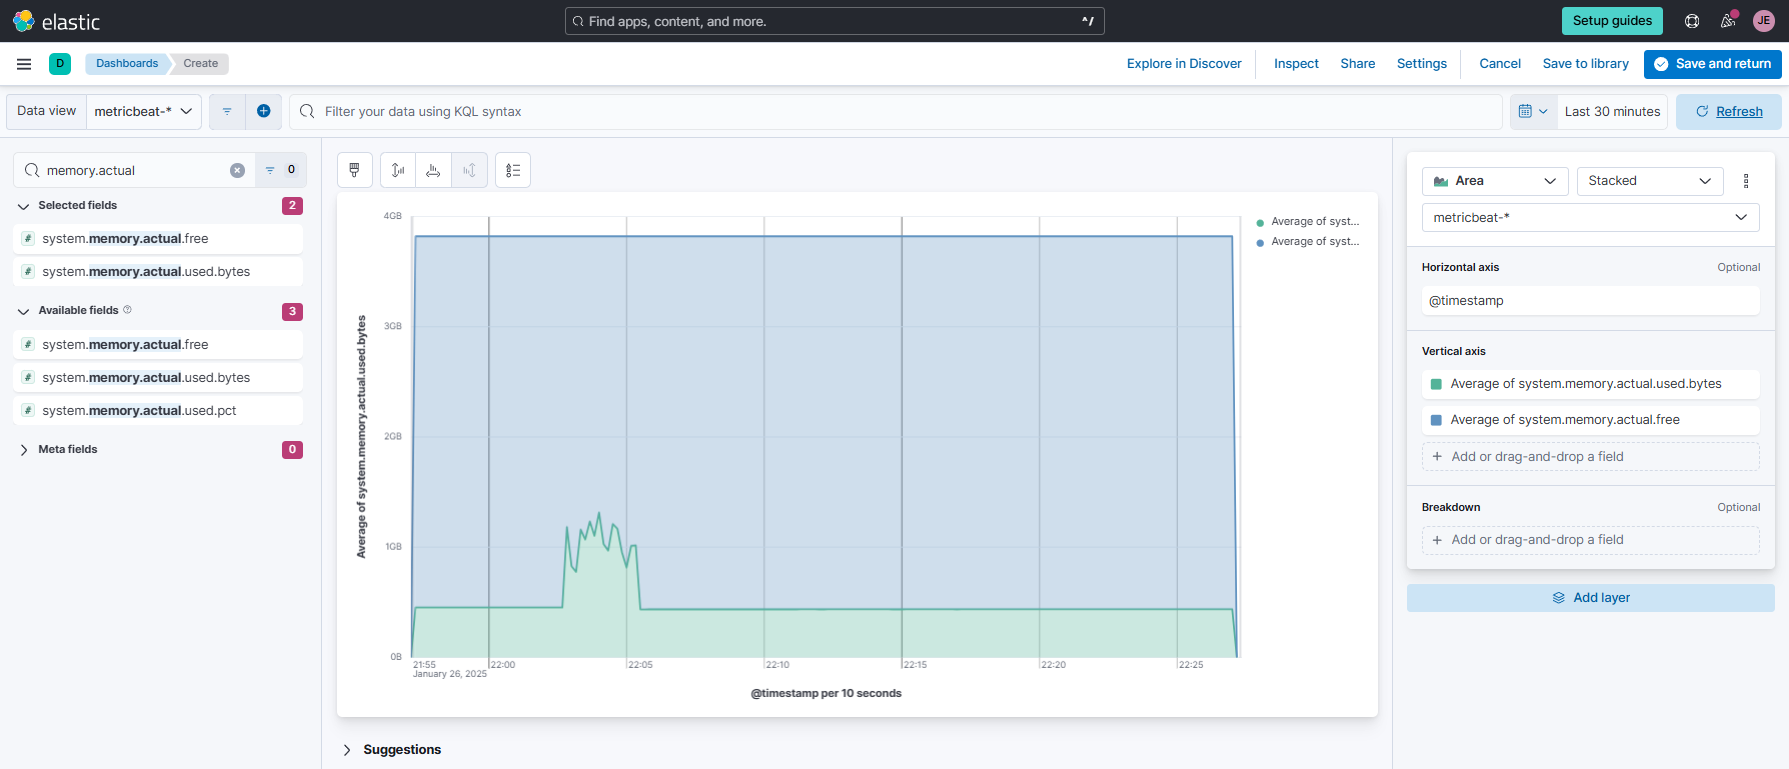
-
Set the vertical axis to use
Averagefor both metrics. Click@timestampunderHorizontal axisand set Minimum interval to10s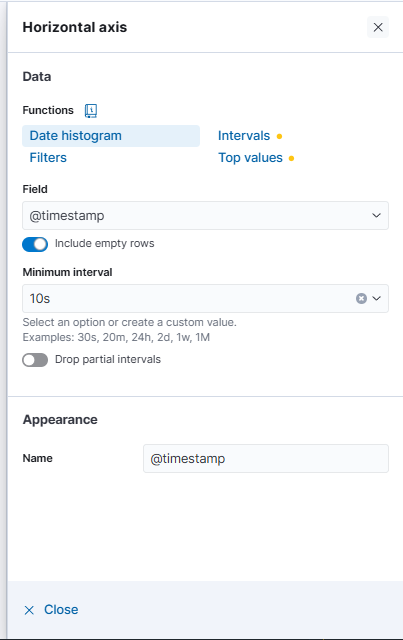
-
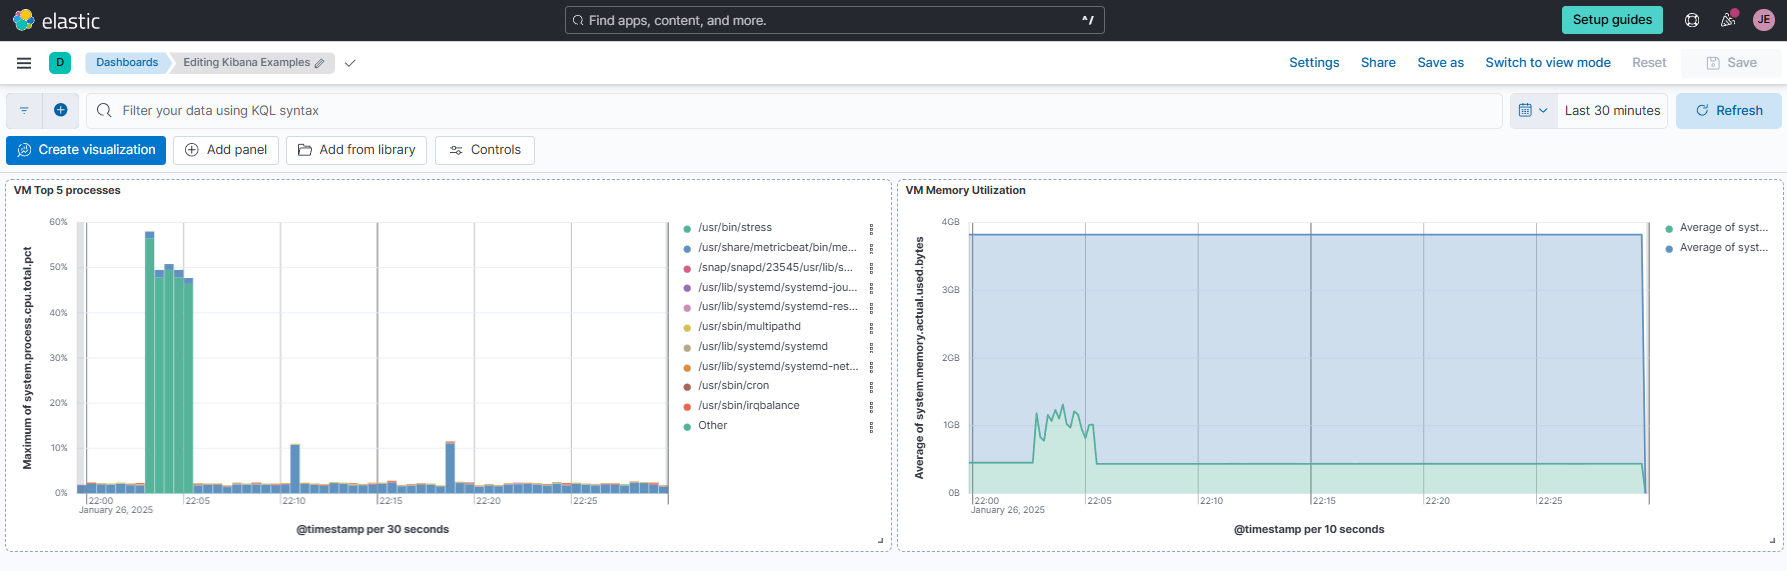
Click Save and save this as "VM Memory Utilization" in the same dashboard as the top processes in the previous example.
Stacked Charts
-
Create a new Lens visualization and use the
metricbeatdata view. Search forsocket.summary.all.countand drag it to the main area. On the right, change Bar chart to a Line chart. Set Vertical axis to useAverage.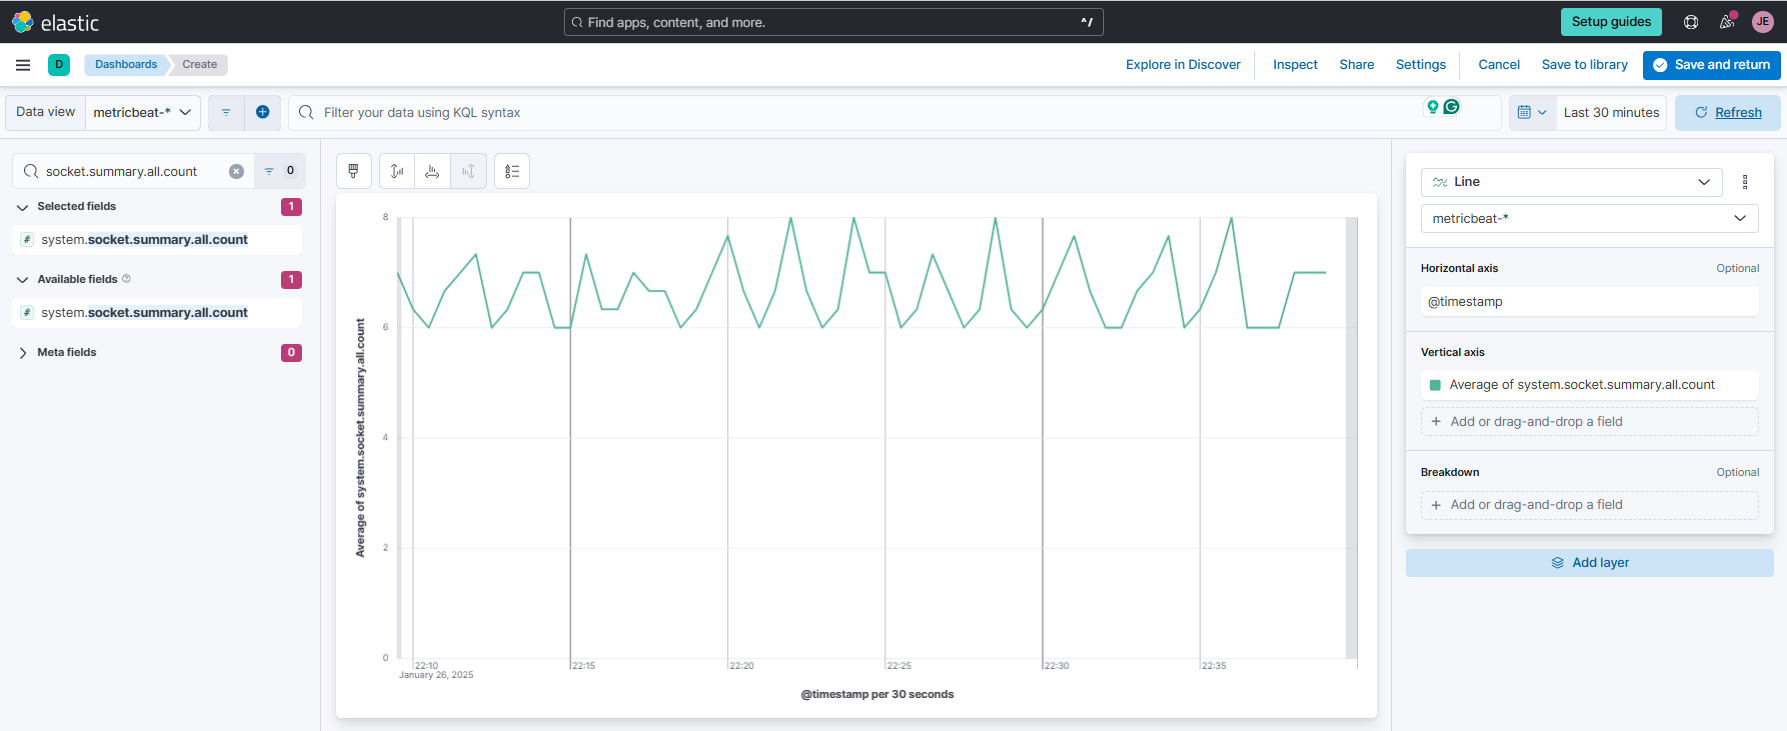
-
Set timeframe to
Last 15 minutesand click@timestampunderHorizontal axisand set Minimum interval to1m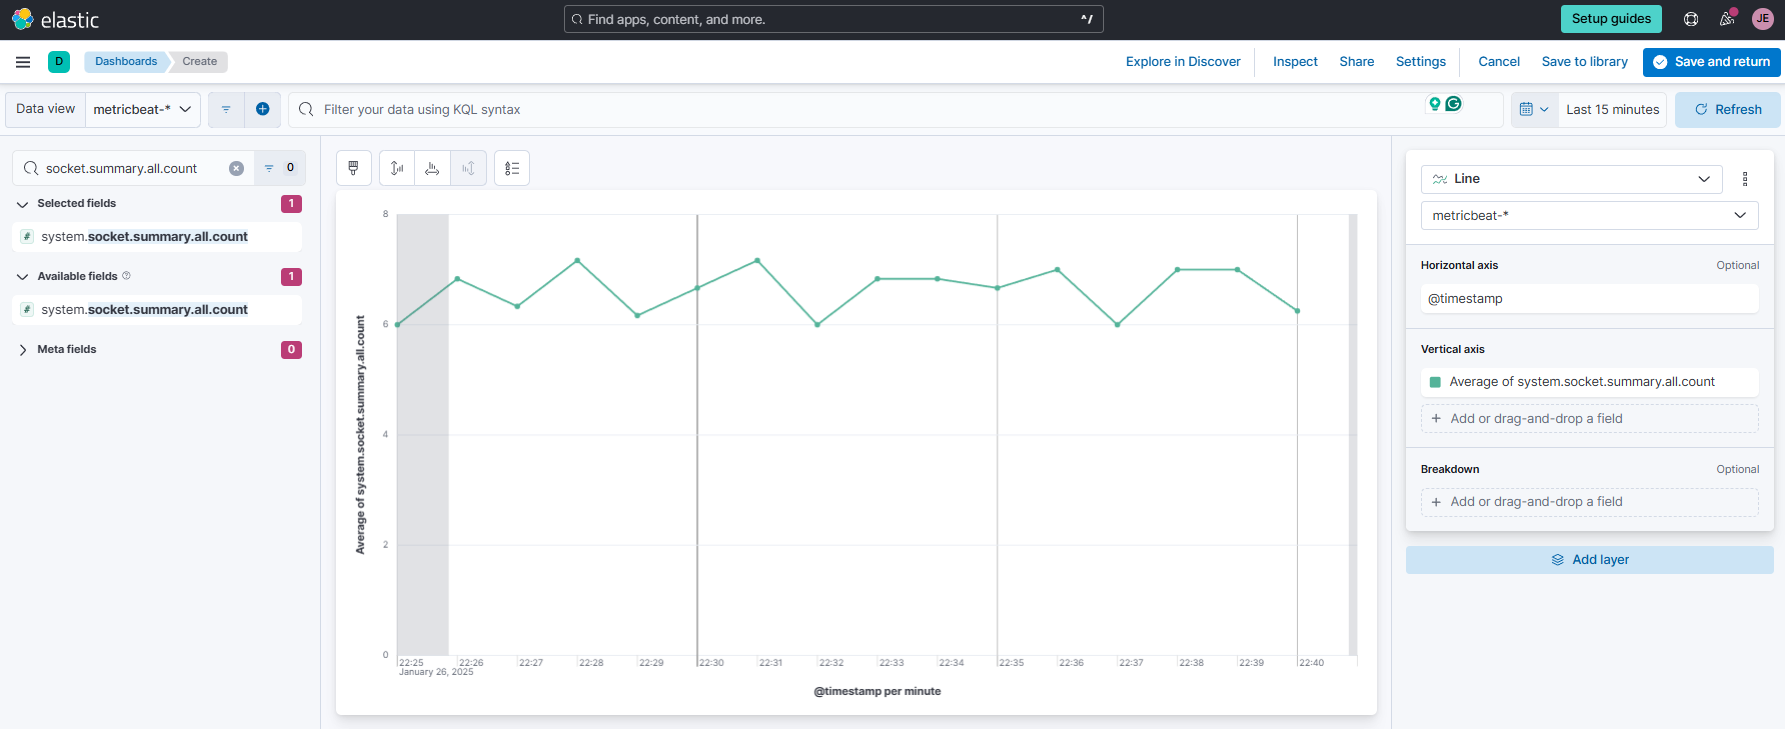
-
Click the
+button at the lower right to add a new visualization layer. Select Visualization > Bar chart. Set Horizontal axis to@timestampand Vertical axis toAveragefor:system.socket.summary.tcp.all.listeningsystem.socket.summary.tcp.all.establishedsystem.socket.summary.tcp.all.close_waitsystem.socket.summary.udp.all.count
Finally, click Horizontal axis (for this layer) and set Minimum interval to
1m.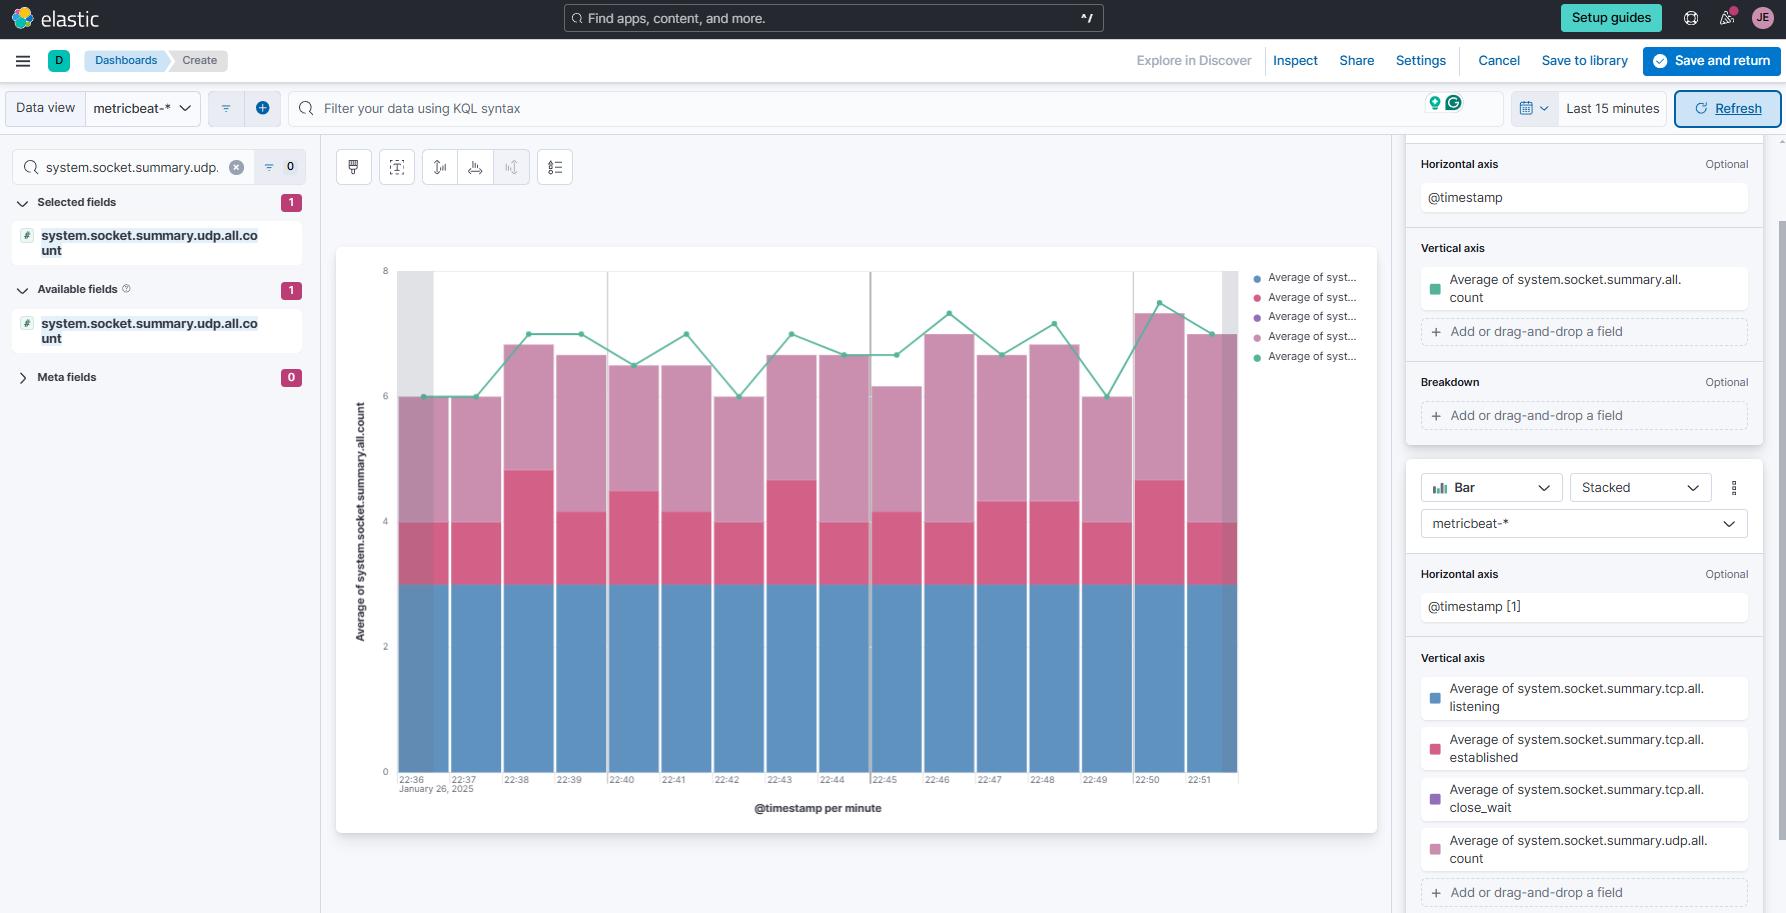
-
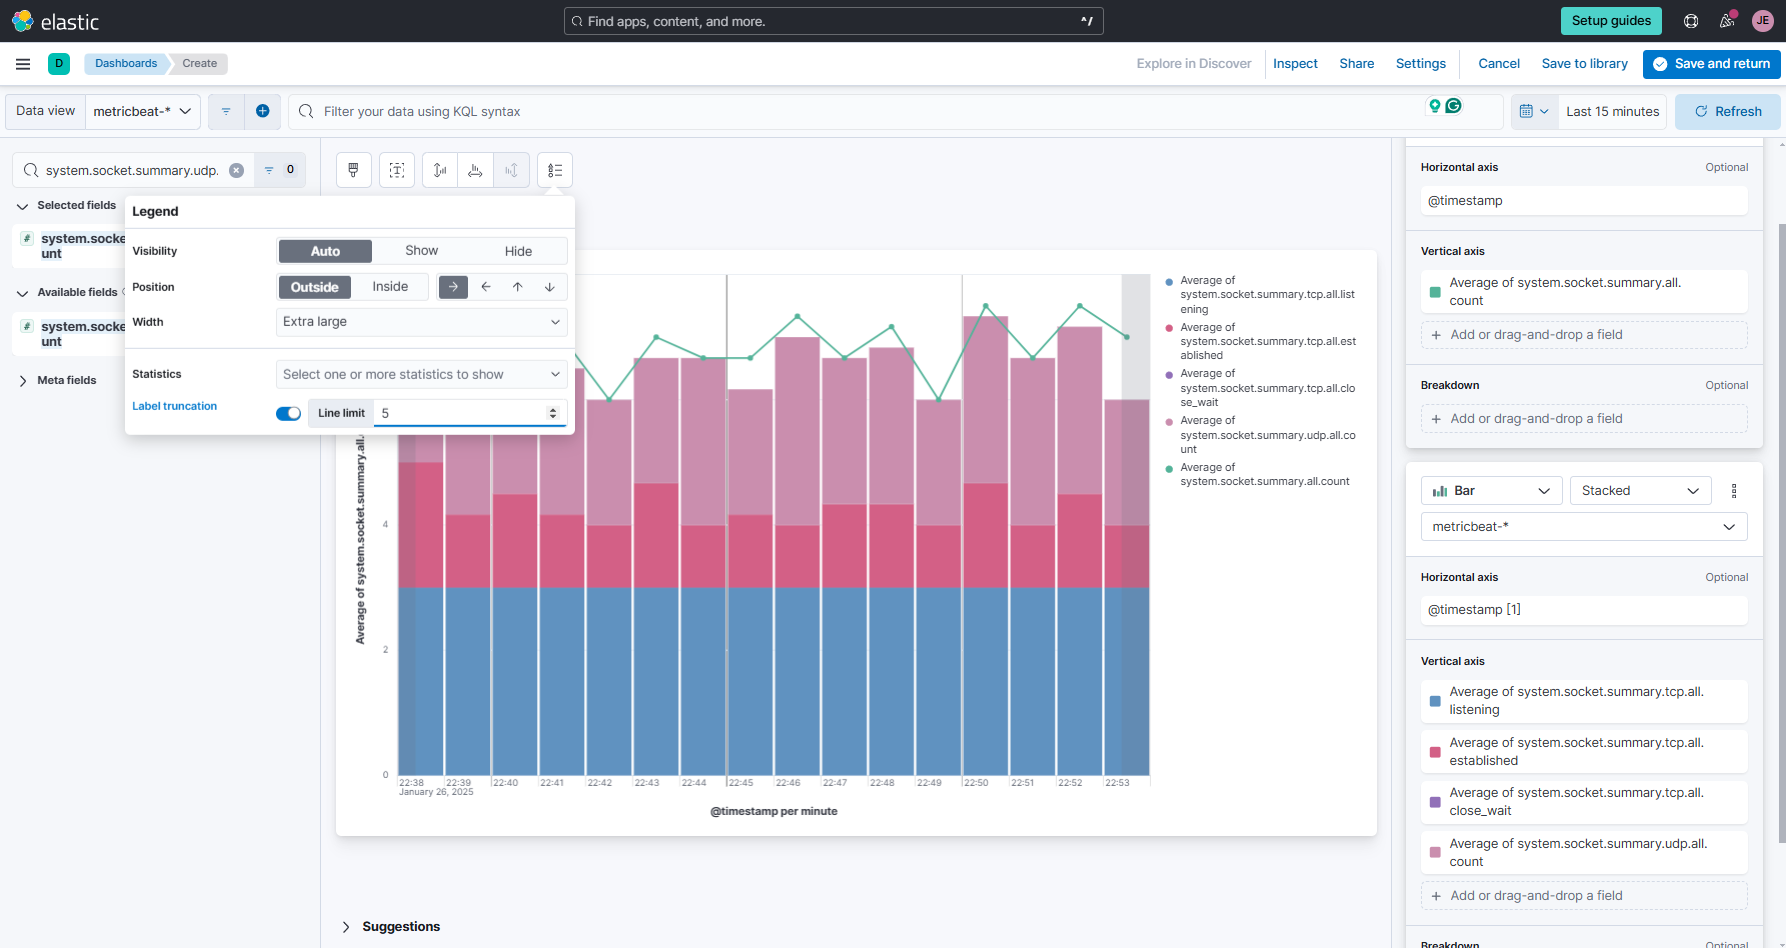
Click the Legend tab and modify the settings, as shown below.
-
Click Save to Library and save it as "VM Sockets". We should now have three visualization panels in our dashboard. Click Save.