Installation
Overview
Kibana is a visualization tool for Elasticsearch, offering an easy way to explore, analyze, and visualize data. It's a key part of the ELK stack, used to create dashboards and monitor log data.
- Provides real-time data visualization and analysis.
- Helps track and troubleshoot system performance and security issues.
Lab Environment
| Node | Hostname | IP Address |
|---|---|---|
| Node 1 | elasticsearch | 192.168.56.101 |
| Node 2 | logstash | 192.168.56.102 |
| Node 3 | kibana | 192.168.56.103 |
Setup details:
- The nodes are created in VirtualBox using Vagrant.
- An SSH key is generated on the Elasticsearch node
Installation
Follow these steps to install Kibana on your system.
-
Use the package manager to install Kibana.
sudo apt-get install kibana -
Modify the
kibana.ymlfile to specify Elasticsearch host and other settings:sudo vi /etc/kibana/kibana.ymlChange
server.hostto0.0.0.0.server.host: "0.0.0.0"If Kibana is not running on the same node as Elasticsearch, you will need to specify the Elasticsearch nodes as well.
elasticsearch.hosts: ["$ELASTIC_ENDPOINT:9200"]Note: SSL is enabled on Elasticsearch node, so I used
httpshere. -
Reload system settings:
sudo systemctl daemon-reload -
Enable and start Kibana.
sudo systemctl enable --now kibanasudo systemctl start kibanasudo systemctl status kibana -
Open a web browser and navigate to
http://<your-server-ip>:5601.You may be prompted to enter the enrolmen token. Please see Configure Elastic.
Offline Installation
Offline installation is useful in pproduction environments with restricted internet access.
-
Get the Kibana package (e.g.,
.tar.gzor.deb) from the official Elasticsearch downloads page on a system with internet access. -
Copy the downloaded package to the offline system using a USB drive or other file transfer methods. If you are using a VirtualBox, you can map local folder to a fileshare in you VM.
-
Install Kibana.
-
For
.tar.gz:tar -xzf kibana-<version>-linux-x86_64.tar.gzcd kibana-<version> -
For
.deb:sudo dpkg -i kibana-<version>.deb
-
-
Edit the
kibana.ymlfile to specify Elasticsearch host and other settings:sudo vi /etc/kibana/kibana.ymlChange
server.hostto0.0.0.0.server.host: "0.0.0.0"If Kibana is not running on the same node as Elasticsearch, you will need to specify the Elasticsearch nodes as well.
elasticsearch.hosts: ["$ELASTIC_ENDPOINT:9200"]Note: SSL is enabled on Elasticsearch node, so I used
httpshere. -
Reload system settings:
sudo systemctl daemon-reload -
Enable and start Kibana.
sudo systemctl enable --now kibanasudo systemctl start kibanasudo systemctl status kibana -
Access Kibana in a web browser at
http://<your-server-ip>:5601.You may be prompted to enter the enrolmen token. Please see Configure Elastic.
Configure Elastic
...short intro..why we need this..
-
Login to your Elasticsearch node and switch to root.
-
Run the command below. A ...will be printed...copy and note it down..
/usr/share/elasticsearch/bin/elasticsearch-create-enrollment-token --scope kibana -
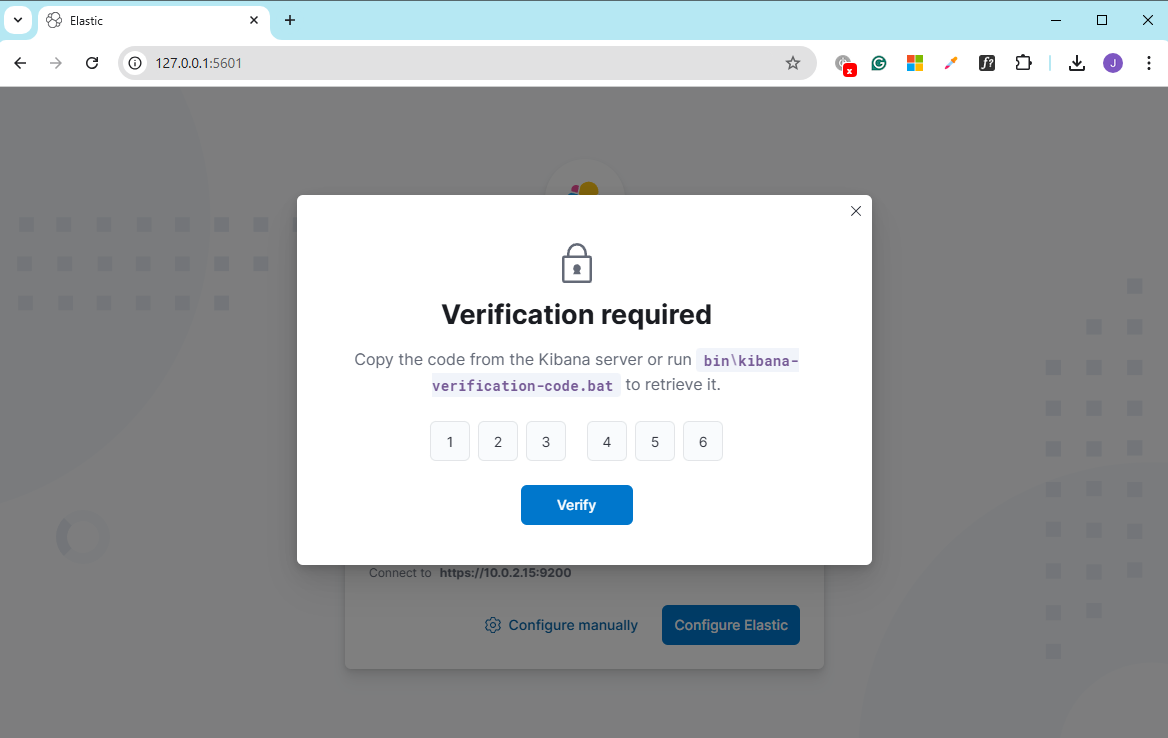
Login to your Kibana node, switch to root, and get the verification code..copy it and note it down..
/usr/share/kibana/bin/kibana-verification-codeOutput:
Your verification code is: 123 456 -
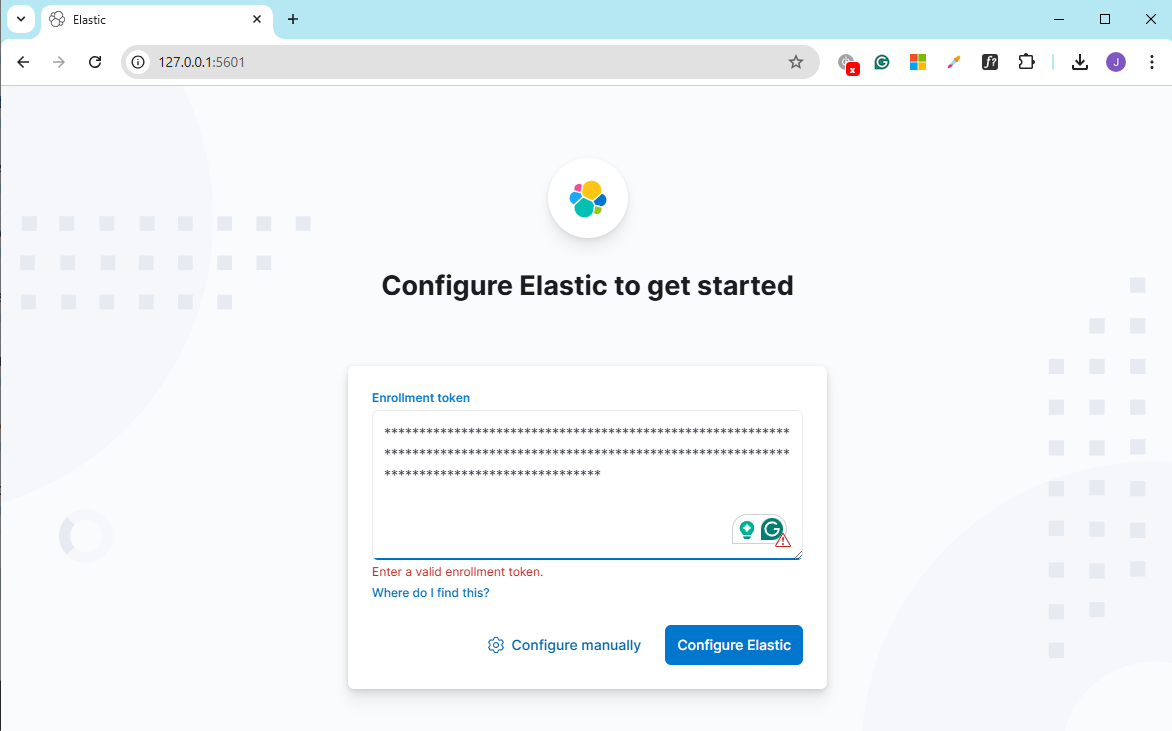
Go back to the Kibana dashboard in your web browser and paste the enrollment token. Click Configure Elastic. It will then ask for a verification code.
-
Enter the verification code from step 3 and click verify.
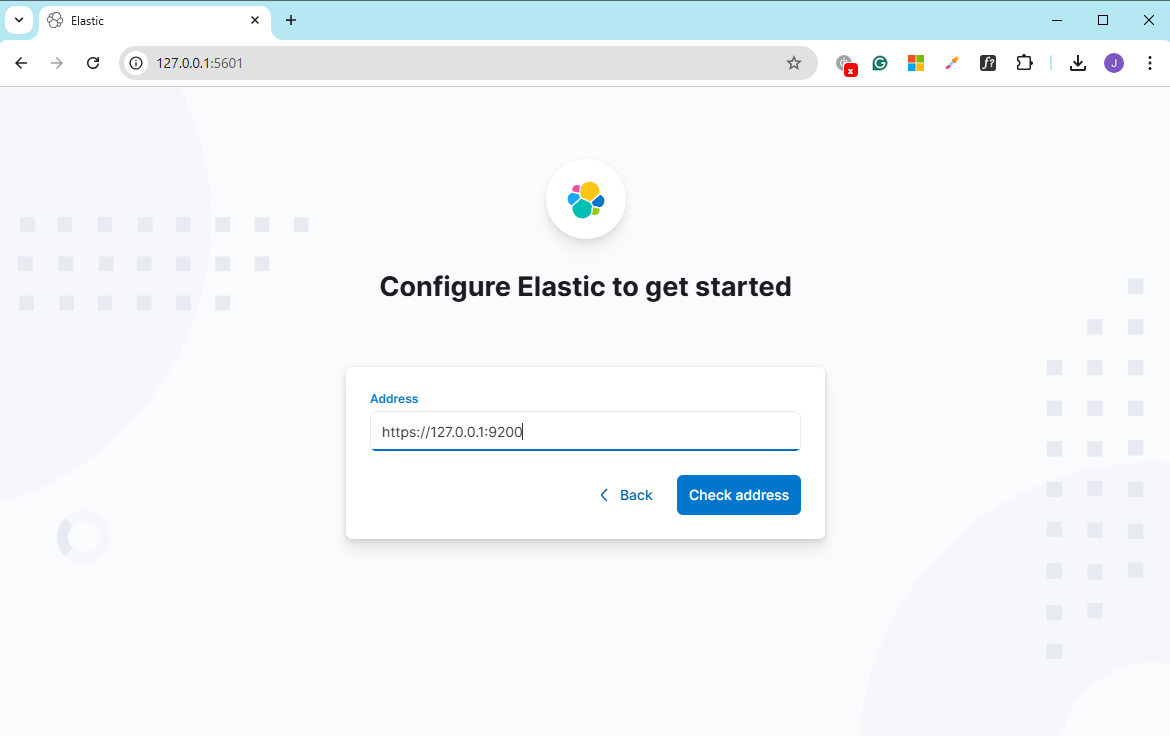
Configure Elastic Manually
If you failed configuring Elastic using the enrolment token, you can try to configure it manually.
- On the enrolment page, click Configure manually and then provide the address of the Elasticsearch node. Click Check address.