Kibana by Example
Overview
This guide shows how to use a dataset of Shakespeare's plays in Kibana to:
- Find the longest play.
- Create a bar chart of document counts.
- Display documents in descending order.
Pre-requisites
This guide uses Elastic Cloud for the hosted Elasticsearch cluster and Kibana.
Import the Dataset
Download the file below. This file contains lines from Shakespeare's plays, formatted for compatibility with Elasticsearch's Bulk API.
Run the following command to index the data into Elasticsearch. Make sure to set the username, password, and the Elasticsearch endpoint.
curl -s -u <username>:<password> \
-H 'Content-Type: application/json' \
-XPOST https://add-elastic-endpoint:9200/shakespeare/_bulk?pretty \
--data-binary @shakespeare_8.0.json | jq
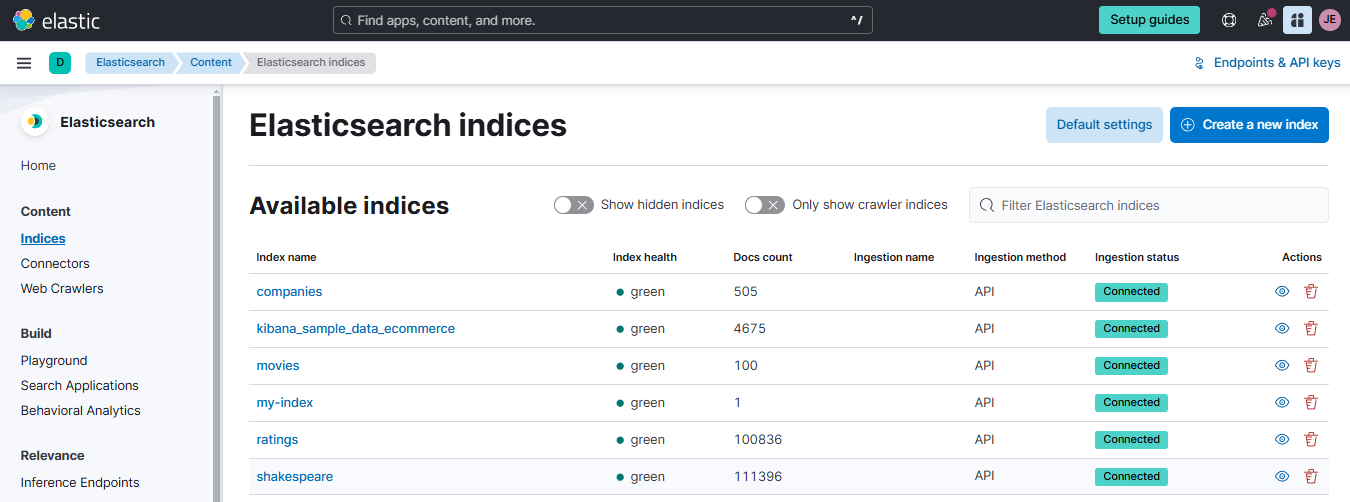
To verify if the shakespeare index has been created successfully:
curl -s -u <username>:<password> \
-H 'Content-Type: application/json' \
-XGET https://add-elastic-endpoint:9200/_cat/indices?v
You can also login to the Elastic Cloud console and go to Elasticsearch > Content > Indices.
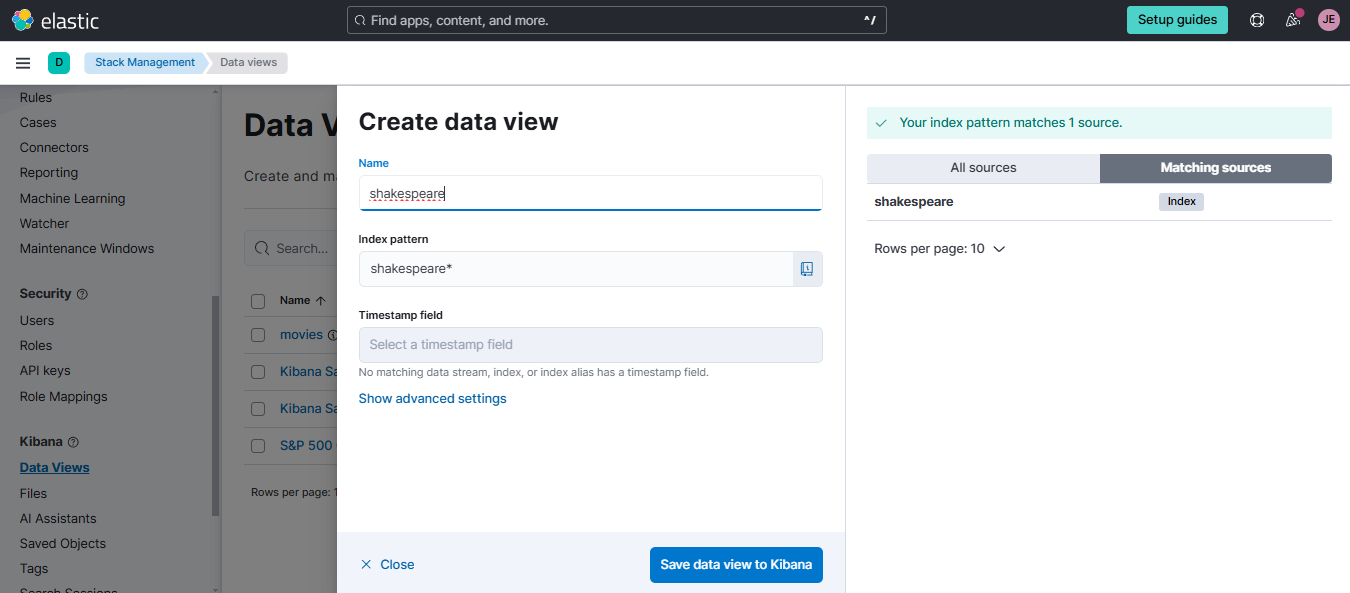
Create the Data View
On your Elastic Cloud account, go to Stack Management > Kibana > Data Views > Create data view. Use "shakespeare" as the data view name and set the index pattern to the index name "shakespeare". Click Save data view to Kibana.
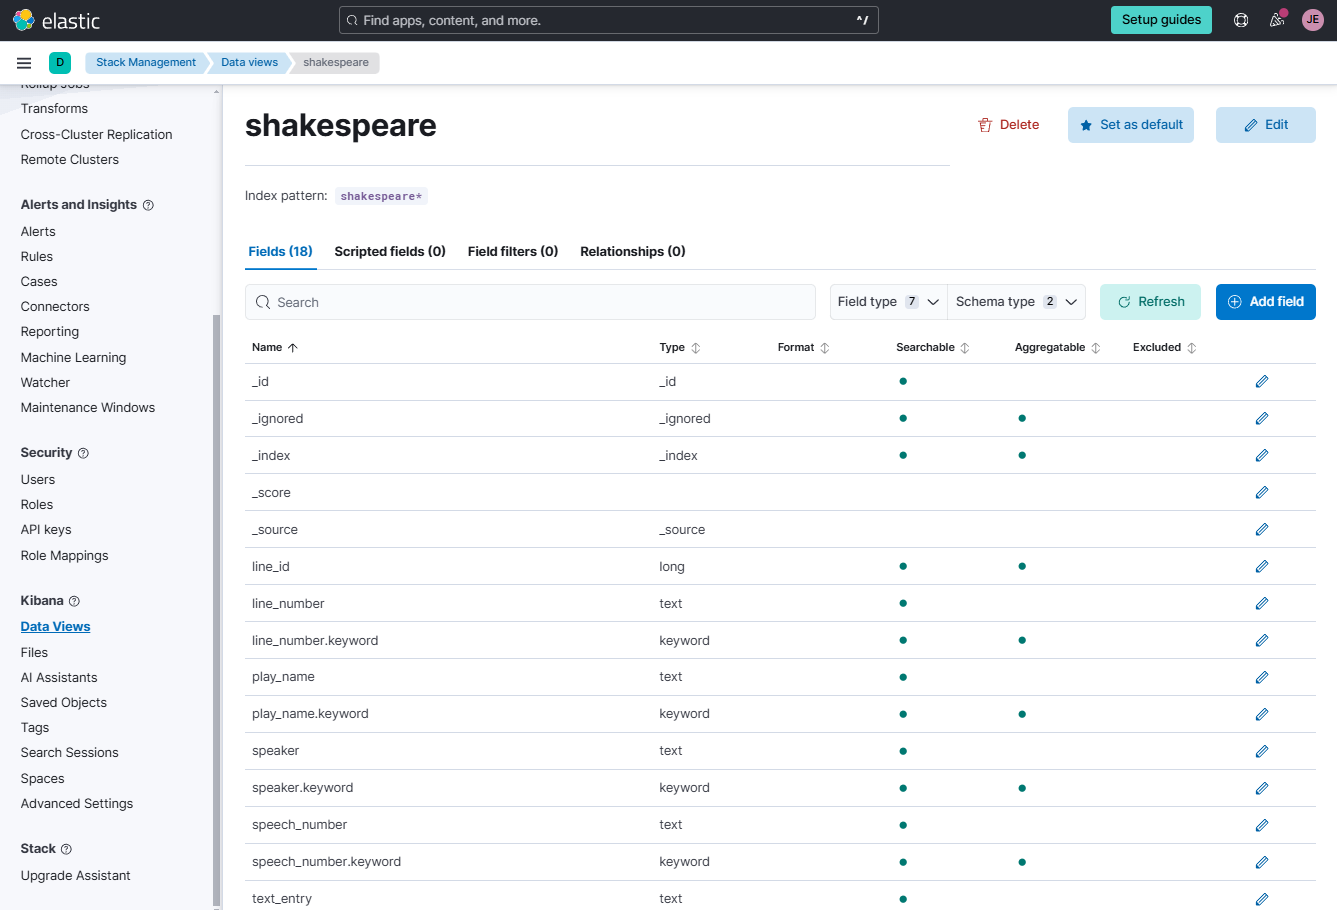
You could see the fields for the shakespeare index here.
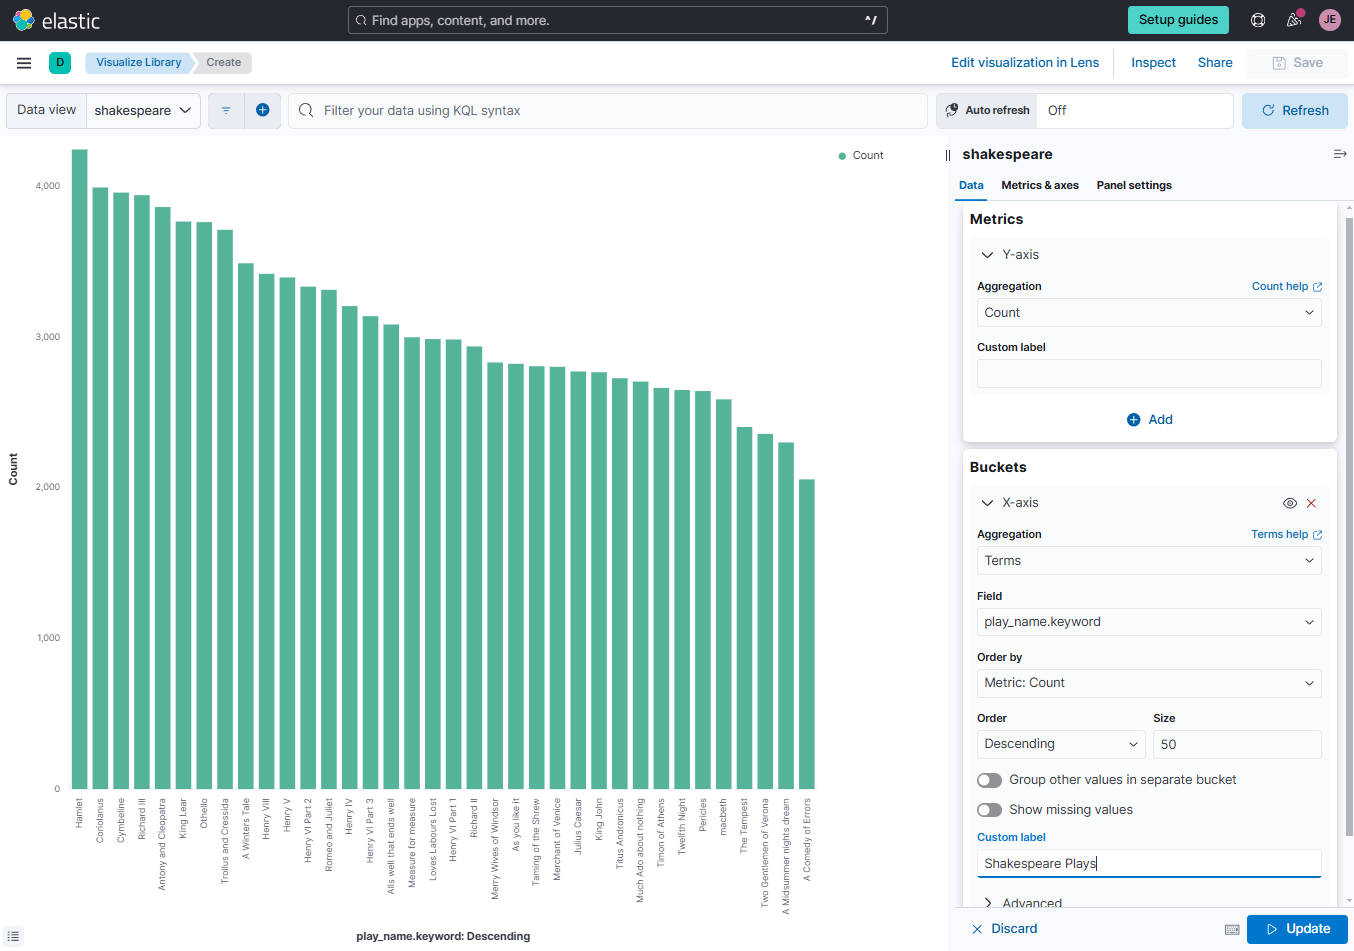
Create the Visualization
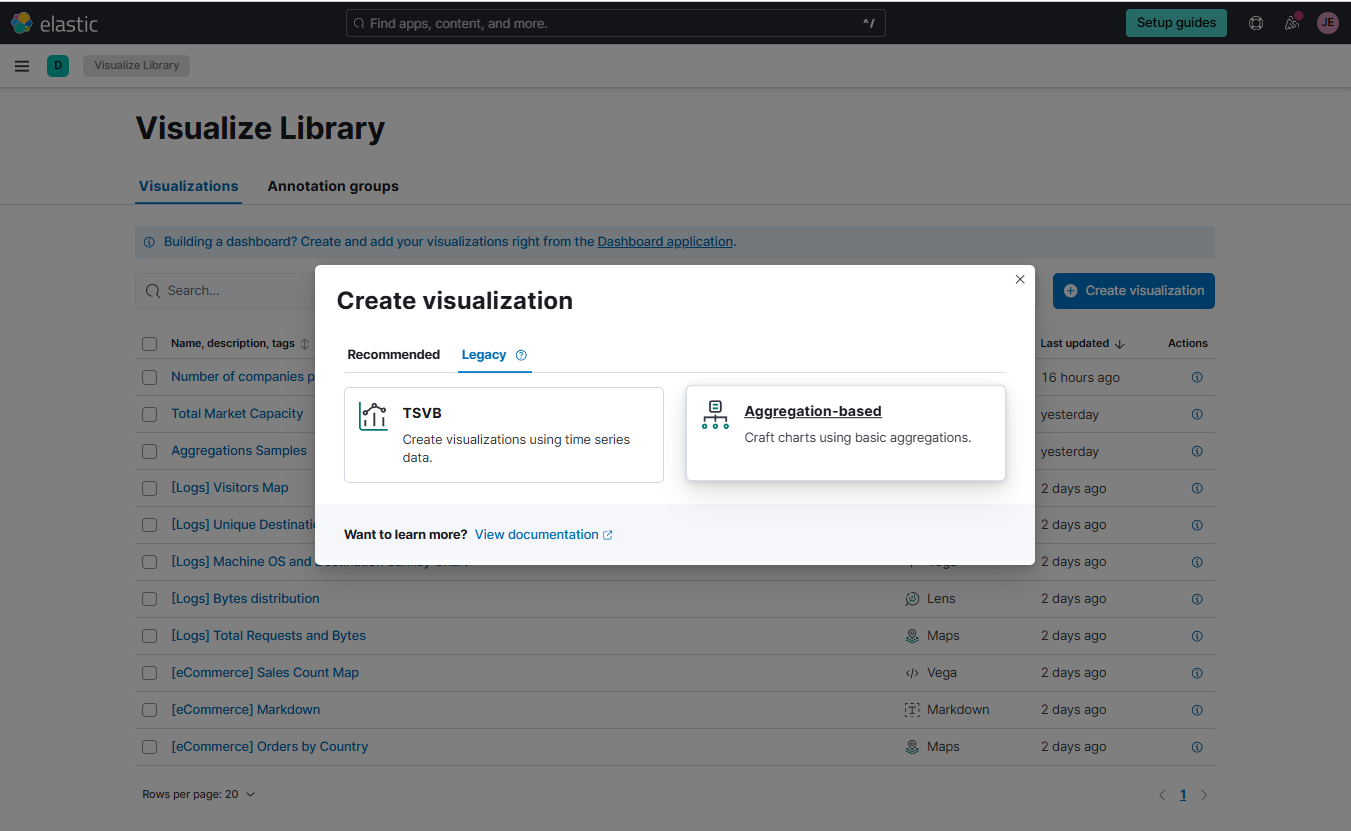
On the Elastic Cloud console, go to Analytics > Visualize Library > Create visualization > Legacy > Aggregation-based.
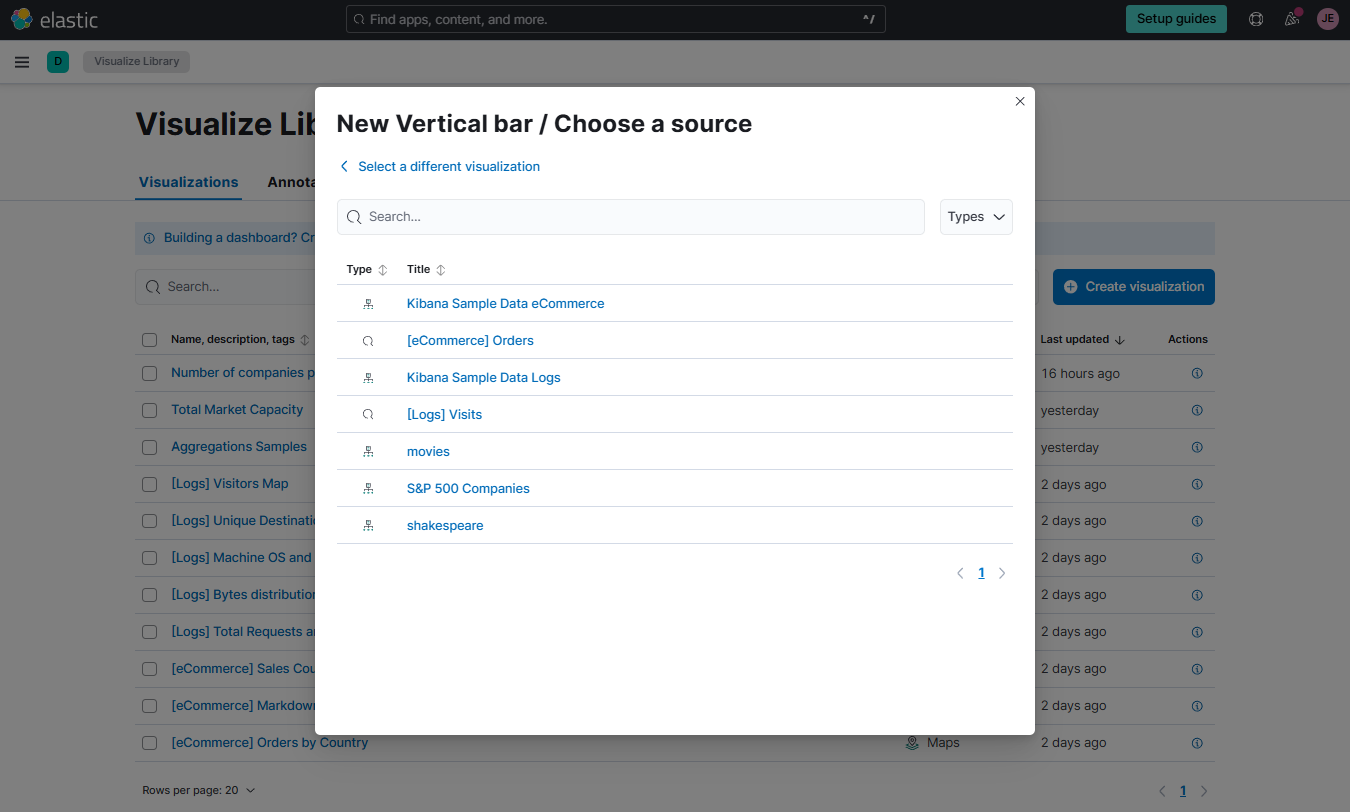
Select vertical bar and then choose the Shakespeare index as the source.
Click the Data view dropdown bar at the upper left corner and select the Shakespeare data view. Set the values for the X and Y-axis as shown below, and click Update.