Prometheus
Overview
Prometheus is an open source server-based monitoring system where typically, you run one instance per environment.
- Cross-platform, works with Linux and Windows
- Provides metrics on CPU, memory, disk use, etc.
- Scrapes targets who expose metrics through an HTTP endpoint.
- Data is stored in a time-series database on the same server.
Metrics that Prometheus can monitor:
- CPU/Memory utilization
- Disk space
- Service uptime
- Application-specific data, e.g. number of exceptions, latency..
Time-series data
Prometheus is designed to monitor time-series data that is numeric.
- This means that all metrics recorded have a timestamp.
- This makes it easier to see trends and spikes over a period of time.
- Timestamps are added when the data is fetched.
- This makes them easy to query using time ranges.
This means Prometheus is NOT INTENDED to monitor:
- Events
- System Logs
- Traces
For application-level metrics, Prometheus also supports several client libraries, including:
- Python
- Node.js
- Go
- Java
- Microsoft .NET
Push-based vs. Pull based
In a push-based system, the monitored applications actively send metrics data to a central monitoring server. Push-based systems include:
- Logstash
- Graphite
- OpenTSDB
In a pull-based system, the monitoring server fetches metrics data from monitored applications at regular intervals. Pull-based systems include:
- Zabbix
- Nagios
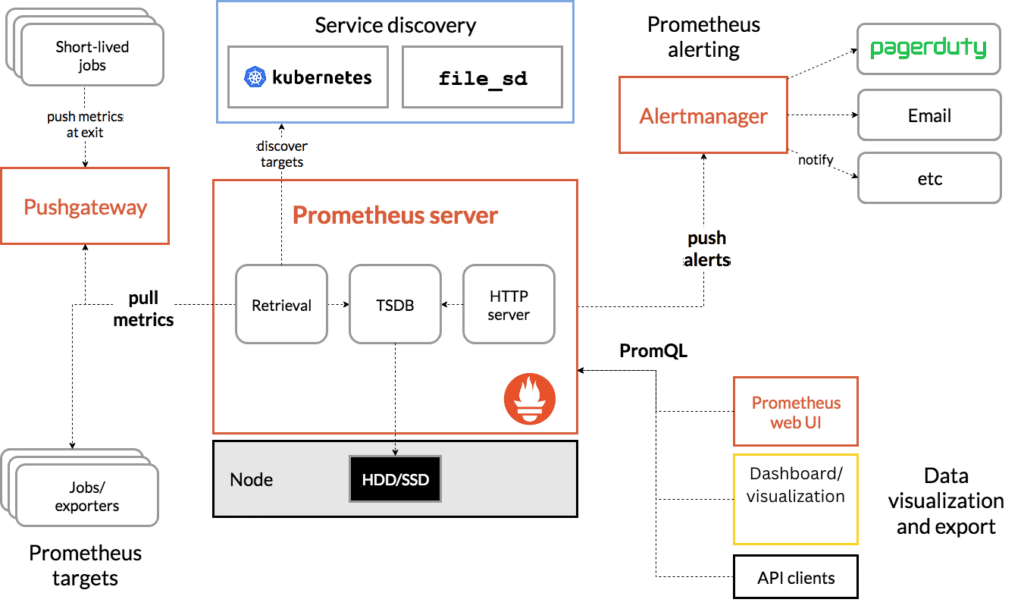
Prometheus Architecture
Prometheus' architecture is built around these key components.
-
Retrieval
- Responsible for gathering metrics data from monitored targets.
- Uses a pull-based approach via HTTP endpoints.
- Supports service discovery and static configurations for target identification.
-
Time-series Database (TSDB)
- Stores collected metrics as time-series data for efficient querying.
- Optimized for high-performance writes and compact storage.
- Retains historical data for analysis and visualization.
-
HTTP Server
- Exposes Prometheus's functionality to users and integrations.
- Provides a query language (PromQL) for data analysis.
- Serves metrics data to dashboards and alerting systems.
Additional components:
- Service discovery, which supplies the list of targets to Prometheus.
- The retrieval node, responsible for pulling metrics from exporters.
- For short-lived jobs, data is pushed via Pushgateway.
- Prometheus queries the data from the Pushgateway.
- Alerts from Prometheus are sent to Alertmanager.
- Finally, Prometheus or Grafana can be used to query the data using PromQL.
Exporters
Prometheus collects metrics by sending HTTP requests to the /metrics endpoint of each target. The endpoint can also be changed and Prometheus can be configured to use a different path other than /metrics Note that most systems don't expose metrics on an HTTP endpoint. For these instances, we can install exporters on the targets which:
- Collects metrics from the service
- Converts metrics to a format expected by Prometheus
- Exposes
/metricsendpoint so Prometheus can scrape the data.
For more information, please see Exporters in Prometheus.
Pushgateways
Pushgateways act as intermediaries for Prometheus to receive and temporarily store metrics.
- Enables metric collection from short-lived jobs or batch processes.
- Accepts metrics through a push mechanism instead of Prometheus's pull model.
- Helps maintain metrics data even if the job has already completed.
Alertmanager
Alertmanager handles alerts generated by Prometheus based on defined rules.
- Manages, de-duplicates, and routes alerts to various notification channels.
- Supports silencing and grouping to reduce alert fatigue.
- Integrates with email, PagerDuty, Slack, and other tools for alert delivery.
PromQL
PromQL is Prometheus's powerful query language designed for analyzing time-series data.
- Built specifically for working with time-series data, unlike traditional SQL.
- Allows users to extract, aggregate, and visualize metrics efficiently.
- Queries are executed via the HTTP API on the Prometheus server.
Sample PromQL statements:
# Retrieve the average CPU usage over 5 minutes
avg(rate(node_cpu_seconds_total[5m]))

# Count the number of active HTTP requests
count(http_requests_total)

# Calculate the 95th percentile of request durations
histogram_quantile(0.95, rate(http_request_duration_seconds_bucket[1m]))
For more information, please see PromQL.
Promtools
Promtools is a utility tool that comes with Prometheus to help check and validate configuration files, debug issues, and test rules.
- Validates
prometheus.ymland rule files. - Performs queries on the Prometheus server.
- Can be used to debug and profile the Prometheus server.
- Runs unit tests for recording or alerting rules.
- Validate metrics to ensure they are formatted correctly.
As an example, we can use the command below to validate the configuration file:
promtool check config /etc/prometheus/prometheus.yml
If the configuration file is valid, it should return:
Checking prometheus.yml
 SUCCESS: prometheus.yml is valid prometheus config file syntax
Client Libraries
Client libraries enable custom applications to monitor and expose their own metrics for Prometheus to collect.
- Provide pre-built functions and tools to define and expose custom metrics.
- Support common metric types like counters, gauges, histograms, and summaries.
Language support:
- Go
- Java
- Python
- Ruby
- Rust
For more information, please see Client Libraries.
Server Configurations
Server configurations can be viewed through the web UI on the server.
- Used for administrative tasks, like verifying reachability of monitored systems.
- The web UI is limited and not a comprehensive dashboard.
- For a complete system health view, connect Grafana to Prometheus to visualize data.
- In-built alerting system to set rules for sending emails or creating tickets when triggered.
To access the server configuration from the Prometheus console, go to Status > Configuration.
To view the configuration file from the terminal, login to the server and open /etc/prometheus/prometheus.yml:
# Global configuration
global:
  scrape_interval: 15s      # Default, can be changed
  evaluation_interval: 15s  # Default, can be changed

# Alerting configuration
alerting:
  alertmanagers:
    - static_configs:
        - targets: ['localhost:9093']

# Scrape configurations
scrape_configs:

  # Scrape Prometheus itself
  - job_name: 'prometheus'
    scrape_interval: 15s      # Overrides global config if defined
    scrape_timeout: 5s
    sample_limit: 1000
    static_configs:
      - targets: ['localhost:9090']

  # List of nodes with Node Exporter installed
  - job_name: 'node_exporter'
    sample_limit: 1000
    scheme: https
    metrics_path: /stats/metrics      ## Custom path
    static_configs:
      - targets: ['node1_ip:9100', 'node2_ip:9100']

  # List of application endpoints exposed for Prometheus scraping
  - job_name: 'custom_app'
    static_configs:
      - targets: ['app1_ip:8080', 'app2_ip:8080']

  # Additional: MySQL exporter on the target node
  - job_name: 'mysql_exporter'
    static_configs:
      - targets: ['mysql_host:9104']