Container Metrics
Overview
Container metrics provide insights into the performance and health of containers running in your environment. Prometheus can collect these metrics by using tools like cAdvisor, which exposes container-level metrics such as CPU usage, memory consumption, and network traffic. T
Pre-requisites
Docker Engine Metrics vs cAdvisor Metrics
Docker Engine and cAdvisor provide different sets of metrics for monitoring containers. While Docker Engine focuses on overall Docker performance, cAdvisor offers detailed metrics specific to individual containers.
-
Docker Engine Metrics
- CPU usage by Docker
- Total failed image builds
- Time to process container actions
- No container-specific metrics
-
cAdvisor Metrics
- CPU and memory usage per container
- Number of processes running in a container
- Uptime for each running container
Docker Engine Metrics
-
Create or edit the
/etc/docker/daemon.jsonfile:vi /etc/docker/daemon.json -
Add the following lines to the file:
{"metrics-addr" : "127.0.0.1:9323","experimental" : true}If you have an existing daemon file, then adding the new lines should look like this:
{"exec-opts": ["native.cgroupdriver=cgroupfs"],"bip": "172.12.0.1/24","registry-mirrors": ["http://docker-registry-mirror.abc.com"],"metrics-addr" : "127.0.0.1:9323","experimental" : true} -
Restart the Docker service:
systemctl restart dockersystemctl status docker -
Verify if Docker is exporting the metrics:
curl localhost:9323/metricsIt should return a long list of metrics:
# HELP builder_builds_failed_total Number of failed image builds# TYPE builder_builds_failed_total counterbuilder_builds_failed_total{reason="build_canceled"} 0builder_builds_failed_total{reason="build_target_not_reachable_error"} 0builder_builds_failed_total{reason="command_not_supported_error"} 0builder_builds_failed_total{reason="dockerfile_empty_error"} 0........ -
Edit
/etc/prometheus/prometheus.ymlfile and add below given lines underscrape_configs:- job_name: "docker"static_configs:- targets: ["localhost:9323"] -
Restart prometheus service:
systemctl restart prometheussystemctl status prometheus -
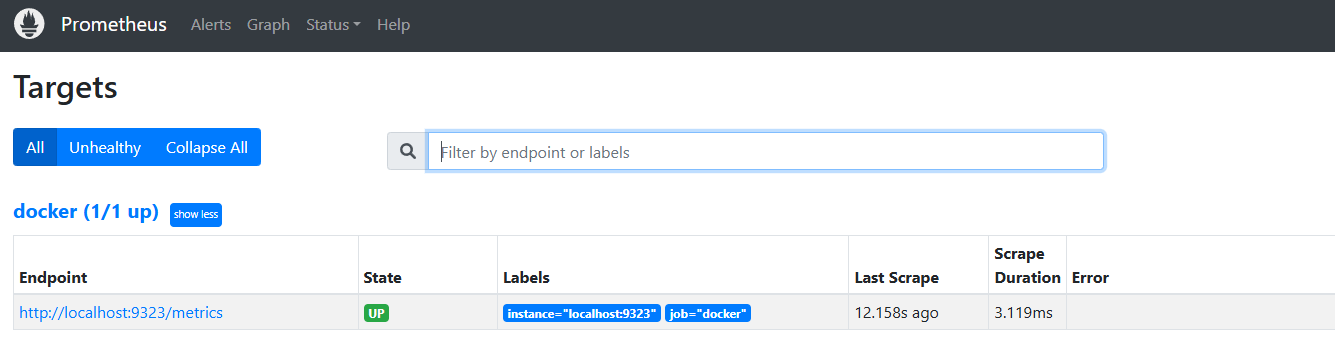
Access the Prometheus console and go to Status > Targets. The Docker host should show "up".
-
Go back to the main page and enter the following in the expression bar:
engine_daemon_container_states_containers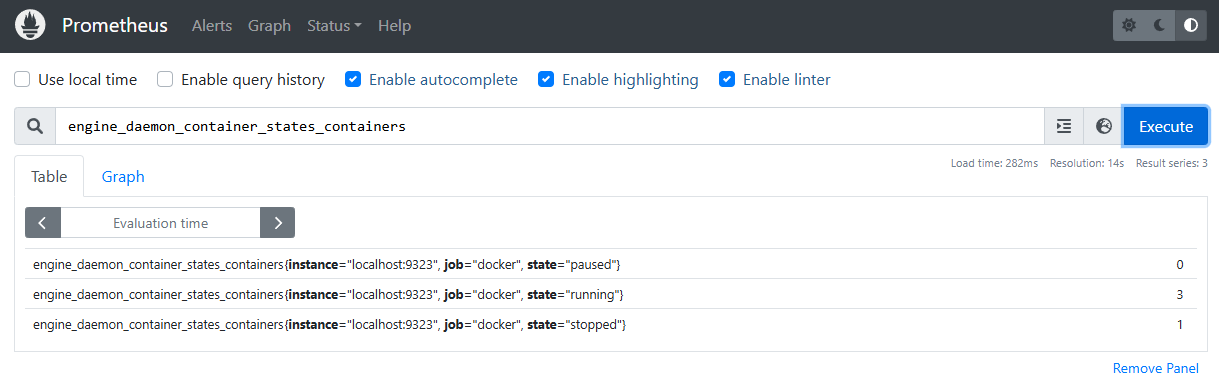
Container-level Metrics
To collect container-level metrics, run a cAdvisor container on the Docker host. cAdvisor exposes metrics like CPU usage, memory, and network traffic, which Prometheus can scrape for monitoring.
-
Create the docker compose file for the cAdvisor. Note that this container is exposed on port 8070.
version: '3.4'services:cadvisor:image: gcr.io/cadvisor/cadvisorcontainer_name: cadvisorprivileged: truedevices:- "/dev/kmsg:/dev/kmsg"volumes:- /:/rootfs:ro- /var/run:/var/run:ro- /sys:/sys:ro- /var/lib/docker/:/var/lib/docker:ro- /dev/disk/:/dev/disk:roports:- 8070:8080 -
Run the docker compose file.
docker compose up -dIt should return:
✔ Container cadvisor Running -
Create a new job named "cadvisor" in
/etc/prometheus/prometheus.ymland addlocalhost:8070as the target.- job_name: "cadvisor"static_configs:- targets: ["localhost:8070"] -
Restart the Prometheus service after applying the changes.
systemctl restart prometheussystemctl status prometheus -
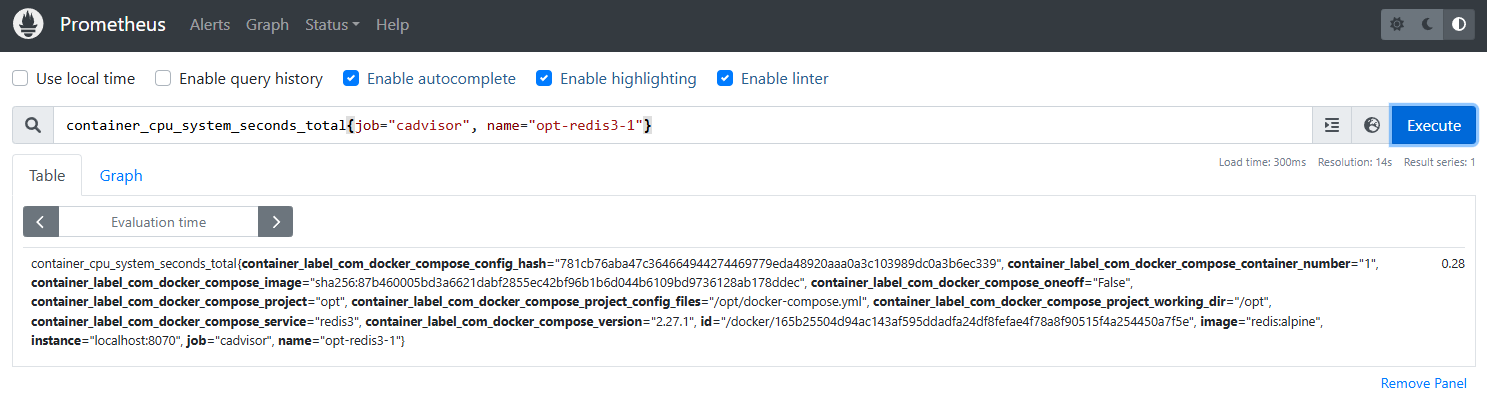
Login to the Prometheus console and enter the following in the expression bar:
container_cpu_system_seconds_total{job="cadvisor", name="opt-redis3-1"}We should now see the metrics of the individual containers: