Console Templates
Overview
Console templates enable you to create custom HTML dashboards for visualizing Prometheus metrics. They offer flexibility by allowing tailored displays of collected data and can be designed using the Go templating language. In this lab, we'll set up a node-stats.html console template which displays:
memory sizeandmemory utilizationof the nodesCPU statsandcpu utilizationof the nodes- Graph of the
cpu utilization - Graph of the
received bytes
Pre-requisites
Steps
-
Create the
/etc/prometheus/consoles/node-stats.htmlwith the standard header and footer.{{template "head" .}}{{template "prom_content_head" .}}<h1>Node Stats</h1>{{template "prom_content_tail" .}}{{template "tail"}} -
Open the web browser and proceed to the page below. At the moment, it is still currently empty.
https://<prometheus-url>/consoles/node-stats.html
-
Update the template and add
memory statsof the nodes{{template "head" .}}{{template "prom_content_head" .}}<h1>Node Stats</h1><h3>Memory</h3><strong>Memory utilization:</strong> {{template "prom_query_drilldown" (args"100- (node_memory_MemAvailable_bytes/node_memory_MemTotal_bytes*100)" "%") }}{{template "prom_content_tail" .}}{{template "tail"}} -
Refresh the Prometheus console and see the
memoryadded.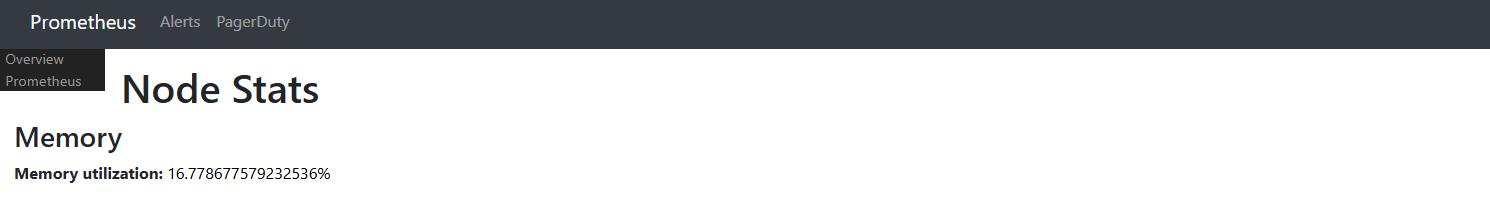
-
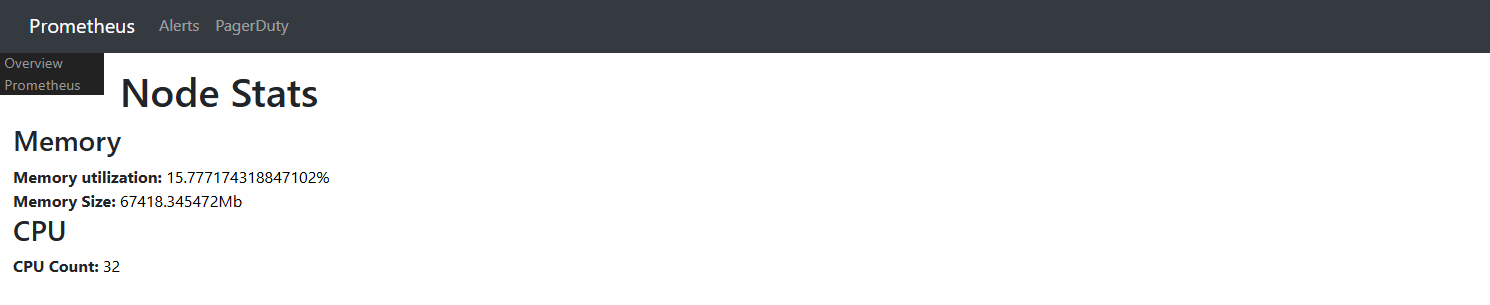
Update the template once again and add
memory size.{{template "head" .}}{{template "prom_content_head" .}}<h1>Node Stats</h1><h3>Memory</h3><strong>Memory utilization:</strong> {{template "prom_query_drilldown" (args"100- (node_memory_MemAvailable_bytes/node_memory_MemTotal_bytes*100)" "%") }}<br/><strong>Memory Size:</strong> {{template "prom_query_drilldown" (args "node_memory_MemTotal_bytes/1000000" "Mb") }}{{template "prom_content_tail" .}}{{template "tail"}} -
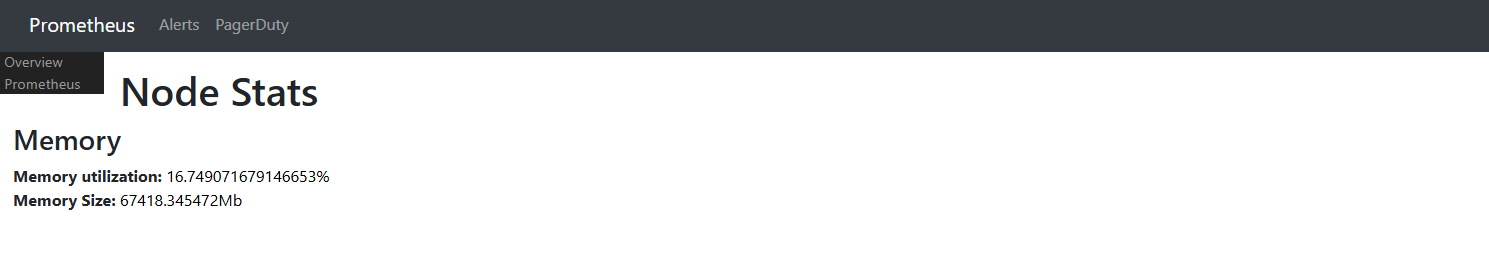
We now have two metrics printed in the console.
-
Now add the CPU-based stats:
{{template "head" .}}{{template "prom_content_head" .}}<h1>Node Stats</h1><h3>Memory</h3><strong>Memory utilization:</strong> {{template "prom_query_drilldown" (args"100- (node_memory_MemAvailable_bytes/node_memory_MemTotal_bytes*100)" "%") }}<br/><strong>Memory Size:</strong> {{template "prom_query_drilldown" (args "node_memory_MemTotal_bytes/1000000" "Mb") }}<br/><h3>CPU</h3><strong>CPU Count:</strong> {{template "prom_query_drilldown" (args"count(node_cpu_seconds_total{mode='idle'})") }}{{template "prom_content_tail" .}}{{template "tail"}} -
Refresh the Prometheus console once again to show both CPU and memory metrics.
-
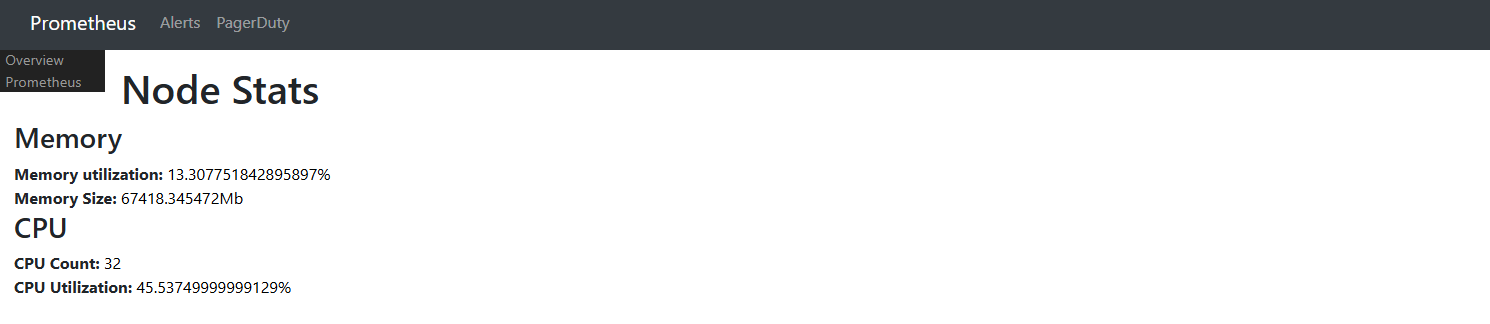
Add one more CPU metric which calculates CPU Utilization.
{{template "head" .}}{{template "prom_content_head" .}}<h1>Node Stats</h1><h3>Memory</h3><strong>Memory utilization:</strong> {{template "prom_query_drilldown" (args"100- (node_memory_MemAvailable_bytes/node_memory_MemTotal_bytes*100)" "%") }}<br/><strong>Memory Size:</strong> {{template "prom_query_drilldown" (args"node_memory_MemTotal_bytes/1000000" "Mb") }}<h3>CPU</h3><strong>CPU Count:</strong> {{template "prom_query_drilldown" (args"count(node_cpu_seconds_total{mode='idle'})") }}<br/><strong>CPU Utilization:</strong>{{template "prom_query_drilldown" (args"sum(rate(node_cpu_seconds_total{mode!='idle'}[2m]))*100/8" "%") }}{{template "prom_content_tail" .}}{{template "tail"}} -
On the Prometheus console, click refresh to reflect all four metrics.
-
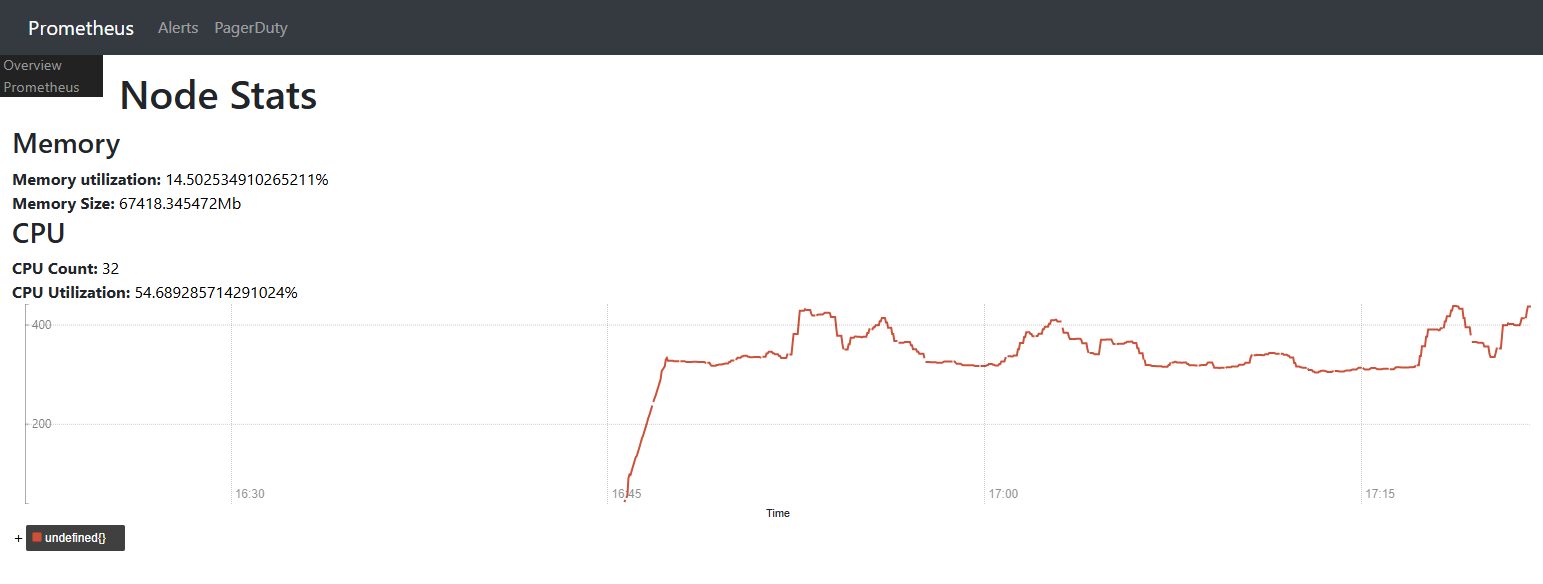
Finally, graph out the CPU Utilization on the nodes:
{{template "head" .}}{{template "prom_content_head" .}}<h1>Node Stats</h1><h3>Memory</h3><strong>Memory utilization:</strong> {{template "prom_query_drilldown" (args"100- (node_memory_MemAvailable_bytes/node_memory_MemTotal_bytes*100)" "%") }}<br/><strong>Memory Size:</strong> {{template "prom_query_drilldown" (args"node_memory_MemTotal_bytes/1000000" "Mb") }}<h3>CPU</h3><strong>CPU Count:</strong> {{template "prom_query_drilldown" (args"count(node_cpu_seconds_total{mode='idle'})") }}<br/><strong>CPU Utilization:</strong>{{template "prom_query_drilldown" (args"sum(rate(node_cpu_seconds_total{mode!='idle'}[2m]))*100/16" "%") }}<div id="cpu"></div><script>new PromConsole.Graph({node: document.querySelector("#cpu"),expr: "sum(rate(node_cpu_seconds_total{mode!='idle'}[2m]))*100/2",});</script>{{template "prom_content_tail" .}}{{template "tail"}} -
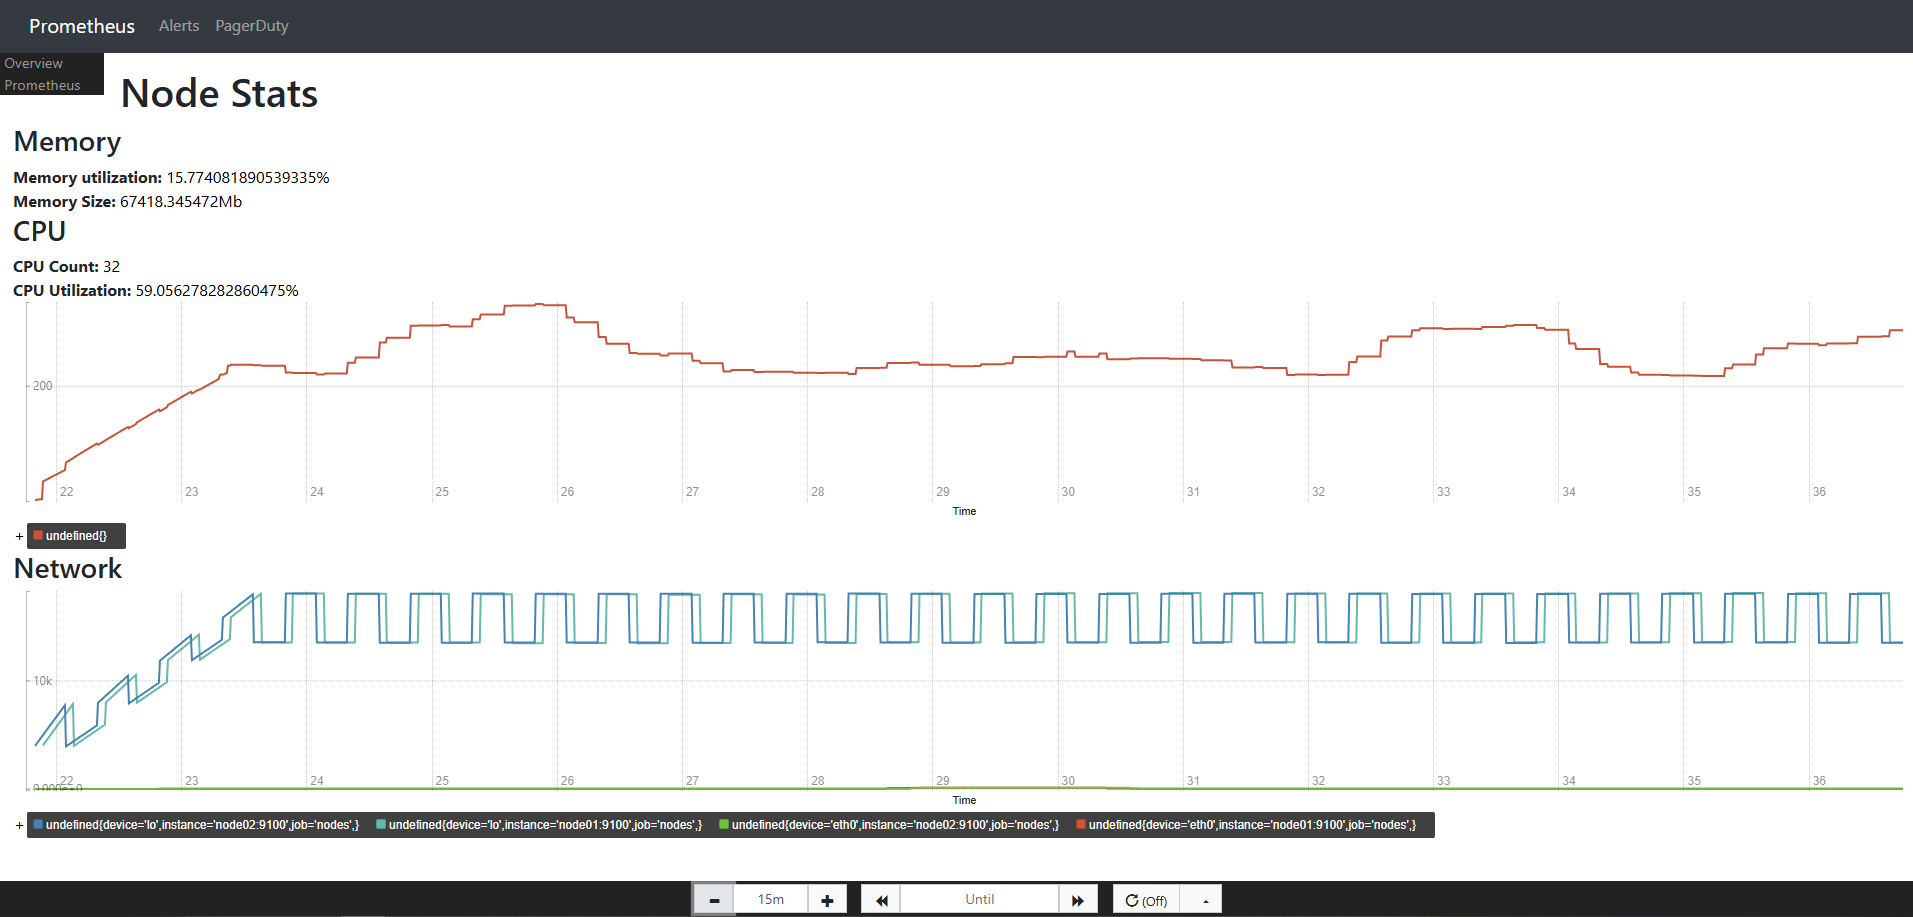
We're now getting more details with the graph after reloading the Prometheus console.
-
Let's just add one more graph for a new metric that tracks all received bytes on all interfaces:
{{template "head" .}}{{template "prom_content_head" .}}<h1>Node Stats</h1><h3>Memory</h3><strong>Memory utilization:</strong> {{template "prom_query_drilldown" (args"100- (node_memory_MemAvailable_bytes/node_memory_MemTotal_bytes*100)" "%") }}<br/><strong>Memory Size:</strong> {{template "prom_query_drilldown" (args"node_memory_MemTotal_bytes/1000000" "Mb") }}<h3>CPU</h3><strong>CPU Count:</strong> {{template "prom_query_drilldown" (args"count(node_cpu_seconds_total{mode='idle'})") }}<br/><strong>CPU Utilization:</strong>{{template "prom_query_drilldown" (args"sum(rate(node_cpu_seconds_total{mode!='idle'}[2m]))*100/8" "%") }}<div id="cpu"></div><script>new PromConsole.Graph({node: document.querySelector("#cpu"),expr: "sum(rate(node_cpu_seconds_total{mode!='idle'}[2m]))*100/2",});</script><h3>Network</h3><div id="network"></div><script>new PromConsole.Graph({node: document.querySelector("#network"),expr: "rate(node_network_receive_bytes_total[2m])",});</script>{{template "prom_content_tail" .}}{{template "tail"}} -
Refresh the Prometheus console page: