Service Discovery
Overview
Service discovery in Prometheus helps automatically find and track targets for monitoring. It simplifies the management of dynamic environments where services may frequently change.
- Prometheus discovers services using DNS, file, or cloud APIs.
- Targets are automatically updated when services change.
- Service discovery handles dynamic environments.
- It eliminates manual target configuration.
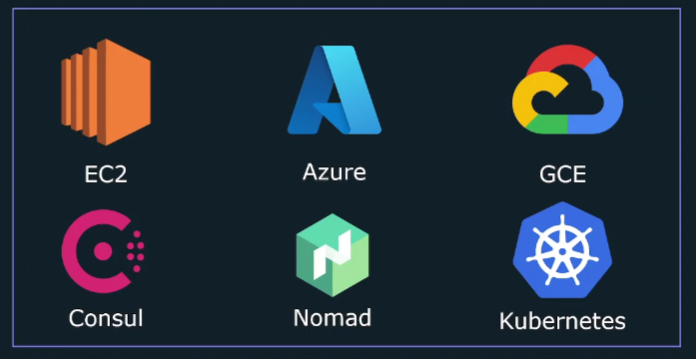
Prometheus has built-in support for several service discovery mechanisms:

Static Config
Static configuration is used to define fixed targets for scraping metrics. This is useful when the target services don't change frequently.
scrape_configs:
  - job_name: 'node-exporter'
    static_configs:
      - targets: ['localhost:9100', 'server2:9100', 'server3:9100']

  - job_name: 'api-service'
    static_configs:
      - targets: ['localhost:8080']

  - job_name: 'web-service'
    static_configs:
      - targets: ['localhost:80', 'webserver2:80']
File Service Discovery
File-based service discovery allows the configuration of target endpoints from an external file. This is still considered static since the targets need to be defined in a separate configuration file.
Reference the targets file in the prometheus.yml file. You can specify the file or use globbing to reference the target files ending in YAML or JSON.
scrape_configs:
  - job_name: 'node-exporter'
    file_sd_configs:
      - files:
        - 'targets.json'
        - '*.json'
The file containing the targets can either be in JSON or YAML.
Example targets.json file:
[
  {
    "targets": ["localhost:9100", "server2:9100"],
    "labels": {
      "job": "node-exporter"
    }
  },
  {
    "targets": ["api-server:8080"],
    "labels": {
      "job": "api-service"
    }
  }
]
EC2 Service Discovery
EC2 service discovery allows Prometheus to automatically discover targets from AWS EC2 instances. This is useful for monitoring dynamic EC2 environments where instances can be added or removed.
Ensure that you have set up the credentials for the IAM user with the correct permissions, specifically the AmazonEC2ReadOnlyAccess policy.
Example prometheus.yml file:
scrape_configs:
  - job_name: 'ec2-instances'
    ec2_sd_configs:
      - region: <region>
        access_key: 'YOUR_ACCESS_KEY'
        secret_key: 'YOUR_SECRET_KEY'
    relabel_configs:
      - source_labels: [__meta_ec2_instance_id]
        target_label: instance
      - source_labels: [__meta_ec2_tag_Name]
        target_label: instance_name
The instance label defaults to using the private IP, as it is assumed that the Prometheus server is running within the same environment as the EC2 instances. However, if the Prometheus server is outside the environment and can only communicate with the EC2 instances via public IP, you can use the metadata to map the public IP to the instance label.
Here’s how to configure it in the prometheus.yml file:
scrape_configs:
  - job_name: 'ec2-instances'
    ec2_sd_configs:
      - region: us-west-2
        access_key: 'YOUR_ACCESS_KEY'
        secret_key: 'YOUR_SECRET_KEY'
    relabel_configs:
      - source_labels: [__meta_ec2_instance_id]
        target_label: instance
      - source_labels: [__meta_ec2_public_ip]
        target_label: instance_ip
This will map the public IP of the EC2 instances to the instance_ip label when the Prometheus server is outside the EC2 environment.
Re-labelling
Re-labeling in Prometheus allows you to modify or create new labels for metrics based on existing ones. This is useful for grouping, filtering, or enriching metrics during collection.
For example, we have the following nodes with labels:
| Node | Instance | Region |
|---|---|---|
| node1 | instance="node1:9100" | region="ap-southeast-1" |
| node2 | instance="node2:9100" | region="ap-southeast-1" |
We can use re-labelling to:
-
Drop the
regionlabel and rename theinstancelabel, so that:Node Instance node1 instance="node1" node2 instance="node2" -
Grab the
http_errors_totalmetric after the scrape and rename it tohttp_failures_total.
You can configure re-labeling in the scrape_configs section of the prometheus.yml file.
relabel_configs: Relabelling is done before a scrape and only has access to labels from Service Discovery.metric_relabel_configs: Relabelling is done after the scrape and has access to all metrics and labels.
Here's a sample prometheus.yml file:
scrape_configs:
  - job_name: 'example-job'
    static_configs:
      - targets: ['node1:9100', 'node2:9100']
    relabel_configs:
      - source_labels: [region]
        action: labeldrop
      - source_labels: [instance]
        target_label: instance
        action: replace
        replacement: '${1}'
    metric_relabel_configs:
      - source_labels: [__name__]
        target_label: __name__
        regex: 'http_errors_total'
        action: replace
        replacement: 'http_failures_total'