PushGateways
Overview
Batch jobs are short-lived and do not stay active long enough to be scraped at regular intervals. Instead of relying on scraping, these jobs push their metrics to a PushGateway, which allows Prometheus to collect the data for monitoring.
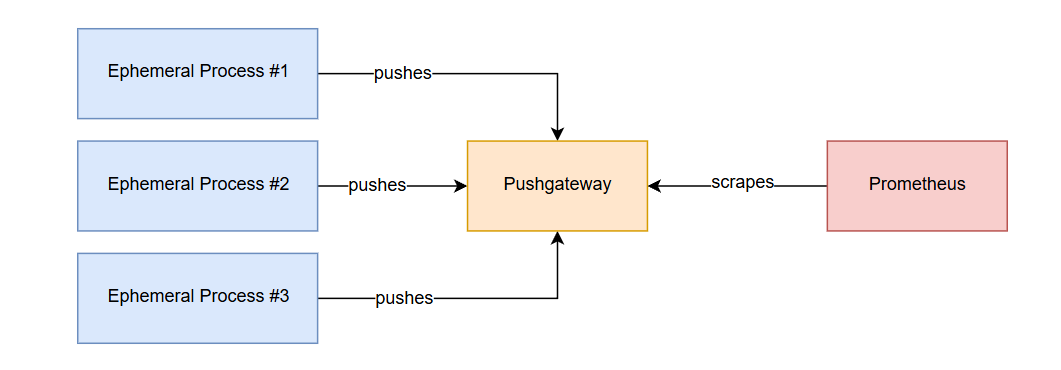
This setup is useful for jobs that run intermittently or for a short duration, ensuring that their metrics are still available for Prometheus to scrape.
Install PushGateway
To install PushGateway, follow these steps:
-
Download PushGateway from the official download page using
wgetorcurl.wget https://github.com/prometheus/pushgateway/releases/download/v1.5.0/pushgateway-1.5.0.linux-amd64.tar.gz -
After downloading, extract the files and copy the binary to
/usr/local/bin.tar xvfz pushgateway-1.5.0.linux-amd64.tar.gzcp pushgateway-1.5.0.linux-amd64/pushgateway /usr/local/bin/ -
Add a dedicated user for the PushGateway service.
useradd -M -r -s /bin/false pushgateway -
Change the permission of the copied binary.
chown pushgateway:pushgateway /usr/local/bin/pushgateway -
Start PushGateway by running the command below.
pushgatewayBy default, PushGateway will start listening on port
9091.ts=2024-12-14T03:42:41.088Z caller=main.go:100 level=info msg="starting pushgateway" version="(version=1.5.0, branch=HEAD, revision=d3f80b822d188f90bef74f2e55a3e5f01bba08d2)"ts=2024-12-14T03:42:41.088Z caller=main.go:101 level=info build_context="(go=go1.19.3, user=root@8d0a3fca0bee, date=20221124-12:52:19)"ts=2024-12-14T03:42:41.090Z caller=tls_config.go:232 level=info msg="Listening on" address=[::]:9091ts=2024-12-14T03:42:41.090Z caller=tls_config.go:235 level=info msg="TLS is disabled." http2=false address=[::]:9091 -
Open a browser or use
curlto verify that PushGateway is running:http://localhost:9091
-
To run PushGateway as a service, create a systemd unit file in
/etc/systemd/system/pushgateway.service:[Unit]Description=PushgatewayWants=network-online.targetAfter=network-online.target[Service]User=pushgatewayGroup=pushgatewayType=simpleExecStart=/usr/local/bin/pushgatewayRestart=always[Install]WantedBy=multi-user.target -
Enable and start the PushGateway service.
sudo systemctl enable pushgatewaysudo systemctl start pushgatewaysudo systemctl status pushgateway -
Verify that the PushGateway server is running by sending a request to the
/metricsendpoint.$ curl localhost:9091/metrics# HELP go_gc_duration_seconds A summary of the pause duration of garbage collection cycles.# TYPE go_gc_duration_seconds summarygo_gc_duration_seconds{quantile="0"} 0.000205514go_gc_duration_seconds{quantile="0.25"} 0.000205514go_gc_duration_seconds{quantile="0.5"} 0.000232829go_gc_duration_seconds{quantile="0.75"} 0.000232829go_gc_duration_seconds{quantile="1"} 0.000232829 -
Go back to the PushGateway console and append the
/metricsto the site URL.http:localhost:9091/metrics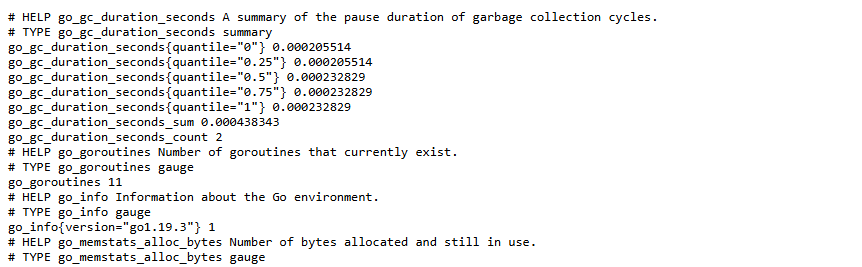
Configure Prometheus
After PushGateway is installed and running, you need to configure Prometheus to scrape it.
-
Open
/etc/prometheus/prometheus.ymland add:scrape_configs:- job_name: 'pushgateway'honor_labels: truestatic_configs:- targets: ['pushgateway-ip:9091']The
honor_labelsensures that the metric labels from any batch job sending to the PushGateway are retained and not overwritten by those of PushGateway. -
Restart Prometheus to apply the changes:
sudo systemctl restart prometheus -
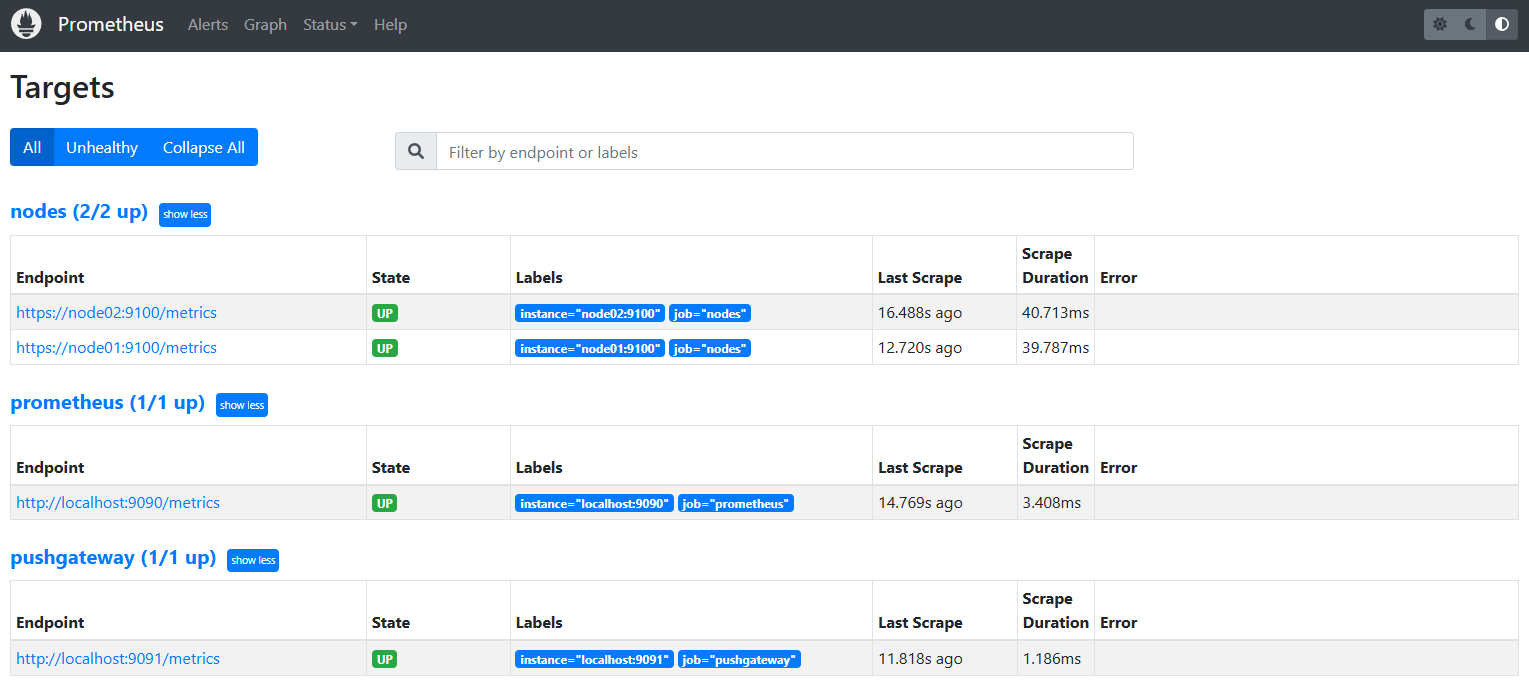
Access the Prometheus console and go to Status > Targets. You should see the pushgateway here.
Push Metrics from Batch Jobs
Once Prometheus is configured to scrape PushGateway, you can push metrics from batch jobs using any of the following methods:
- Send HTTPs requests to PushGateway
- Use Prometheus Client Libraries
Sending HTTP Requests
Send the following HTTP POST request using the following URL:
http://<push-gateway-address>:<port>/metrics/job/<job-name>/<label1>/<value1>/<label2>/<value2>
The job-name is the job label of the metrics pushed, while the label and valueis used as grouping key - allows for grouping metrics together to update/delete multiple metrics at once.
Using Client Libraries
Follow the steps below:
- Install the client library (depending on the language of your batch job)
- Use the library to push metrics to PushGateway.
Example in Python:
from prometheus_client import CollectorRegistry, Gauge, push_to_gateway

registry = CollectorRegistry()
g = Gauge('batch_job_duration_seconds', 'Job duration in seconds', registry=registry)
g.set(3.14)  # Set the metric value
push_to_gateway('pushgateway:9091', job='batch_jobs', registry=registry)
This will push the metric batch_job_duration_seconds with a value of 3.14 to the PushGateway.
Sending HTTP Requests
Sending a Metric
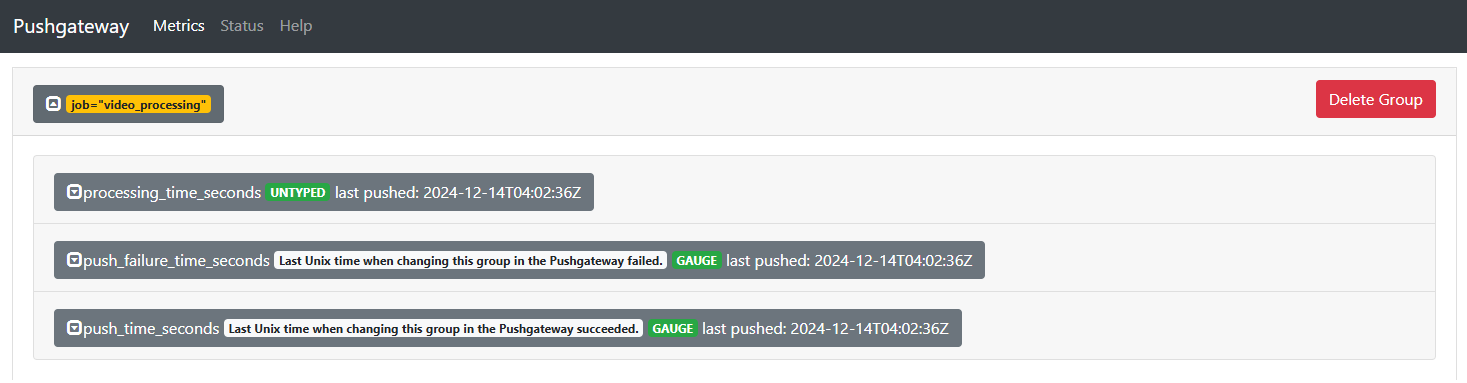
Push a metric "processing_time_seconds 120" with a job label of video_processing.
echo "processing_time_seconds 120" | curl --data-binary @- http://localhost:9091/metrics/job/video_processing
In this example, the metric has to be passed as a binary data. The @- then tells curl to read the binary data from standard input.
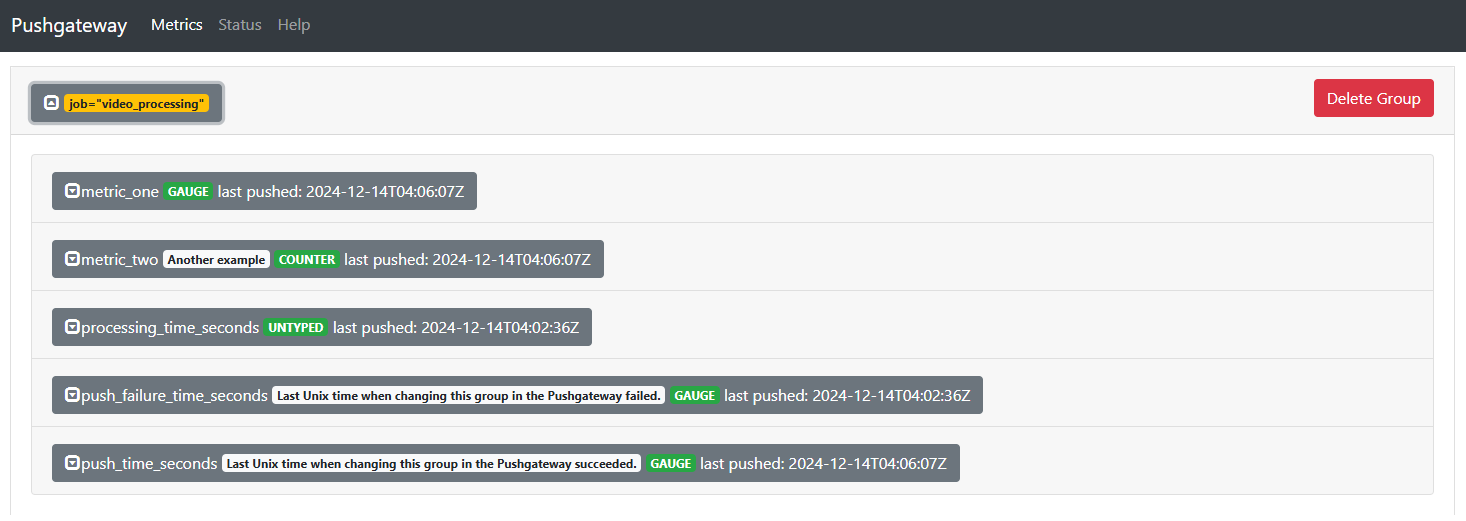
Open the PushGateway console and go to Metrics. Click the new job to display the pushed metrics.
Sending Multiple Metrics
Let's now push multiple metrics to the same job.
cat << EOF | curl --data-binary @- http://localhost:9091/metrics/job/video_processing

# TYPE metric_one gauge
metric_one{label="value1"} 23
# TYPE metric_two counter
# HELP metric_two Another example
metric_two 41
EOF
Go back to the Pushgateway console and verify that the new metrics have been added.
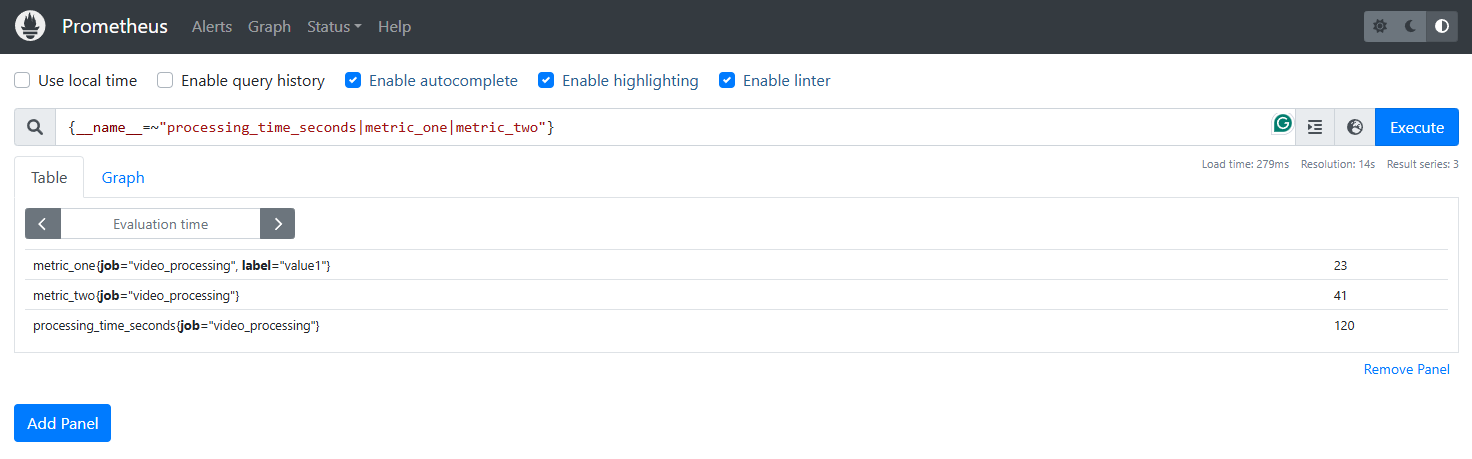
Verify that Prometheus scraped the Metrics
Now open the Prometheus console and enter the metrics name in the expression browser.
{__name__=~"processing_time_seconds|metric_one|metric_two"}
Grouping
The URL path job_name + labels acts as a grouping key in PushGateway. Groups allow you to update or delete multiple metrics at once. All metrics sent to the same URL path are part of the same group.
http://<push-gateway-address>:<port>/metrics/job/<job-name>/<label1>/<value1>/<label2>/<value2>
Sending Metrics to Groups
The following example sends metrics for the backup job:
cat << EOF | curl --data-binary @- http://localhost:9001/metrics/job/backup/db/psql
# TYPE metric_one counter
metric_one{label="value1"}  11
# TYPE metric_two gauge
# HELP metric_two Another example
metric_two  100
EOF
Here:
- The job name is
backup, and the URL represents one group:/job/backup/db/psql - Metrics in this group:
metric_one{label="value1"} 11metric_two 100
Now, send another request for the backup job, but with a different URL:
cat << EOF | curl --data-binary @- http://localhost:9001/metrics/job/backup/app/web
# TYPE metric_one counter
metric_one{label="value1"}  22
# TYPE metric_two gauge
# HELP metric_two Another example
metric_two  100
EOF
Since the URL is different, this creates a new group:
/job/backup/app/web
Metrics in this group:
metric_one{label="value1"} 22metric_two 100
Viewing the Metrics
When filtering for the backup job on the Prometheus server, metrics are grouped by their respective URLs:
$ curl prometheus-ip:9091/metrics | grep backup

metric_one{db="psql", instance="", job="backup", label="value1"}  11
metric_two{db="psql", instance="", job="backup"}  100
metric_one{app="web", instance="", job="backup", label="value1"}  22
metric_two{app="web", instance="", job="backup"}  100
Using POST
When sending a POST request, only metrics with the same name in the same group are replaced. Other metrics remain unaffected.
Consider the initial metrics for the backup job:
$ curl prometheus-ip:9091/metrics | grep backup

metric_one{db="psql", instance="", job="backup", label="value1"}  11
metric_two{db="psql", instance="", job="backup"}  100
metric_one{app="web", instance="", job="backup", label="value1"}  22
metric_two{app="web", instance="", job="backup"}  100
Send a new request to update a metric in the /job/backup/app/web group:
cat << EOF | curl --data-binary @-http://localhost:9001/metrics/job/backup/app/web
# TYPE metric_one counter
metric_one{label="value1"}  44
EOF
After the update, only the specified metric in the group is replaced:
$ curl prometheus-ip:9091/metrics | grep backup

metric_one{db="psql", instance="", job="backup", label="value1"}  11
metric_two{db="psql", instance="", job="backup"}  100
metric_one{app="web", instance="", job="backup", label="value1"}  44
metric_two{app="web", instance="", job="backup"}  100
Using PUT
When sending a PUT request, all metrics within a specific group are replaced by the new metrics being pushed. This operation removes all pre-existing metrics in the group and replaces them entirely.
Consider the initial metrics for the archive job which includes multiple metrics across different groups:
$ curl prometheus-ip:9091/metrics | grep archive

metric_one{db="psql", instance="", job="archive", label="value1"}  11
metric_two{db="psql", instance="", job="archive"}  100
metric_one{app="web", instance="", job="archive", label="value1"}  22
metric_two{app="web", instance="", job="archive"}  100
metric_three{app="web", instance="", job="archive"}  300
To update metrics in the /job/archive/app/web group, send a PUT request with the new data:
cat << EOF | curl -X PUT --data-binary @- http://localhost:9001/metrics/job/archive/app/web
# TYPE metric_one counter
metric_one{label="value1"}  53
EOF
After the PUT request, only the new metric is retained in the /job/archive/app/web group. All pre-existing metrics in this group are removed:
$ curl prometheus-ip:9091/metrics | grep archive

metric_one{db="psql", instance="", job="archive", label="value1"}  11
metric_two{db="psql", instance="", job="archive"}  100
metric_one{app="web", instance="", job="archive", label="value1"}  53
The metrics metric_two and metric_three from the /job/archive/app/web group are deleted and replaced by the newly pushed metric_one.
Using DELETE
When you send a DELETE request, all metrics within the specified group are removed.
Let's use the same archive job from the previous example.
$ curl prometheus-ip:9091/metrics | grep archive

metric_one{db="psql", instance="", job="archive", label="value1"}  11
metric_two{db="psql", instance="", job="archive"}  100
metric_one{app="web", instance="", job="archive", label="value1"}  22
metric_two{app="web", instance="", job="archive"}  100
metric_three{app="web", instance="", job="archive"}  300
To delete all metrics in the /job/archive/app/web group, send a DELETE request:
curl -X DELETE http://localhost:9001/metrics/job/archive/app/web
After the DELETE request, all metrics in the /job/archive/app/web group are removed, leaving only metrics from other groups:
$ curl prometheus-ip:9091/metrics | grep archive

metric_one{db="psql", instance="", job="archive", label="value1"}  11
metric_two{db="psql", instance="", job="archive"}  100
Metrics metric_one, metric_two, and metric_three from the /job/archive/app/web group are successfully deleted.
Using Client Libraries
Client libraries can be used to push metrics to PushGateway. The table below summarizes the key functions available in the client library:
| Function | Description | Equivalent HTTP Request |
|---|---|---|
push | Removes existing metrics for a job and adds the new metrics pushed | PUT |
pushadd | Pushes metrics, overriding only metrics with the same name. Others remain unchanged | POST |
delete | Deletes all metrics in a specified group | DELETE |
Below is an example of how to use these functions in Python with the prometheus_client library:
from prometheus_client import CollectorRegistry, Counter, push_to_gateway, delete_from_gateway

registry = CollectorRegistry()
c = Counter('example_metric', 'An example metric', registry=registry)

c.inc()

# Push metrics using `push` (replaces the entire group)
push_to_gateway('http://localhost:9091', job='example_job', registry=registry)
print("Metrics pushed using 'push'")

# Push metrics using `pushadd` (overrides only metrics with the same name)
push_to_gateway('http://localhost:9091', job='example_job', registry=registry, method='POST')
print("Metrics pushed using 'pushadd'")

# Delete metrics for the specified job
delete_from_gateway('http://localhost:9091', job='example_job')
print("Metrics deleted for 'example_job'")
Explanation:
-
Initialize Registry and Metric:
- A
CollectorRegistryis created to store the metrics. - A
Countermetric (example_metric) is defined and incremented usingc.inc().
- A
-
Using
push:- Metrics are pushed to the PushGateway using the
push_to_gatewayfunction. - This replaces all existing metrics for the specified job with the new metrics in the registry.
- Metrics are pushed to the PushGateway using the
-
Using
pushadd:- The same
push_to_gatewayfunction is used, but withmethod='POST'. - This adds or updates only the metrics in the registry while leaving other metrics in the same group unchanged.
- The same
-
Using
delete:- Metrics for the specified job are deleted from PushGateway using
delete_from_gateway.
- Metrics for the specified job are deleted from PushGateway using