Setting up Prometheus Exporters
Overview
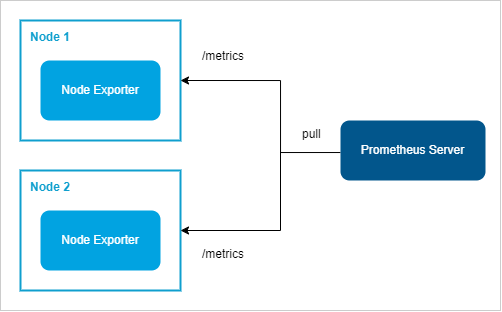
Exporters are installed on target nodes to expose metrics that Prometheus can scrape. They act as intermediaries that translate system or application data into Prometheus-compatible formats.
Lab Environment
Pre-requisites
- Setup Prometheus
- Two Linux nodes to be configured as targets
Steps
Login to the individual nodes as root user and follow the steps below:
-
Identify the Node Exporter (for system metrics) or application-specific exporters like MySQL Exporter.
-
On each target node, download the relevant exporter from the Prometheus exporter repository.
wget https://github.com/prometheus/node_exporter/releases/download/v1.4.0/node_exporter-1.4.0.linux-amd64.tar.gz -
Extract the tar file and move the binary to a directory in the system's
PATH:tar xvf node_exporter-1.4.0.linux-amd64.tar.gzcd node_exporter-1.4.0.linux-amd64cp node_exporter /usr/bin/ -
Test it by running the exporter:
node_exporterOutput:
caller=node_exporter.go:199 level=info msg="Listening on" address=:9100caller=tls_config.go:195 level=info msg="TLS is disabled." http2=false -
Open another terminal and run a
curlcommand:curl localhost:9100/metricsIt should show a long list of metrics:
# HELP promhttp_metric_handler_requests_total Total number of scrapes by HTTP status code.# TYPE promhttp_metric_handler_requests_total counterpromhttp_metric_handler_requests_total{code="200"} 5promhttp_metric_handler_requests_total{code="500"} 0promhttp_metric_handler_requests_total{code="503"} 0 -
For security, create a dedicated user and group:
groupadd -f node_exporteruseradd --no-create-home --shell /bin/false -g node_exporter node_exporter -
Change permissions of the binary:
chown node_exporter:node_exporter /usr/bin/node_exporter -
Create a systemd service for the exporter
vi /etc/systemd/system/node_exporter.serviceAdd the following content:
[Unit]Description=NodeExporterWants=network.targetAfter=network.target[Service]User=node_exporterGroup=node_exporterType=simpleExecStart=/usr/bin/node_exporter[Install]WantedBy=multi-user.target -
Update permissions of the systemd unit file.
chmod 664 /etc/systemd/system/node_exporter.service -
Start the exporter and enable it to run at boot:
systemctl daemon-reloadsystemctl enable --now node_exportersystemctl status node_exporter -
Open a browser and navigate to
http://<node_ip>:9100/metricsto confirm the exporter is running and exposing metrics.
-
Login to the Prometheus server. Add the node IP and port to Prometheus's
/etc/prometheus/prometheus.ymlfile underscrape_configs:scrape_configs:- job_name: "node_exporter"static_configs:- targets:- <node1_ip>:9100- <node2_ip>:9100Restart Prometheus to apply the configuration:
systemctl restart prometheussystemctl status prometheus -
Check Prometheus’s web interface to verify the targets are listed and metrics are being collected.
http://<your_vm_ip>:9090`In the expression field, type
upand click Execute. If the value on the right are all zeroes, it means the metrics are not being scraped. If the valueis1, then metrics are successfully scraped.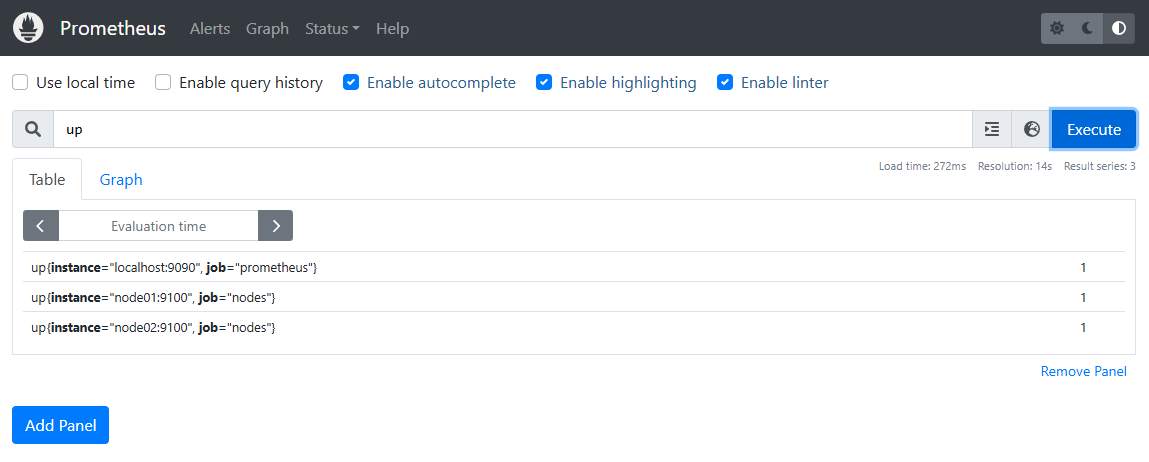
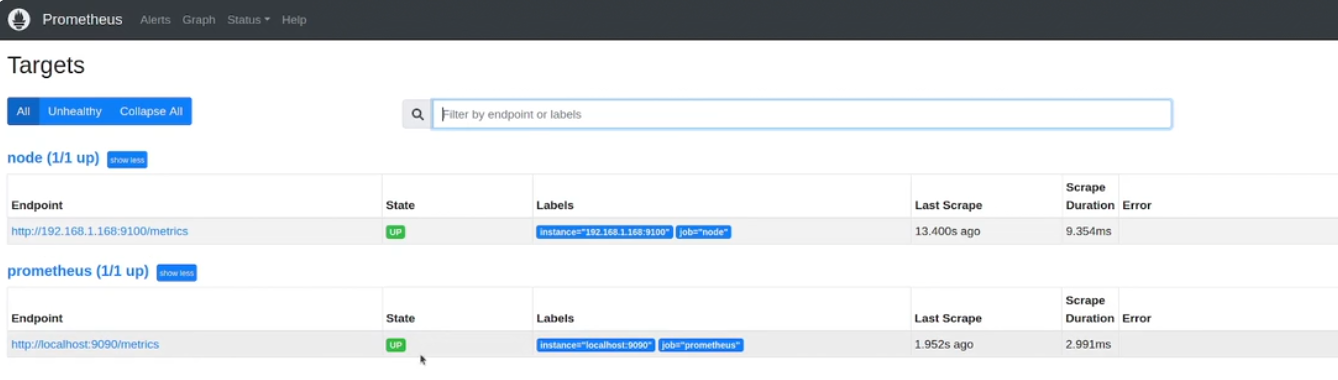
-
Click Status > Targets to see the scrape status. You may need to refresh it to reflect all the targets.