Installing Prometheus
Overview
Prometheus can be installed on a virtual machine (VM) to monitor system performance and applications.
Pre-requisites
- A Linux-based VM with internet access
- Basic understanding of Linux
- Sufficient disk space to store metrics data.
Steps
Login to the Prometheus server as root user and follow the steps below:
-
Download the Prometheus tar file from the Prometheus official download page.
wget https://github.com/prometheus/prometheus/releases/download/v2.40.1/prometheus-2.40.1.linux-amd64.tar.gz -
Extract the downloaded file using
tar:tar xvf prometheus-2.40.1.linux-amd64.tar.gzcd prometheus-2.40.1.linux-amd64 -
For security, create a dedicated user to run Prometheus:
useradd --no-create-home --shell /bin/false prometheus -
Create directories for Prometheus data:
mkdir -p /etc/prometheusmkdir /var/lib/prometheus -
Copy files to
/usr/local/binor a custom directory:cp prometheus promtool /usr/local/bin/cp prometheus.yml /etc/prometheus/ -
Copy the directories
consolesandconsole_libraries:cp -r consoles /etc/prometheuscp -r console_libraries /etc/prometheus -
Assign the correct permissions:
chown prometheus:prometheus /usr/local/bin/prometheuschown prometheus:prometheus /usr/local/bin/promtoolchown prometheus:prometheus /var/lib/prometheuschown -R prometheus:prometheus /etc/prometheus -
Define a systemd unit file to manage Prometheus as a service:
vi /etc/systemd/system/prometheus.service
Add the following content:
[Unit]
Description=Prometheus
Wants=network.target
After=network.target

[Service]
User=prometheus
Group=prometheus
Type=simple
ExecStart=/usr/local/bin/prometheus \
 --config.file /etc/prometheus/prometheus.yml \
 --storage.tsdb.path /var/lib/prometheus/ \
 --web.console.templates=/etc/prometheus/consoles \
 --web.console.libraries=/etc/prometheus/console_libraries

[Install]
WantedBy=multi-user.target
- Reload systemd, start Prometheus, and enable it on boot:
systemctl daemon-reload
systemctl enable --now prometheus
systemctl status prometheus
-
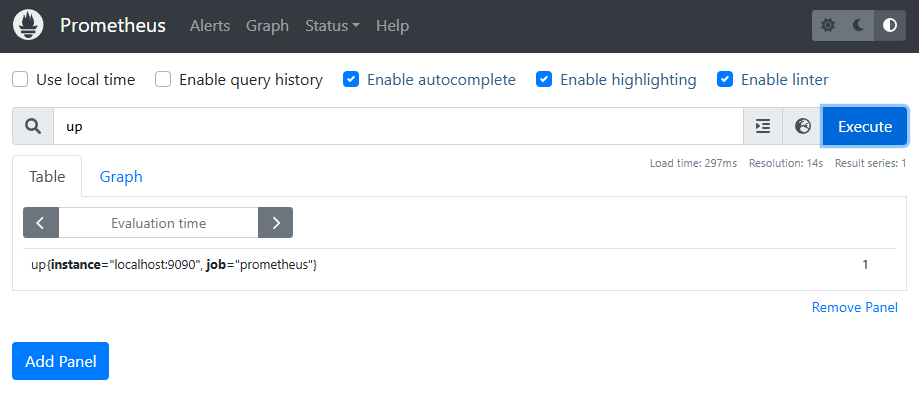
Open a web browser and navigate to the link below:
http://<your_vm_ip>:9090`To ensure it is working correctly, we can type
upin the expression field and then hit Execute. It should return the following output, and a value of 1 at the right side. By default, Prometheus is configured to scrape and monitor its own metrics.