Visualization
Overview
Visualization refers to the process of displaying collected metric data in a clear and understandable format to aid in system analysis and monitoring.
- Supports visualizing metric trends over time through its web interface.
- Users can create personalized views to track specific metrics.
- Prometheus can trigger alerts based on visualized data for quick responses.
Several ways to visualize Prometheus data include:
- Expression browser
- Console templates
Third-party tools:
- Grafana
Expression Browser
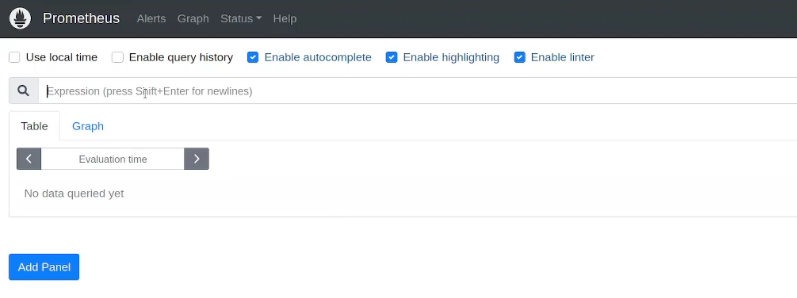
The Expression Browser in Prometheus allows users to run PromQL queries and visualize the results directly within the Prometheus web interface.
- It helps in exploring and testing metric data.
- Allows users to interactively query time series data.
- Useful for troubleshooting and inspecting specific metrics.
Note that it has limited functionality and is best suited for ad-hoc queries and quick debugging. It cannot create custom dashboards and is not recommended for daily monitoring. To access the expression browser, simply go to the Prometheus console. The field with the "Expression" text is the expression browser.
Sample PromQL Commands
-
Shows the status of all targets, returning
1for healthy targets and0for down targets.up -
Returns the total number of HTTP requests across all instances.
http_requests_total -
Retrieves the active memory usage (in bytes) averaged over the last 5 minutes.
node_memory_Active_bytes(5m) -
Shows the CPU usage rate over the last 5 minutes.
rate(node_cpu_seconds_total[5m])
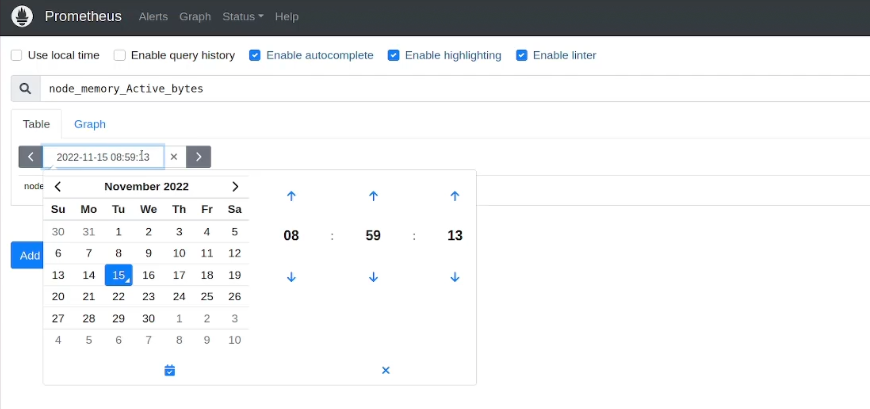
Setting the Timerange
To set the time period, click the dropdown bar and select the date.
Plotting
You can use the rate function to plot the metric with the specified timerange. The 5m specifies the past 5 minutes.
rate(node_memory_Active_bytes(5m))
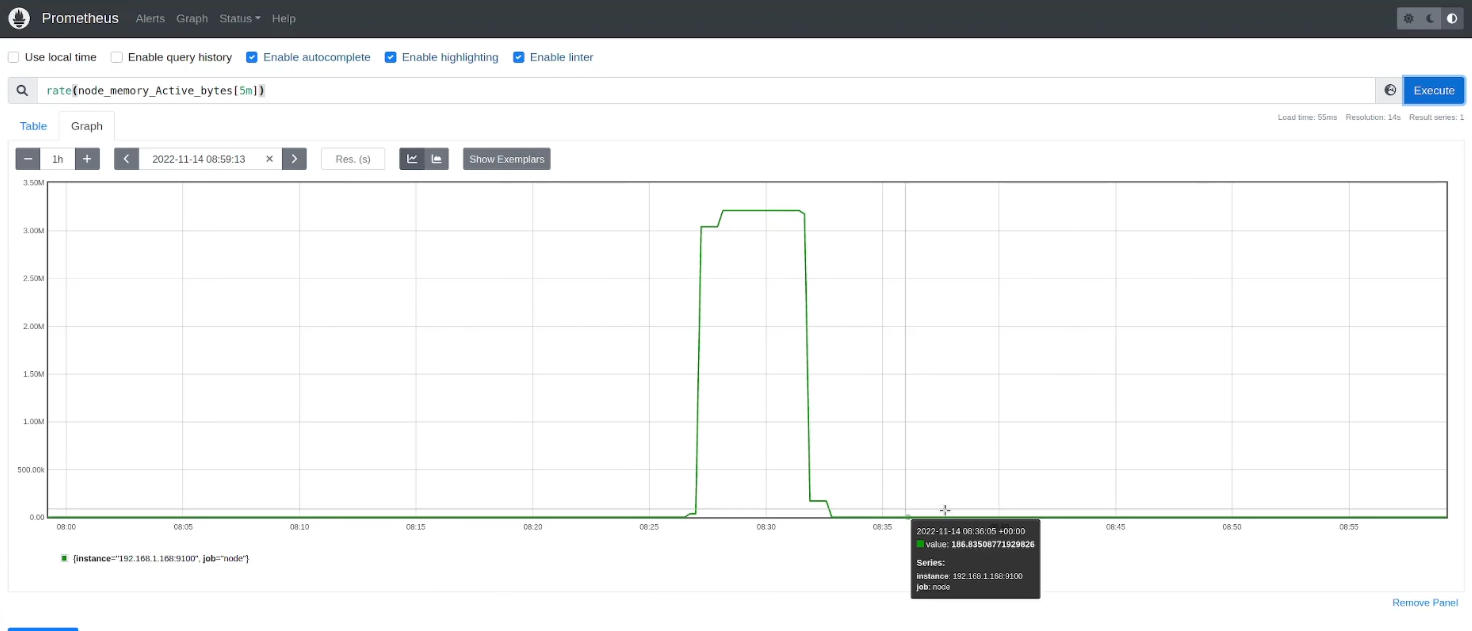
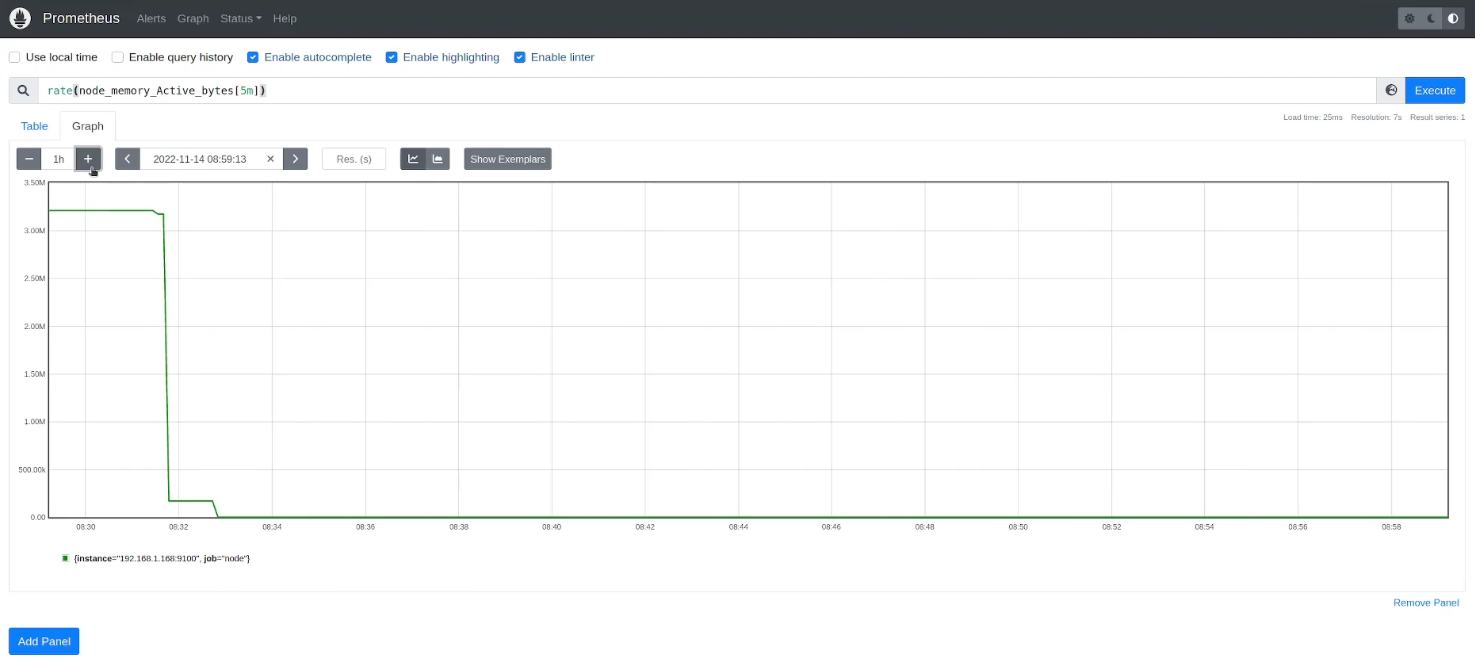
To change the window of the graph, click the plus (+) or minus (-) sign at the left side.
Console Templates
Console templates let you design custom HTML pages for visualizing Prometheus data using the Go templating language.
- Enable dynamic views of metric data.
- Allow integration of custom styles and layouts.
- Useful for creating tailored monitoring dashboards.
To see the pre-built console templates, go to:
$ ls /etc/prometheus/consoles

drwxr-xr-x 2 prometheus prometheus 4096 Oct 7 12:24 .
drwxr-xr-x 5 prometheus prometheus 4096 Oct 17 22:23
-rw-r--r-- 1 prometheus prometheus 616 Oct 7 12:24 index.html.example
-rw-r--r-- 1 prometheus prometheus 2675 0ct 7 12:24 node-cpu.html
-rw-r--r-- 1 prometheus prometheus 3522 0ct 7 12:24 node-disk.html
-rw-r--r-- 1 prometheus prometheus 1453 Oct 7 12:24 node.html
-rw-r--r-- 1 prometheus prometheus 5783 Oct 7 12:24 node-overview.html
-rw-r--r-- 1 prometheus prometheus 1334 0ct 7 12:24 prometheus.html
-rw-r--r-- 1 prometheus prometheus 4103 Oct 7 12:24 prometheus-overview. html
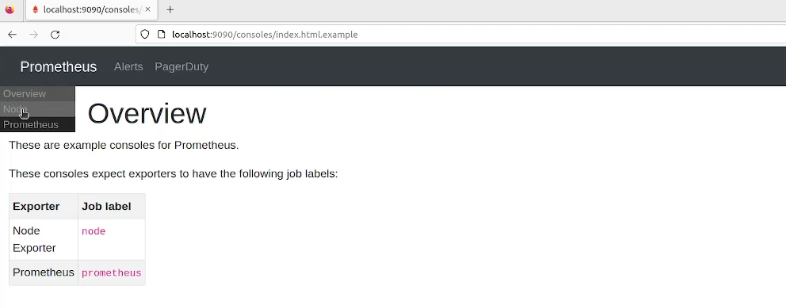
Sample Console Template
Below is an example index.html.template. The keyword template works like the import keyword in programming languages, allowing you to include and reuse other templates within your console design.
{{template "head" .}}
{{template "prom_right_table_head"}}

<tr>
  <th>MyJob</th>
  <th>{{ template "prom_query_drilldown" (args "sum(up{job='myjob'})") }}
      / {{ template "prom_query_drilldown" (args "count(up{job='myjob'})") }}
  </th>
</tr>
<tr>
  <td>CPU</td>
  <td>{{ template "prom_query_drilldown" (args
      "avg by(job)(rate(process_cpu_seconds_total{job='myjob'}[5m]))"
      "s/s" "humanizeNoSmallPrefix") }}
  </td>
</tr>
<tr>
  <td>Memory</td>
  <td>{{ template "prom_query_drilldown" (args
       "avg by(job)(process_resident_memory_bytes{job='myjob'})"
       "B" "humanize1024") }}
  </td>
</tr>
{{template "prom_right_table_tail"}}


{{template "prom_content_head" .}}
<h1>MyJob</h1>

<h3>Queries</h3>
<div id="queryGraph"></div>
<script>
new PromConsole.Graph({
  node: document.querySelector("#queryGraph"),
  expr: "sum(rate(http_query_count{job='myjob'}[5m]))",
  name: "Queries",
  yAxisFormatter: PromConsole.NumberFormatter.humanizeNoSmallPrefix,
  yHoverFormatter: PromConsole.NumberFormatter.humanizeNoSmallPrefix,
  yUnits: "/s",
  yTitle: "Queries"
})
</script>

{{template "prom_content_tail" .}}

{{template "tail"}}
Access Template from the Console
To access the sample console templates, open a web browser and go to the link below and append the template that you want to see
https://ip-address-of-prometheus-server:9090/consoles/name-of-template
Creating the Template
To learn how to create a console template, please see Console Tempaltes.