Model Evaluation
Model Evaluation
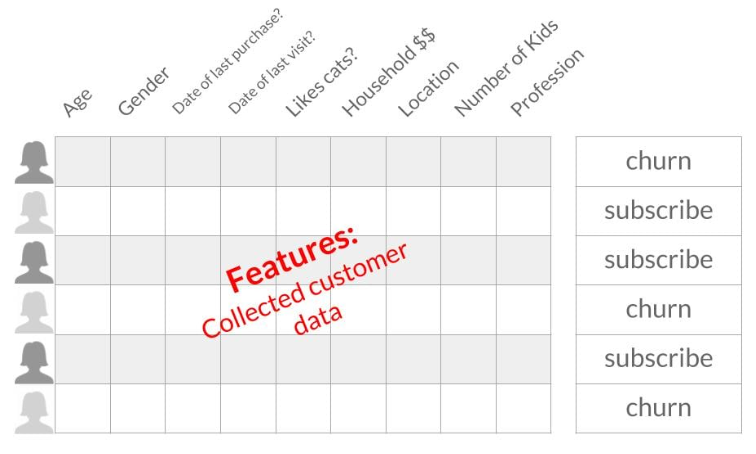
Machine learning aims to make predictions based on data, and supervised machine learning is a type where the data includes both labels and features.
- Labels are the outcomes we want to predict, such as whether a customer will cancel their subscription.
- Features are pieces of information that might help make these predictions, like age or last purchase date.
Examples:
- Recommendation systems
- Diagnosing biomedical images
- Recognizing hand-written digits
- Predicting customer churn
Case Study: Churn Prediction
In a subscription business, we want to predict if a customer will cancel.
- Gather historical data with labels (cancelled or not)
- Gather data with features (e.g., age, gender, income).
- Train our model using this data to understand patterns that indicate cancellation.
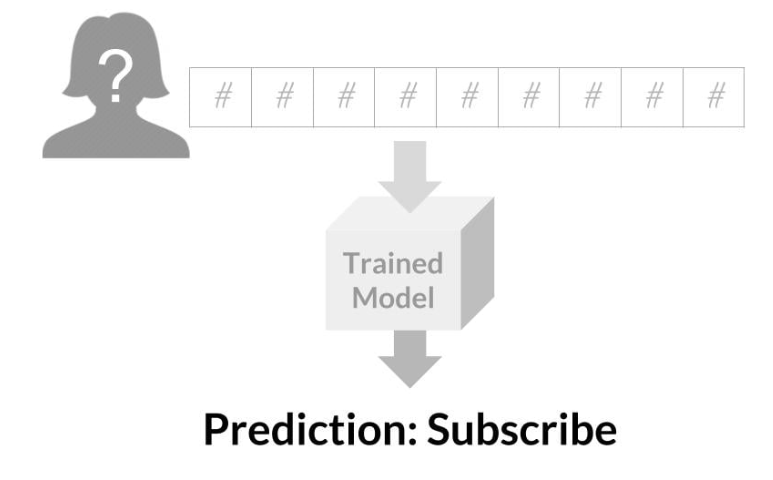
- Use the model to predict if a new customer is likely to churn and take action if needed.
Features like age, gender, last purchase date, and household income can help predict cancellations. The strength of machine learning lies in its ability to analyze multiple features simultaneously. By using these features and labels, we train the model to make predictions on new data.
We can then input this data into our trained model, which then provides a prediction. If the model indicates that the customer isn’t at risk of churning, we can expect their revenue for the next month. However, if the model predicts they might churn, we can proactively reach out to try to retain their subscription.
Evaluating Model Performance
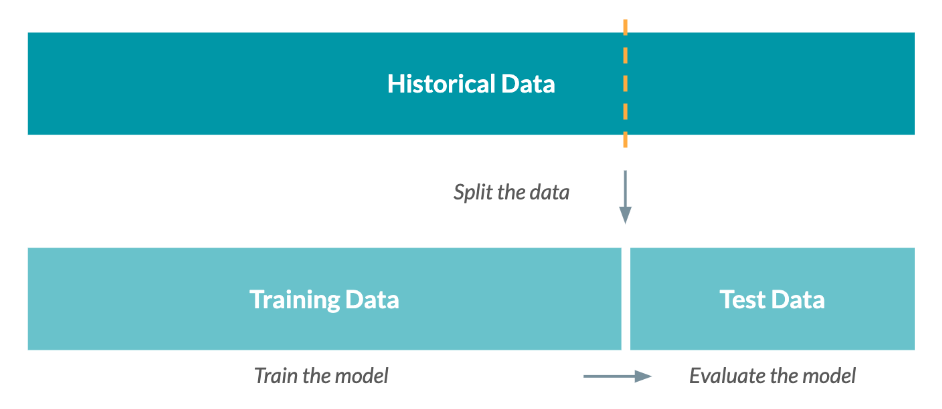
After training a model, it's important to reserve some of your historical data for testing rather than using it all for training. This reserved data, known as a test set, allows us to evaluate how well the model performs.
For instance, we can use the model to predict which customers might churn and then check how accurate these predictions are.
Remarks:
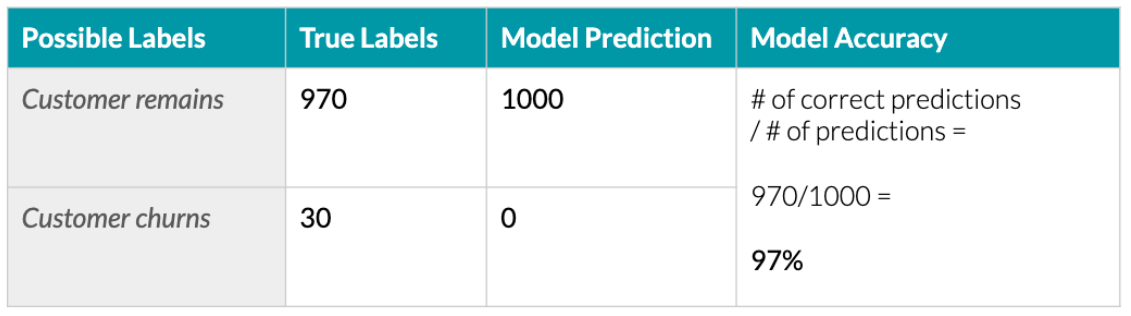
- The model shows a high overall accuracy of 97%, being correct on 970 out of 1000 customers.
- However, it failed to correctly identify any customers who actually churned.
- For rare events, it’s crucial to evaluate the accuracy for each outcome separately.
- The model’s accuracy in predicting churn is 0%, indicating it’s not effective for this task.
If the model's performance is not satisfactory, it may need retraining with different parameters or more data.
Overfitting
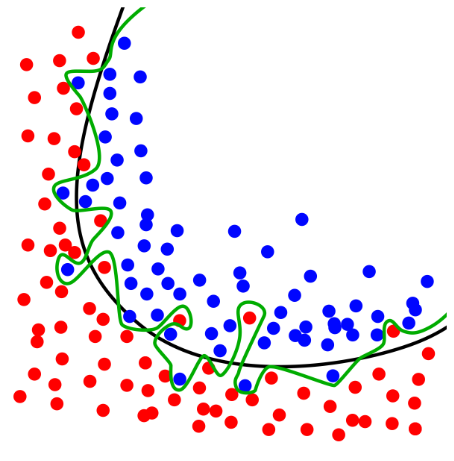
Overfitting is when a model performs well on training data but poorly on testing data, meaning it can't generalize to new data. This is why we split our dataset into training and testing sets. The testing data sets is to check the model performance.
See example below. The green line overfits by classifying all points perfectly on the training set but performs poorly on unseen data. The black line makes more errors on the training set but generalizes better.
 |
|---|
Accuracy
Accuracy measures the model performance by dividing the number of correctly predicted observations by the total number of observations. Example: 48 correct out of 50 gives 96% accuracy.
48/50 = 0.96 or 96%
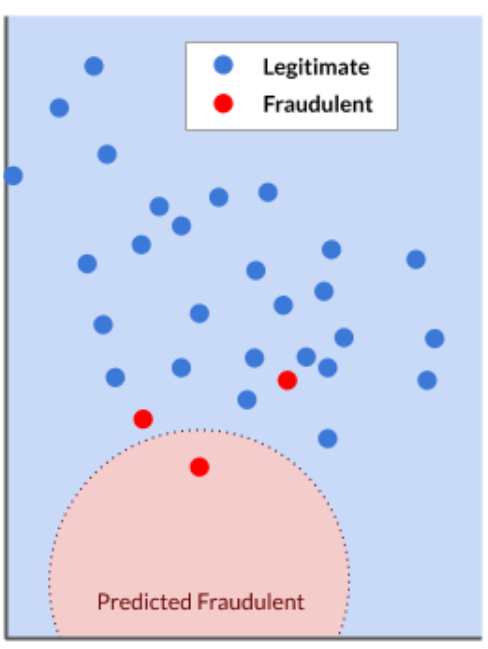
Note that accuracy isn't always the best metric, especially in cases like fraud detection where fraudulent transactions are a small minority. A model could have high accuracy but still miss most fraudulent transactions.
In the example below, we have 30 points but only two points was misclassified. This makes the mode 93.33% accurate, which sounds good but it actually missed a majority of the actual fraudulent transactions. This can become a problem if this model is deployed in the real world.
28/30 = 0.93333 or 93.33 %
 |
|---|
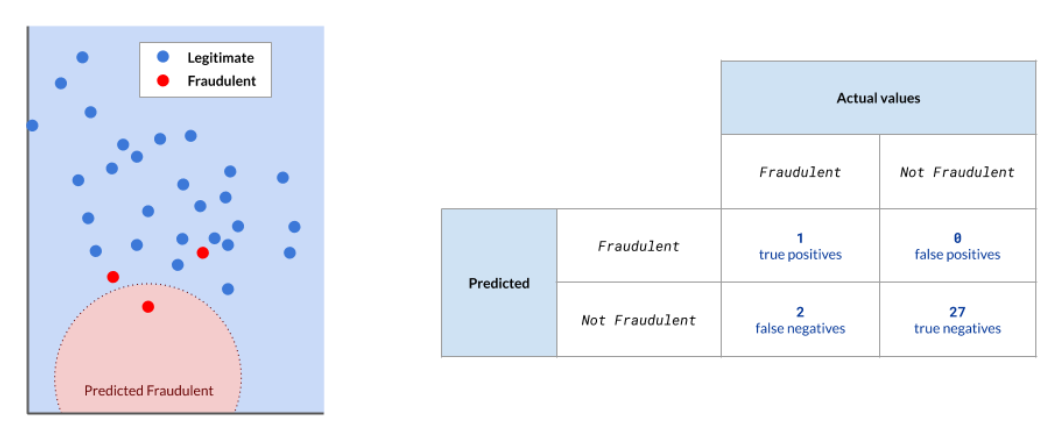
Confusion Matrix
A confusion matrix helps evaluate model performance beyond accuracy.
| Category | Description |
|---|---|
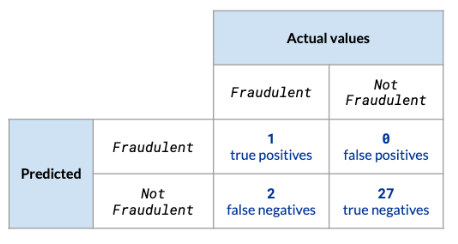
| True Positives | Correctly classified fraudulent points |
| False Negatives | Fraudulent observations incorrectly classified as legitimate |
| False Positives | Legitimate points incorrectly predicted as fraudulent |
| True Negatives | Legitimate points correctly predicted as not fraudulent |
Remembering False Positives and False Negatives
- False Negatives: Like telling a pregnant woman she's not pregnant.
- False Positives: Like telling a man he's pregnant.
Using the same example on fraudulent transactions, we can tally the true positives and negatives, as well as the false ones.
For more information, please see Analyzing Vulnerabilities
Sensitivity and Specificity
In addition to accuracy, we can also use sensitivity and specificity as metrics to evaluate our models.
Sensitivity focuses on correctly predicting fraudulent transactions (true positives).
Formula:
Sensitivity = true positives / (true positives + false negatives)
Using the previous fraudulent transactions example, we can see that it has 3% sensitivity, which means the model needs improvement.
Sensitivity = 1 / (1 + 2) = 1 / 3 or 3%
Specificity focuses on correctly predicting legitimate transactions (true negatives).
- Useful for scenarios like spam filters.
- Send spam to inbox rather than send real emails to the spam folder.
Formula:
Specificity = true negatives / (true negatives + false positives)
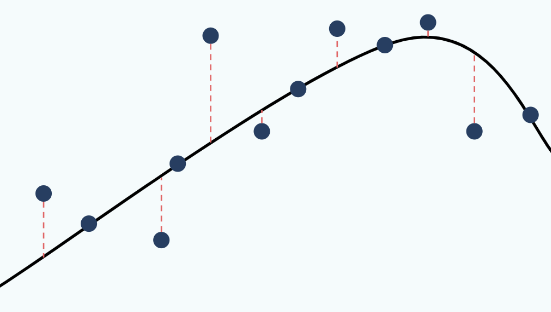
Evaluating Regression
To evaluate regression, we need to measure the difference between the point (actual value) and the line (predicted values), often using metrics like root mean square error.
 |
|---|
Evaluating Unsupervised Learning
Unsupervised learning doesn't have predicted variables, so performance is assessed based on how well the results meet the initial objective.