Supervised Learning
Overview
Supervised learning teaches a model to make predictions using labeled data. It is useful for problems where past data can guide future decisions.
- Models learn patterns from historical data
- Can predict categories or numeric values
- Relies on known outcomes to make accurate predictions.
Classification
Classification assigns a category to new data based on past examples. This is useful for predicting discrete outcomes such as customer churn, cancer diagnosis, or wine type.
- Helps predict categories accurately by learning from known data.
- Requires pre-labeled data to train models
Types of Classification
Classification problems vary in complexity depending on how many categories the data can belong to. They can be grouped based on whether there are two options or multiple options.
-
Binary classification
- Two possible classes per observation
- Example: Predict if a penguin is Gentoo or not
-
Multi-class classification
- Choose from several classes
- Example: Classify penguins into three species
Key Concepts in Classification
-
Observations
- Individual data points used for prediction
- Example: College applications
-
Features
- Variables used to predict outcomes, like GPA or test scores
- Help the model distinguish between categories
-
Target
- The outcome to predict
- Example: Accepted or rejected
-
Graphing Data
- Visualize data points to see patterns
- Example: GPA vs test scores
-
Splitting Data
- Use part of data for training and part for testing
- Common split: 80% training, 20% testing
-
Manual Classifier
- Simple way to classify points based on observation
- Visual example: draw a threshold line on a graph
-
Support Vector Machine (SVM)
- Linear: straight line separates classes
- Polynomial: curved line for better separation
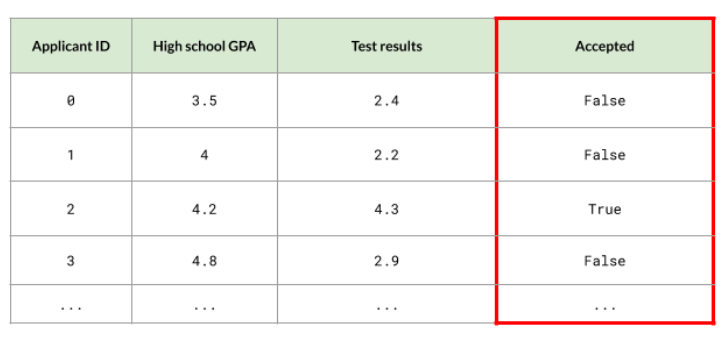
Case Study: College Admissions
As an example, we'll try to predict acceptance in college admissions. We have two features here, but we can have more if we like.
- GPA
- Admission test results
The "Accepted" column is the target that we want to predict. It can have two labels: True or False.
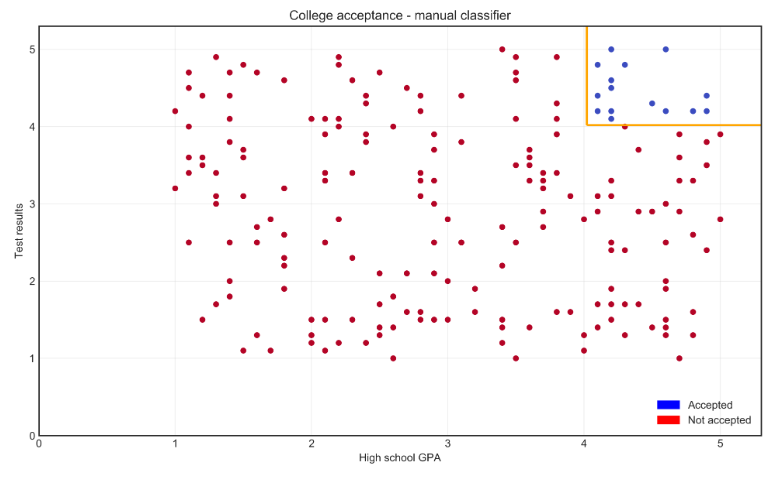
Using Manual Classifier
A manual classifier is a simple way to separate data using basic rules and visual observation.
- Plot GPA on the x-axis and test results on the y-axis
- Use 80% of the data for training, 20% for testing
- Simple rule: students with GPA ≥4 and high test scores are accepted
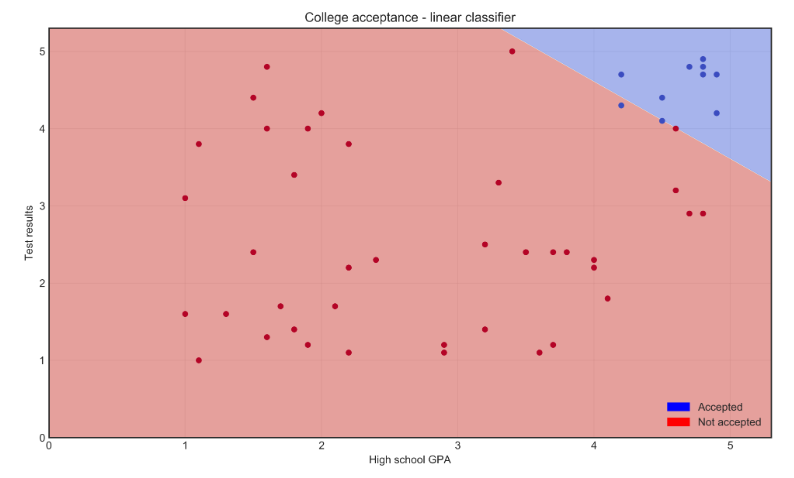
Using Linear Classifier
Linear classifiers separate data using a straight line. They are suitable when the classes can be divided linearly.
- SVM draws a straight line to separate classes
- Some points may be misclassified
- Works best when classes are linearly separable
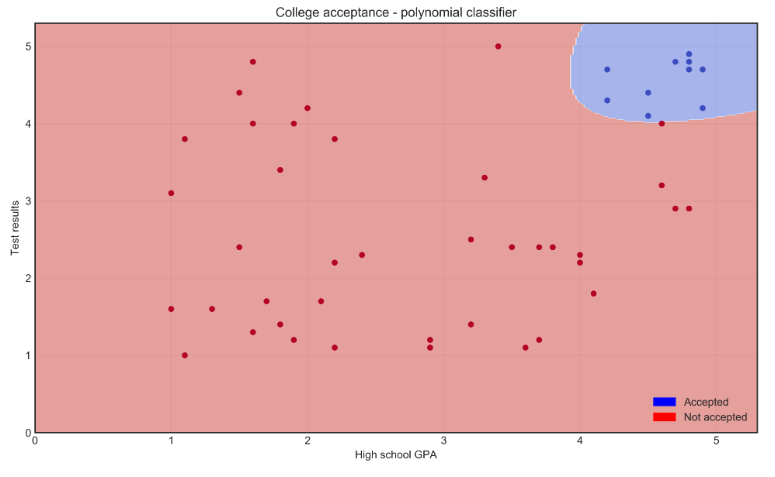
Using Polynomial Classifier
Polynomial classifiers use curved lines to handle more complex data distributions.
- Uses a curved line to better separate points
- Improves accuracy when data is not linearly separable
- Captures patterns that a straight line cannot
Regression and Forecasting
Regression predicts numeric outcomes, while forecasting estimates future values based on past trends. These techniques are useful for planning, analysis, and decision-making.
-
Regression
- Predicts a continuous numeric variable
- Example: Estimate house prices using size, location, and number of rooms
-
Time Series Forecasting
- Uses historical data to predict future values
- Example: Forecast daily bus passengers for the next month
Key Concepts in Regression and Forecasting
Regression and forecasting provide insights for planning and understanding numeric trends and make predictions for planning and analysis.
-
Predicting Temperature
- Helps anticipate environmental conditions
- Example: Weather data to predict temperature based on humidity.
-
Training Data
- Use 80% of available data to train the model
- Ensures the model learns patterns effectively
-
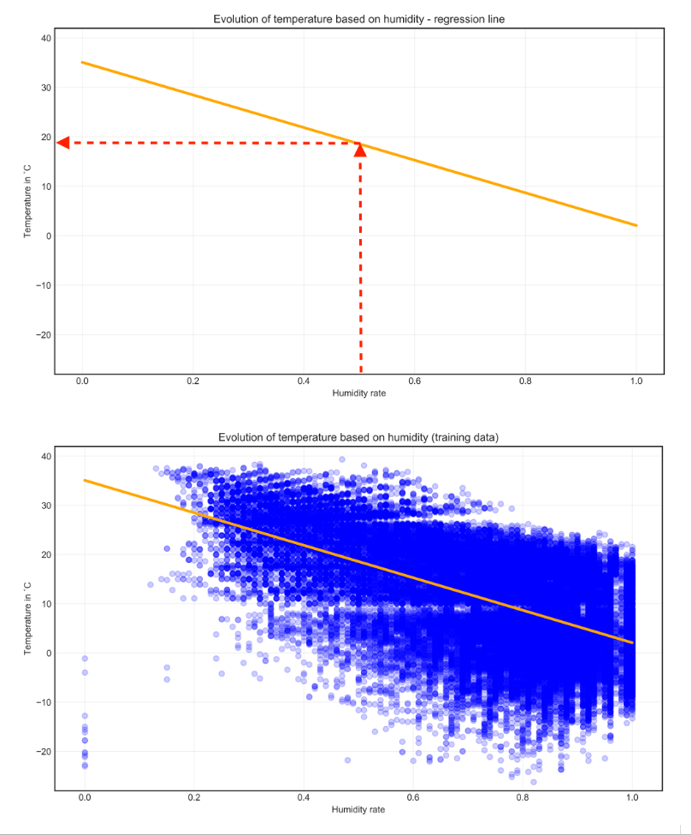
Linear Regression
- Fits a line to identify trends in data
- Example: Inverse relationship between humidity and temperature
-
Model Evaluation
- Test the model with the remaining data to check accuracy
- Adding relevant features improves prediction quality
Case Study: Weather Readings
We'll use the following data to predict the temperature. We don't a specific set of labels, but instead we have variable temperatures.
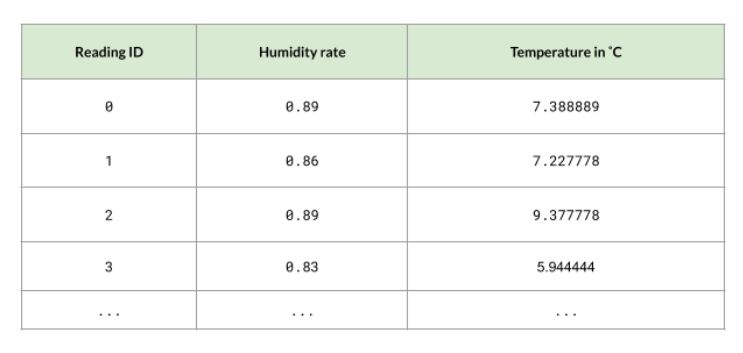
We use 80% of the data to train the model and then graph the points. Using the linear regression model, we can see that when the humidity rate is above 0.4, the temperature also rises to around 20 degree celsius.