Bar Plots
Overview
Bar plots are similar to box plots and are often used for categorical data.
- Ideal for displaying counts or percentages of categories.
- Bars should start from zero, which is significant in this context.
Bar plots are typically used to show counts or percentages of categorical variables. They can also represent other metrics, but the key constraint is that the value zero should be meaningful.
Case Study: ESPN's Top Athletes of 2017
This dataset features the most famous athletes of 2017 as ranked by ESPN. Rankings are based on factors such as social media followers, endorsement earnings, and online search popularity.
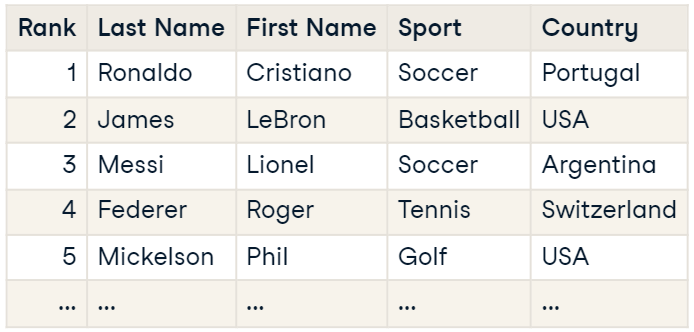
Reference: ESPN 100 Most Famous Athletes Dataset
Swapping Axis
The bar plot displays the number of athletes from each country. The countries are on the y-axis, and the counts are on the x-axis.
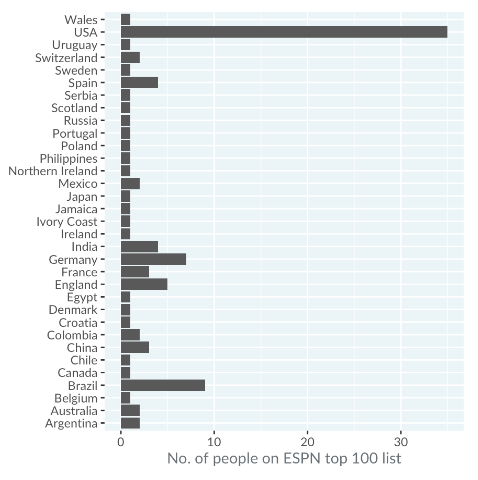
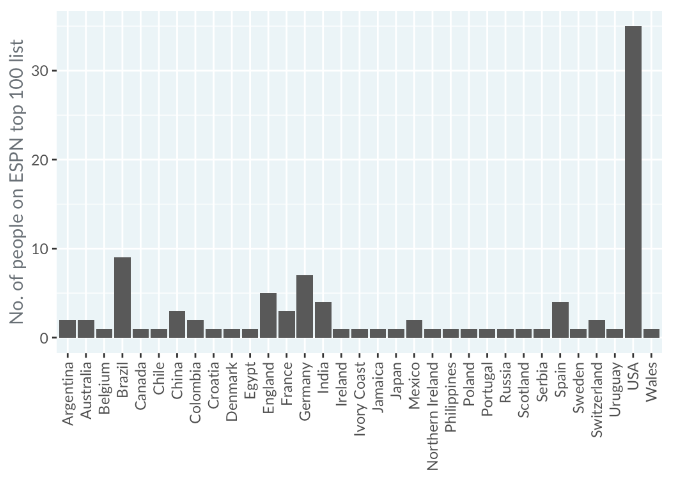
Swapping the axes to show categories on the x-axis and counts on the y-axis can make the chart harder to read due to vertical text. Horizontal bars are often more legible in such cases.
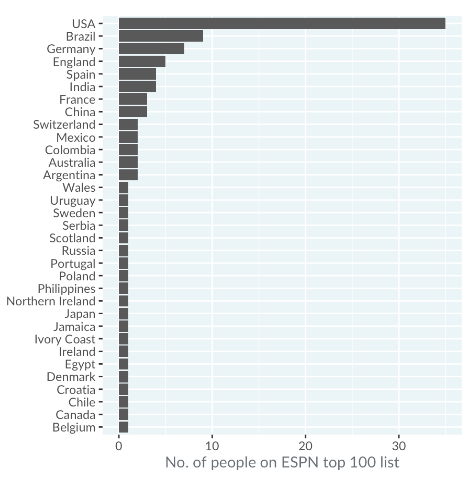
Sorting by Count
Sorting bars by count helps in easily identifying rankings, such as Spain and India being tied for fifth place with four athletes each.
Case Study: Fruit and Veg Consumption
From the 2018 Health Survey for England, this dataset shows the number of fruit and vegetable portions children consume daily. The data is categorized by portions eaten and year, presented as percentages.
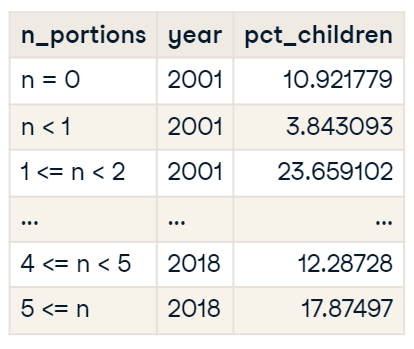
Reference: Health Survey for England 2018 Dataset
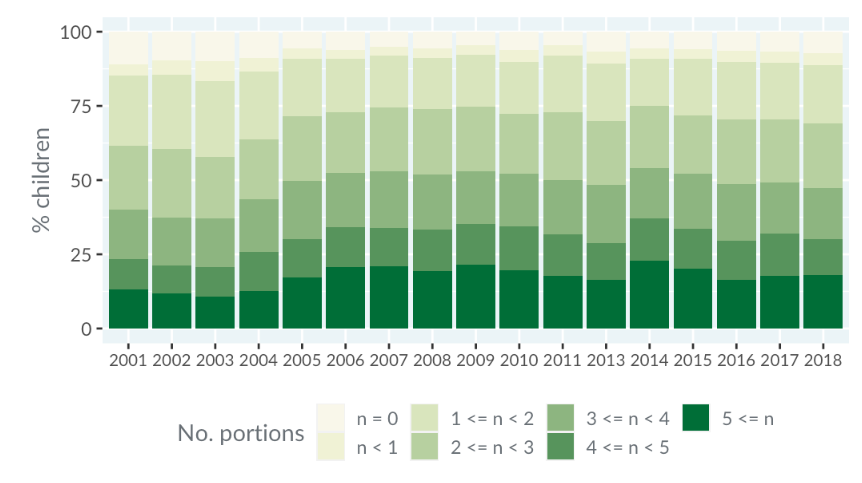
Stacking Bars
Stacked bars are useful when the total always adds up to 100%. For example, you can see changes in the percentage of children eating specific portions of fruit and vegetables over time. The increase in children eating five portions per day and the decrease in those eating none suggests the effectiveness of health campaigns.
Bar Plots vs. Box Plots
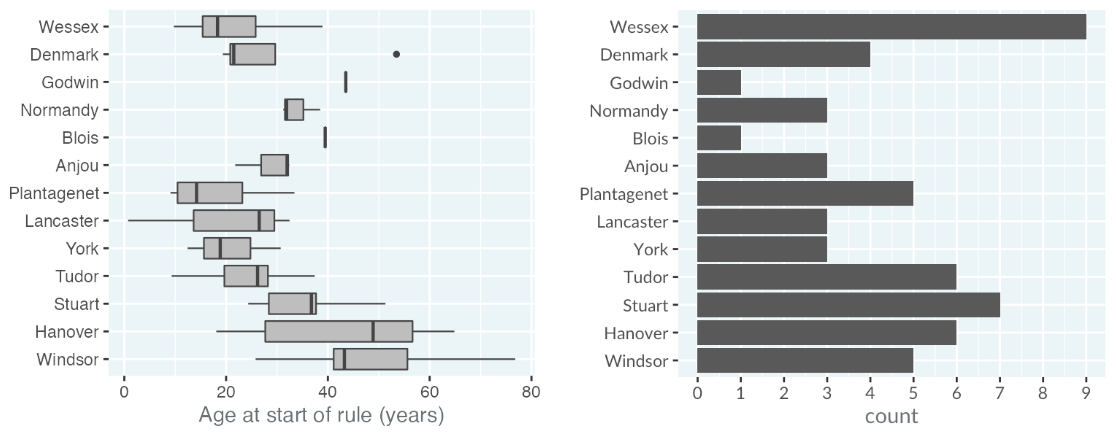
Case Study: Monarch Ages
Bar plots and box plots serve different purposes. Bar plots are used to show counts or single metrics relative to zero, while box plots illustrate the spread of a variable. For example, comparing age at which English and British monarchs began ruling can be done with both types of plots for different insights.
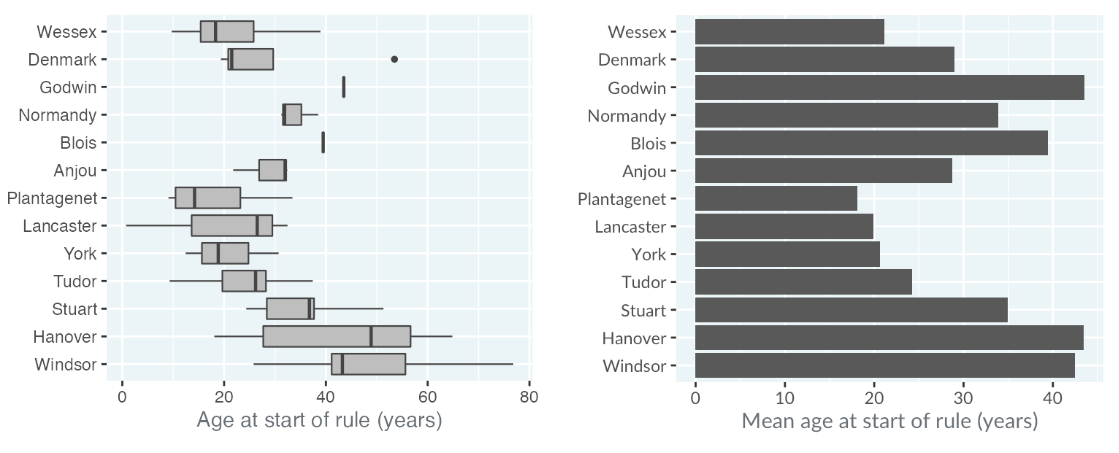
Other Metrics
Bar plots can represent various metrics beyond counts. For instance, showing the mean age at which monarchs began their rule can be effective but might seem less dynamic compared to box plots.
Case Study: Health Survey
This dataset comes from the Health Survey for England and focuses on a specific query. Adults aged 65 and older were surveyed about the number of "activities of daily living" (tasks needed for daily life) they required help with.
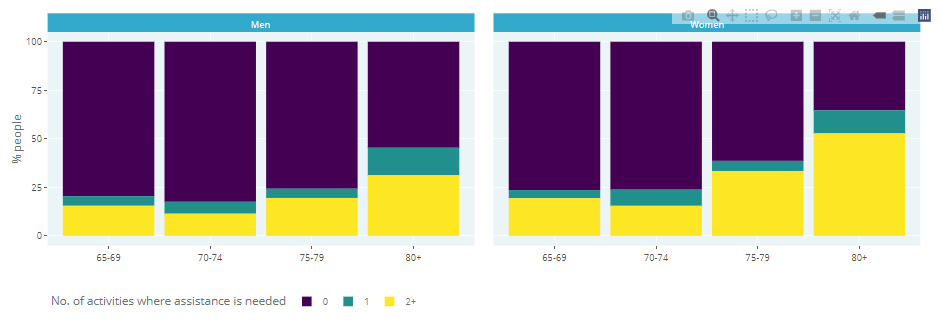
Observations:
- Men between the ages 70-74 are the group with the largest percentage of people that needs no assistance.