Higher Dimensions
Case Study: UN Life Expectancy
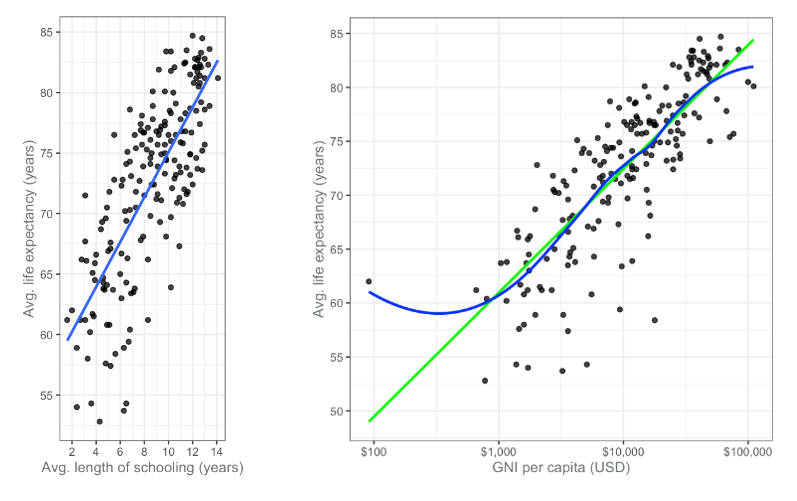
The UN dataset provides scatter plots showing life expectancy against both schooling length and GNI per capita individually. If we want to analyze the combined effect of these two variables on life expectancy, we need to take a different approach.
3D Scatter Plots
A 3D scatter plot might seem like a solution, but it often complicates interpretation. The third dimension can create confusion and make it hard to discern patterns.
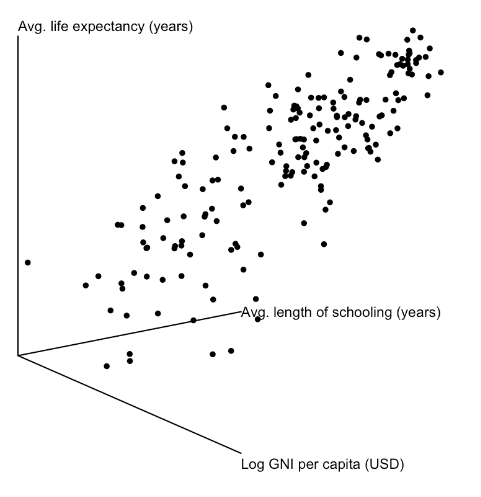 |
|---|
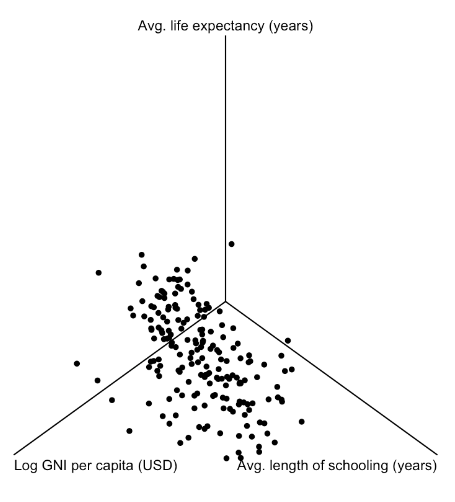
We can also rotate the plot but it doesn’t really make it more clearer.
 |
|---|
Representing Multiple Dimensions
Instead of relying on 3D plots, other methods can represent more than two dimensions on a flat screen. For scatter plots, you can use colors, sizes, transparency, and shapes to convey additional information.
Color
In this approach, life expectancy is represented by color. Shorter life expectancies are shown in blue, transitioning through green to yellow for longer life expectancies.
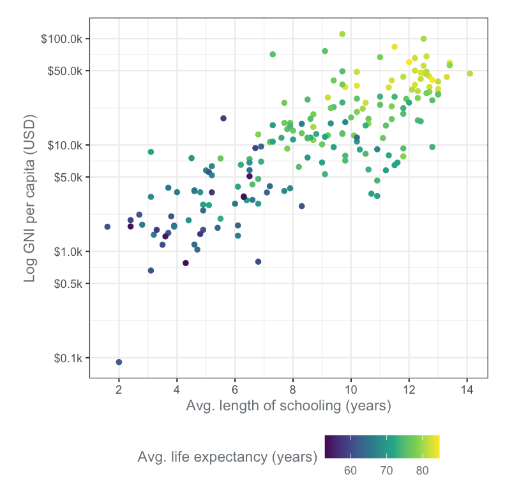
This allows you to see that countries with high life expectancy tend to have long schooling and high GNI. However, precise life expectancy values are harder to determine, as you can only estimate within a range.
Size
Another method is to vary the size of the points, with larger points indicating higher values. While this can be useful, it has limitations. Larger points may appear more significant, which can be misleading if you need to highlight countries with lower life expectancies.
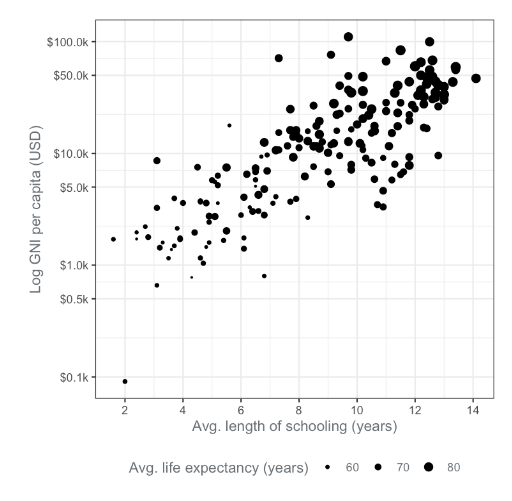
Additionally, large points may overlap, making it difficult to distinguish individual data points.
Transparency
Transparency is similar to size in its challenges. Points with less transparency draw more attention, and precise values are harder to gauge due to overlapping areas.
![]()
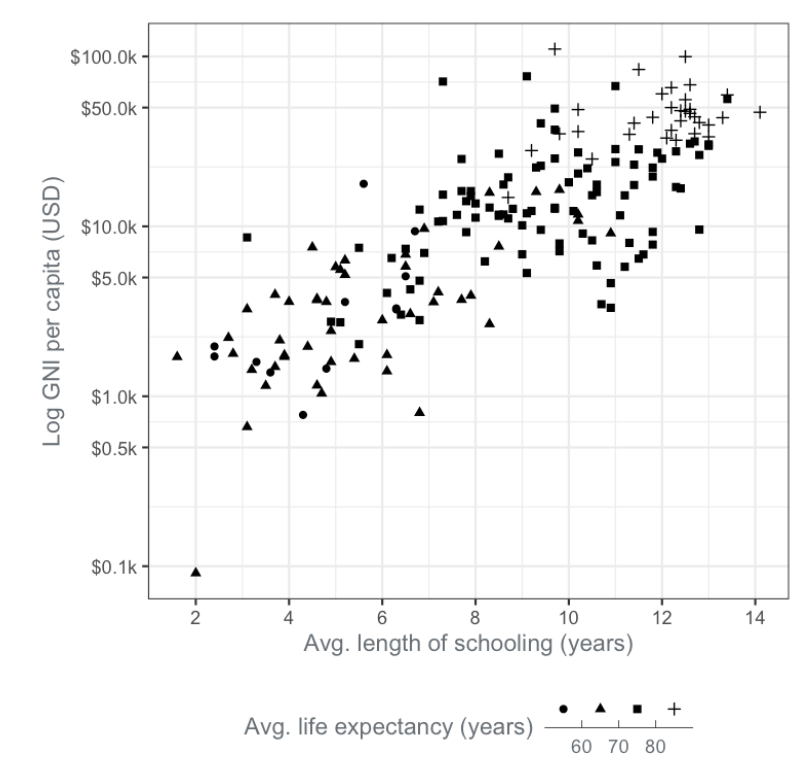
Shape
Shapes can be used to categorize life expectancies into ranges, such as using one shape for ages 50-60 and another for 60-70. However, shapes don’t naturally convey order, making it necessary to remember which shape corresponds to which range. This method can be mentally taxing and less intuitive.
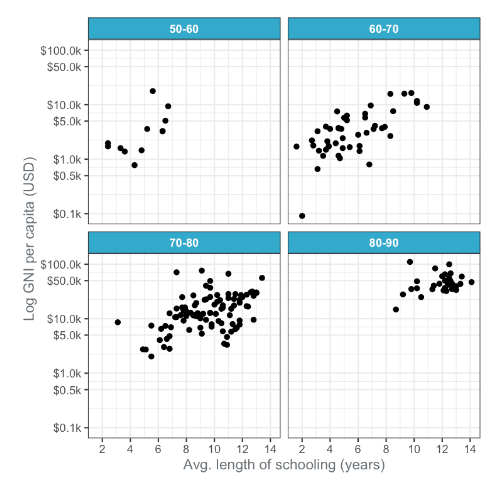
Multiple Panels
Another option is to create separate panels for different subsets of the data. This method categorizes life expectancies and shows trends across groups. For instance, panels can reveal that countries with life expectancies in the 60-70 range generally have more schooling than those in the 50-60 range.
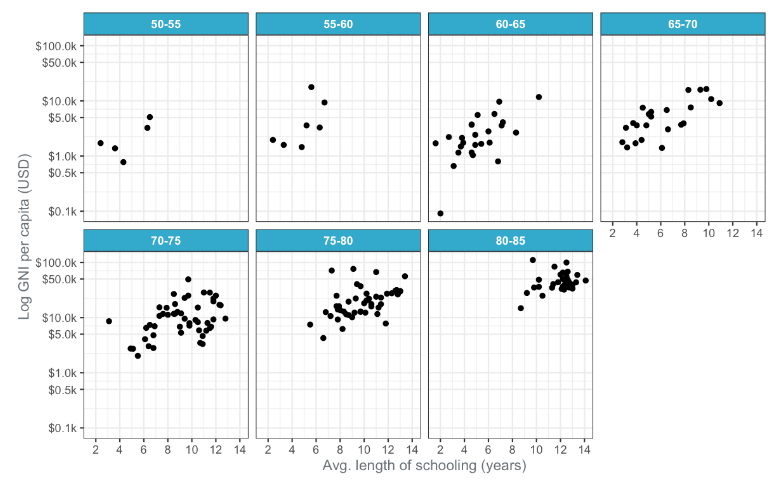
Detailed Panels
You can refine this approach by using panels for narrower age ranges, such as five-year intervals. This increases precision but requires more space and effort to compare multiple panels, which can complicate interpretation.
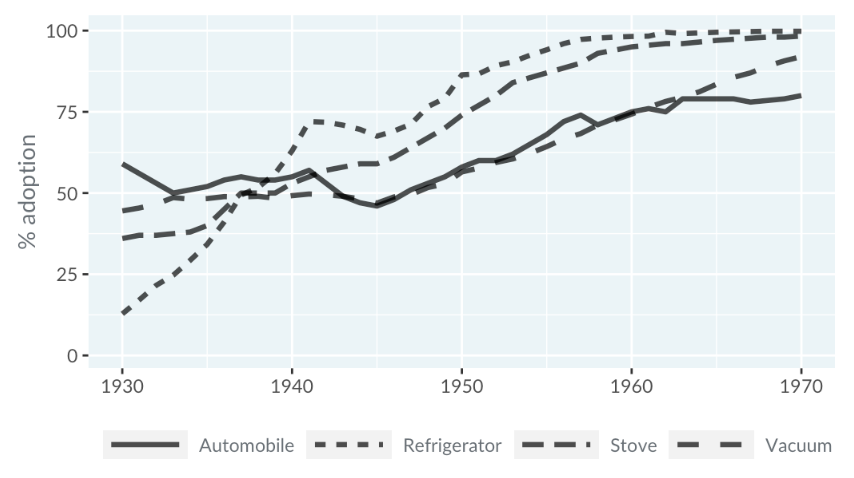
Additional Dimensions in Line Plots
Line plots also offer options for additional dimensions, including color, line thickness, transparency, and linetype. These attributes function similarly to points in scatter plots, with linetype allowing for distinctions such as dashes or dots.
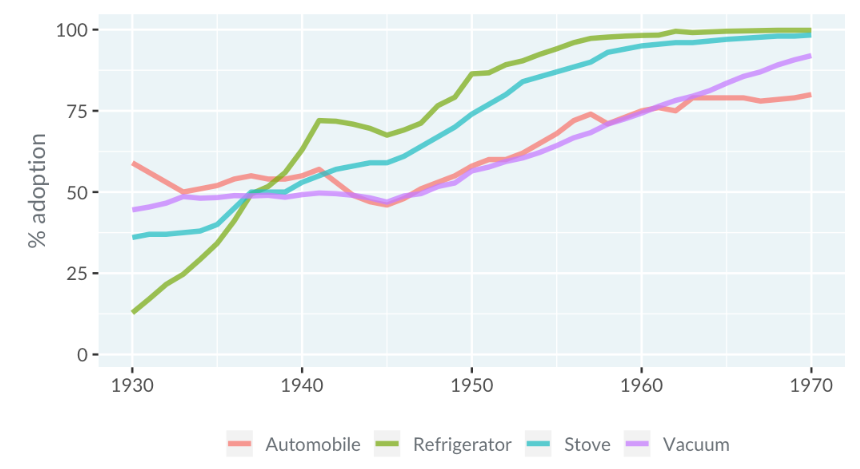
Line Plot with Color
Here’s an example of a line plot on technology adoption in the USA, where color differentiates the lines.
Line Plot with Linetype
An alternative version uses different linetypes to distinguish between lines. However, distinguishing between various dash patterns can be challenging, even with just a few lines.