Using Colors
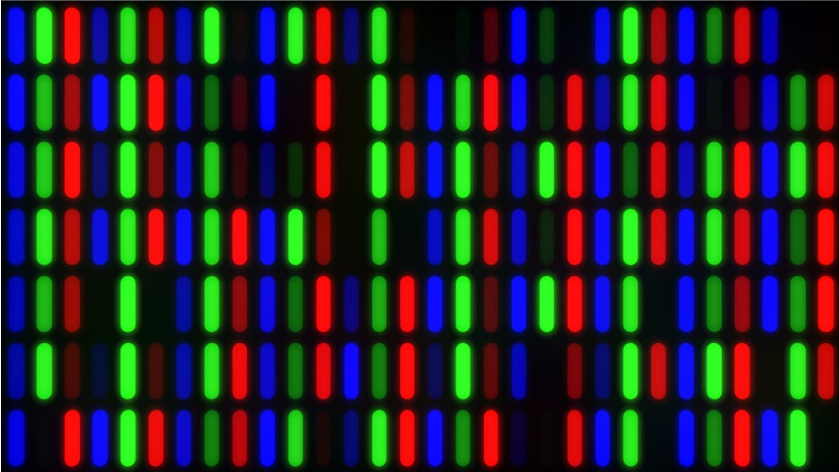
Red-Green-Blue
Colors are defined based on the amount of red, green, and blue they contain. This red-green-blue (RGB) colorspace determines how bright these colors appear on screens.
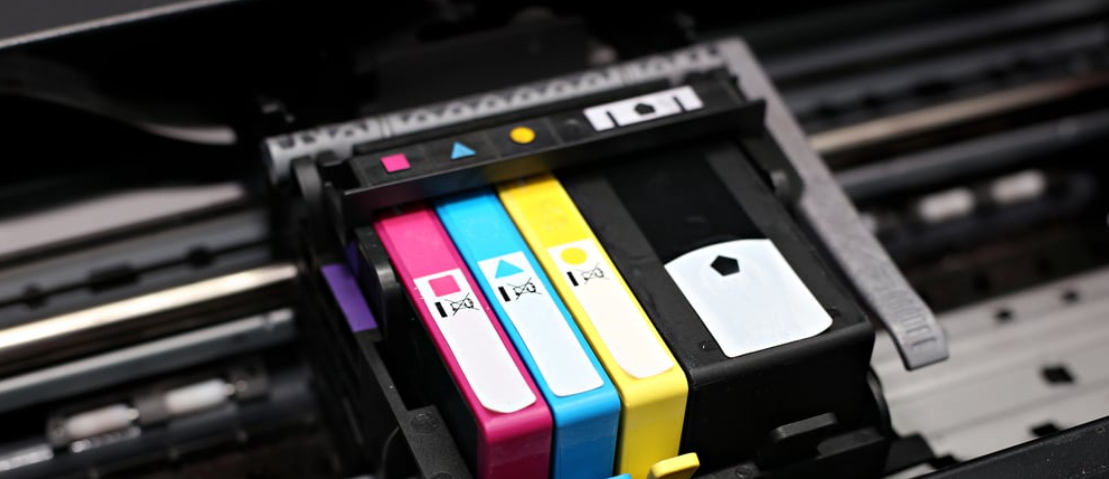
Cyan-Magenta-Yellow-Black
Graphic designers use the cyan-magenta-yellow-black (CMYK) colorspace for printing. This system matches the colors seen on screens with those printed, providing high color fidelity.
Case Study: LA House Prices
For visualizing Los Angeles house prices, the color choice can affect clarity.
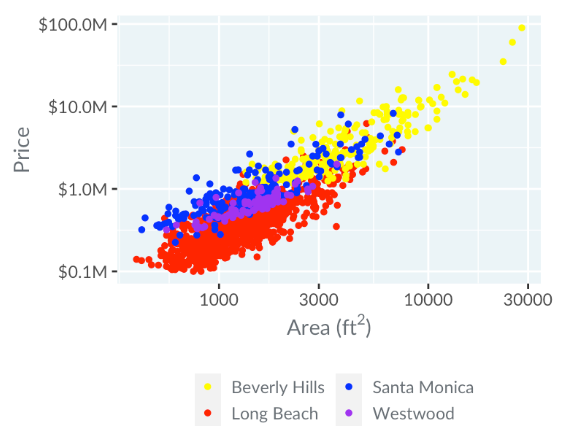
Issues with the graph:
- Yellow points are less visible than red
- Can potentially leading to overlooked insights
- Blue and purple are close in perception
- Yellow stands out, can cause misinterpretation of the data.
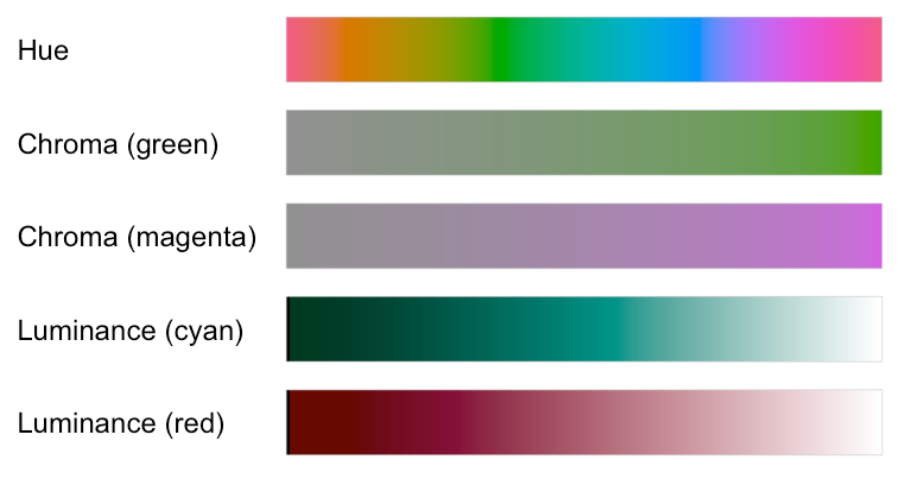
Hue-Chroma-Luminance
The hue-chroma-luminance (HCL) colorspace is tailored for data visualization.
- Hue: Represents the color spectrum from red to purple and back to red.
- Chroma: Indicates the color's intensity, from grey to bright colors.
- Luminance: Reflects the brightness, from black to white.
Diagram:
Types of Color Scales
Qualitative
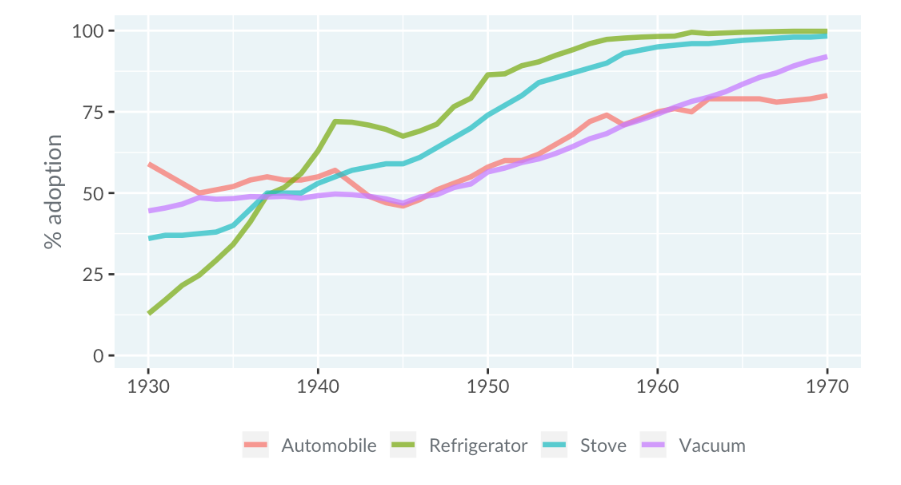
Qualitative is used to differentiate unordered categories. These scales vary hues while keeping chroma and luminance constant.

Below is a case study on technology adoption and it is graphed as a line plot. Different hues are used to represent unordered technologies, with constant chroma and luminance.
Sequential
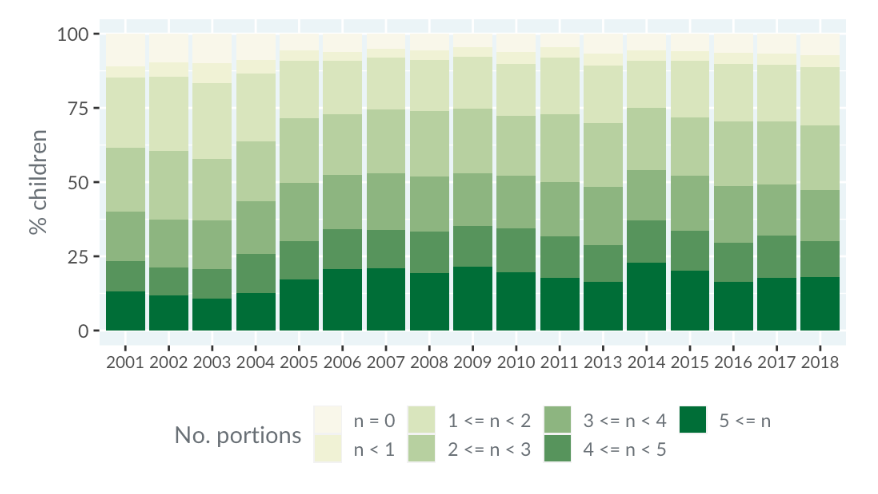
Sequential color scales highlight ordered data by showing progression from lower to higher values. These scales typically adjust chroma or luminance while keeping hue constant.

Below is a case study on children's fruit and vegetable consumption. The bar plot uses a sequential color scale to represent ordered categories from zero to more than five.
Sequential - Viridis
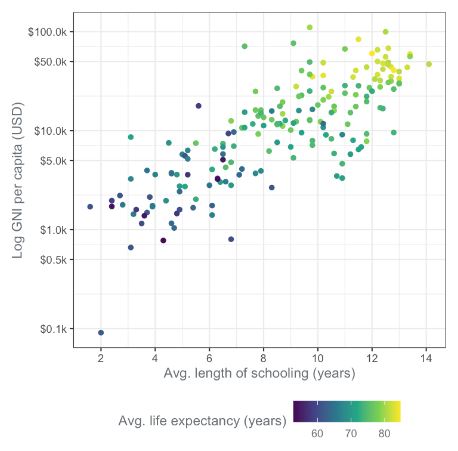
For continuous variables, a sequential color scale like Viridis can be used. It changes hue and is designed to be colorblind-friendly and suitable for black-and-white printing. Here is an example dot plot.
Diverging Color Scales
Diverging color scales are used to highlight differences from a central value. They feature a neutral color in the middle with bold colors at both ends to show variations.

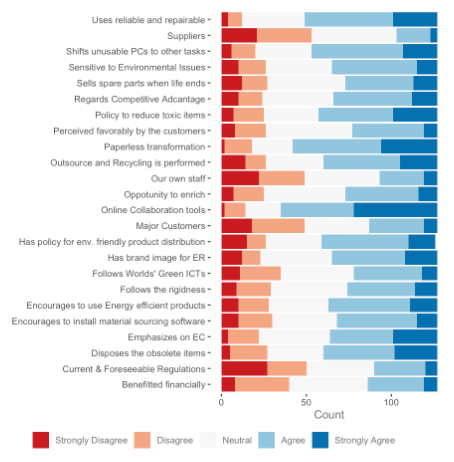
Case Study: Green Tech in Malaysia
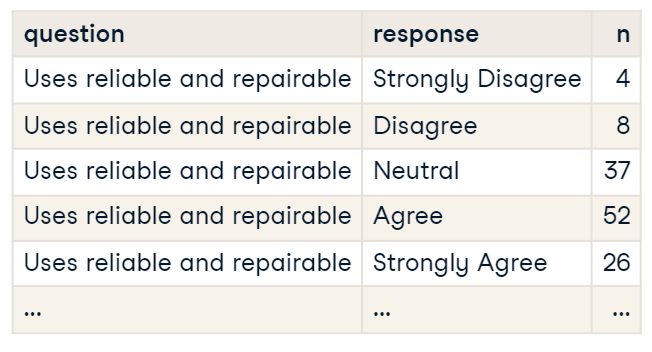
This dataset on green technology and recycling in Malaysia uses a diverging scale for responses ranging from "Strongly Disagree" to "Strongly Agree," with "Neutral" in the middle.
Reference: Islam et al. (2019) Survey Dataset
In this survey dataset, each question is represented with colors becoming more intense as opinions shift from neutral to strong agreement or disagreement.
Case Study: Math Anxiety
Below are the survey results on math anxiety from a class of students. Each question has its own row, and responses range from "Strongly Disagree" to "Neutral" to "Strongly Agree".
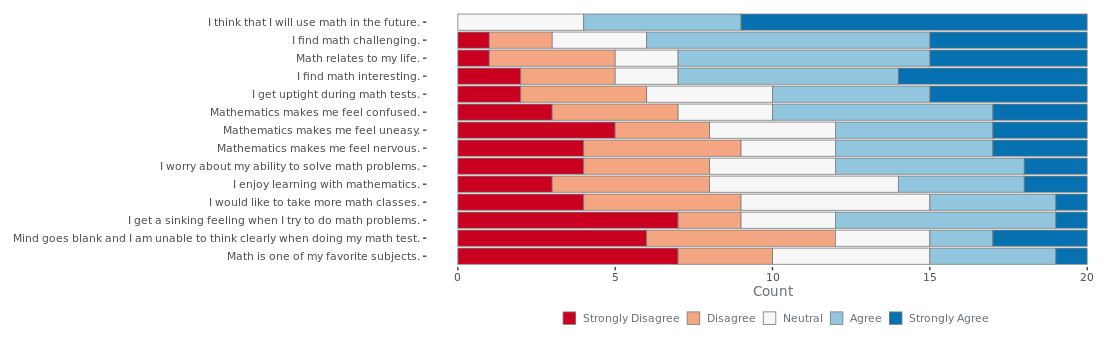
Reference: Bai et al. (2009)