Linux Networking
NIC Naming
Network Interface Card (NIC) naming in Linux can be identified using commands like ip link and ip addr show. These commands provide information about the state, configuration, and attributes of network interfaces.
- IP address configuration needs to be connected to a specific network device.
- Every system has an
lodevice, which is for internal networking. - The name of the real network device is presented as a BIOS name.
- If the driver doesn't reveal network device properties, classical naming is used.
- Classical naming is using device names like
eth0,eth1, and so on.
BIOS naming is based on hardware properties to give more specific information in the device name:
em[1-N]for embedded NICseno[nn]for embedded NICsp[slotp]p[port]for NICs on the PCI bus
Sample output:
$ ip link

1: lo: <LOOPBACK,UP,LOWER_UP> mtu 65536 qdisc noqueue state UNKNOWN mode DEFAULT group default qlen 1000
    link/loopback 00:00:00:00:00:00 brd 00:00:00:00:00:00
2: eth0: <BROADCAST,MULTICAST,UP,LOWER_UP> mtu 9001 qdisc mq state UP mode DEFAULT group default qlen 1000
    link/ether 06:57:3b:26:42:56 brd ff:ff:ff:ff:ff:ff
$ ip addr show

1: lo: <LOOPBACK,UP,LOWER_UP> mtu 65536 qdisc noqueue state UNKNOWN group default qlen 1000
    link/loopback 00:00:00:00:00:00 brd 00:00:00:00:00:00
    inet 127.0.0.1/8 scope host lo
       valid_lft forever preferred_lft forever
    inet6 ::1/128 scope host
       valid_lft forever preferred_lft forever
2: eth0: <BROADCAST,MULTICAST,UP,LOWER_UP> mtu 9001 qdisc mq state UP group default qlen 1000
    link/ether 06:57:3b:26:42:56 brd ff:ff:ff:ff:ff:ff
    inet 172.31.33.29/20 brd 172.31.47.255 scope global dynamic noprefixroute eth0
       valid_lft 3065sec preferred_lft 3065sec
    inet6 fe80::457:3bff:fe26:4256/64 scope link
       valid_lft forever preferred_lft forever
Runtime Configurations
Runtime configurations are temporary settings that are not persistent across reboots. These configurations can be set using the ip command to manage and display network interface parameters.
ipreplaces the legacyifconfigtool.- It can be used to manage all aspects of IP networking.
- Use
ip addrto manage address properties. - Use
ip linkto show linke properties.
Sample output:
$ ip link show
1: lo: <LOOPBACK,UP,LOWER_UP> mtu 65536 qdisc noqueue state UNKNOWN mode DEFAULT group default qlen 1000
    link/loopback 00:00:00:00:00:00 brd 00:00:00:00:00:00
2: eth0: <BROADCAST,MULTICAST,UP,LOWER_UP> mtu 9001 qdisc mq state UP mode DEFAULT group default qlen 1000
    link/ether 06:57:3b:26:42:56 brd ff:ff:ff:ff:ff:ff
$ ip -s link show
1: lo: <LOOPBACK,UP,LOWER_UP> mtu 65536 qdisc noqueue state UNKNOWN mode DEFAULT group default qlen 1000
    link/loopback 00:00:00:00:00:00 brd 00:00:00:00:00:00
    RX: bytes  packets  errors  dropped missed  mcast
    2309540    576      0       0       0       0
    TX: bytes  packets  errors  dropped carrier collsns
    2309540    576      0       0       0       0
2: eth0: <BROADCAST,MULTICAST,UP,LOWER_UP> mtu 9001 qdisc mq state UP mode DEFAULT group default qlen 1000
    link/ether 06:57:3b:26:42:56 brd ff:ff:ff:ff:ff:ff
    RX: bytes  packets  errors  dropped missed  mcast
    302018206  275609   0       0       0       0
    TX: bytes  packets  errors  dropped carrier collsns
    40401188   124646   0       0       0       0
Routing IP Traffic
Static Routing
Static routing involves manually configuring routes in a routing table. This method is typically used when the network topology is simple or when specific paths need to be defined for traffic. Useful when routing traffic from one IP address to another using a non-default route.
Display available routes. The first one is typically the default gateway and the first hop in traceroute.
$ netstat -rn
Kernel IP routing table
Destination     Gateway         Genmask         Flags   MSS Window  irtt Iface
0.0.0.0         172.31.0.1      0.0.0.0         UG        0 0          0 eth0
172.31.0.0      0.0.0.0         255.255.240.0   U         0 0          0 eth0
A newer way to display IP routes:
$ ip route show
default via 172.31.0.1 dev eth0 proto dhcp metric 100
172.31.0.0/20 dev eth0 proto kernel scope link src 172.31.3.65 metric 100
Adding routes using the old method:
route add -net <network> netmask 255.255.255.0 gw <gw-addr> dev <interface>
Adding routes using the new method:
ip route add <dest-ip-addr> via <gw-addr> dev <interface>
Deleting routes:
sudo ip route delete <route-entry>
Dynamic Routing
Dynamic routing allows routers to communicate with each other to dynamically update routing tables based on network changes. This method is more adaptive to network changes and is commonly used in larger, more complex networks.
For detailed information on dynamic routing with RedHat and Linux, refer to the following resources:
- Dynamic routing with RedHat
- Linux - how to turn on the the RIP (dynamic routing)
- Understand the basics of Linux routing
- How To Add Route In Linux
- How to Add Persistent Static Routes on RHEL 6/CentOS 6
DNS
DNS settings are crucial for resolving domain names to IP addresses. Note that every time the network manager restarts, the resolv.conf is recreated.
$ cat /etc/resolv.conf

# Generated by NetworkManager
search ap-southeast-1.compute.internal
nameserver 172.31.0.2
Network Manager
Network Manager is a daemon that manages network connections and configurations. For the majority of RHEL installations, Network Manager is installed by default.
To check if Network Manager is installed:
$ which NetworkManager

/usr/bin/NetworkManager
To check the status:
sudo systemctl status NetworkManager
If it's not installed yet, run the following command:
sudo dnf install -y NetworkManager
sudo systemctl enable --now NetworkManager
sudo systemctl status NetworkManager
Configuration files for each NIC can be found in the following directory:
$ ll /etc/sysconfig/network-scripts/

total 8
-rw-r--r--. 1 root root 244 May  5  2021 ifcfg-ens3
-rw-r--r--. 1 root root 159 Nov 29 03:55 ifcfg-eth0
To edit configuration files for the NICs, you can use either nmcli or nmtui, which will interact with the Network Manager to recreate the config files.
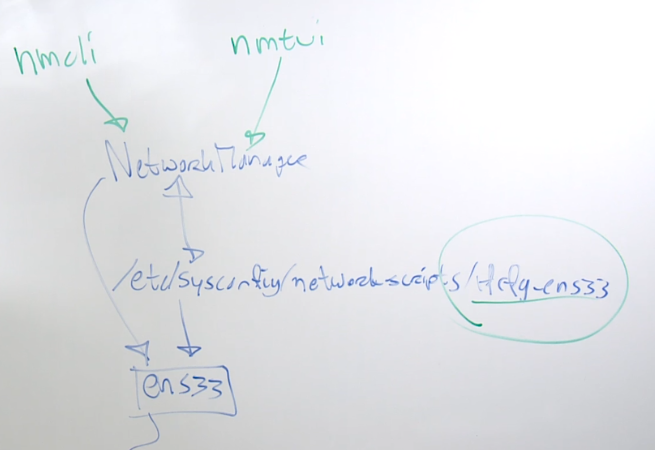
Network Configuration Files
Network configuration files contain settings for each network interface. These files can be found in the /etc/sysconfig/network-scripts/ directory.
$ ll /etc/sysconfig/network-scripts/
total 8
-rw-r--r--. 1 root root 244 May  5  2021 ifcfg-ens3
-rw-r--r--. 1 root root 159 Nov 29 03:55 ifcfg-eth0
$ cat ifcfg-ens3

TYPE=Ethernet
PROXY_METHOD=none
BROWSER_ONLY=no
BOOTPROTO=dhcp
DEFROUTE=yes
IPV4_FAILURE_FATAL=no
IPV6INIT=yes
IPV6_AUTOCONF=yes
IPV6_DEFROUTE=yes
IPV6_FAILURE_FATAL=no
NAME=ens3
UUID=14724ada-5aff-43e2-a0f7-c3f3c3f03151
DEVICE=ens3
ONBOOT=yes
$ cat ifcfg-eth0
# Created by cloud-init on instance boot automatically, do not edit.
#
BOOTPROTO=dhcp
DEVICE=eth0
HWADDR=06:57:3b:26:42:56
ONBOOT=yes
TYPE=Ethernet
USERCTL=no
nmcli
nmcli is a command-line client for Network Manager. It allows controlling Network Manager and reporting its status.
- An nmcli connection is a configuration added to a network interface.
- Connections are stored in configuration files.
- The NetworkManager service must be running to manage these files.
Install bash-completion
To use nmcli efficiently, install the bash-completion RPM package. Follow the link RHEL / CentOS Linux install and activate Bash completion for instructions.
sudo yum install -y bash-completion
To verify installation:
$ rpm -qa | grep bash-completion
bash-completion-2.7-5.el8.noarch
To activate bash-completion, log out and log back in.
Using nmcli
Run the following command to interact with Network Manager:
nmcli
To see the status of devices:
$ nmcli device status

DEVICE  TYPE      STATE      CONNECTION
eth0    ethernet  connected  System eth0
eth1    ethernet  connected  Wired connection 1
lo      loopback  unmanaged  --
To see man pages for nmcli:
$ man 7 nmcli-examples

NMCLI-EXAMPLES(7)                                        Examples                                       NMCLI-EXAMPLES(7)

NAME
       nmcli-examples - usage examples of nmcli

SYNOPSIS
       nmcli [OPTIONS...]

DESCRIPTION
       nmcli is a command-line client for NetworkManager. It allows controlling NetworkManager and reporting its status.
       For more information please refer to nmcli(1) manual page.

       The purpose of this manual page is to provide you with various examples and usage scenarios of nmcli.

EXAMPLES
       Example 1. Listing available Wi-Fi APs

           $ nmcli device wifi list
           *  SSID               MODE    CHAN  RATE       SIGNAL  BARS  SECURITY
              netdatacomm_local  Infra   6     54 Mbit/s  37      ▂▄__  WEP
           *  F1                 Infra   11    54 Mbit/s  98      ▂▄▆█  WPA1
              LoremCorp          Infra   1     54 Mbit/s  62      ▂▄▆_  WPA2 802.1X
              Internet           Infra   6     54 Mbit/s  29      ▂___  WPA1
              HPB110a.F2672A     Ad-Hoc  6     54 Mbit/s  22      ▂___  --
              Jozinet            Infra   1     54 Mbit/s  19      ▂___  WEP
              VOIP               Infra   1     54 Mbit/s  20      ▂___  WEP
              MARTINA            Infra   4     54 Mbit/s  32      ▂▄__  WPA2
              N24PU1             Infra   7     11 Mbit/s  22      ▂___  --
              alfa               Infra   1     54 Mbit/s  67      ▂▄▆_  WPA2
              bertnet            Infra   5     54 Mbit/s  20      ▂___  WPA1 WPA2
To see auto-completion for nmcli, type nmcli and press Tab twice:
$ nmcli
agent       connection  device      general     help        monitor     networking  radio
To see details of a specific interface:
$ nmcli device show eth1

GENERAL.DEVICE:                         eth1
GENERAL.TYPE:                           ethernet
GENERAL.HWADDR:                         0A:C4:B3:6D:CE:CE
GENERAL.MTU:                            9001
GENERAL.STATE:                          100 (connected)
GENERAL.CONNECTION:                     Wired connection 1
GENERAL.CON-PATH:                       /org/freedesktop/NetworkManager/ActiveConnection/3
WI

RED-PROPERTIES.CARRIER:               on
IP4.ADDRESS[1]:                         172.31.32.88/20
IP4.GATEWAY:                            172.31.32.1
IP4.DNS[1]:                             172.31.0.2
IP6.ADDRESS[1]:                         fe80::8c4:b3ff:fe6d:cece/64
Adding a New Address
To add a new ip address onto a NIC:
nmcli connection add type ethernet ifname eth1 con-name eth1
nmcli connection add ifname <interface> \
  ipv4.addresses <ip address> \
  ipv4.gateway <ip-address of gateway> \
  ipv4.dns <ip-address of dns> \
  type <ethernet or wifi>
To activate new connection:
nmcli connection up <interface>
To see current connections:
$ nmcli connection show
NAME         UUID                                  TYPE      DEVICE
System eth0  5fb06bd0-0bb0-7ffb-45f1-d6edd65f3e03  ethernet  eth0
ens3         14724ada-5aff-43e2-a0f7-c3f3c3f03151  ethernet  --
To modify an existing connection:
nmcli connection modify eth1 ipv4.addresses 192.168.1.100/24 ipv4.method manual
To delete a connection:
nmcli connection delete eth1
Setting a Static IP
To edit the adapter setting, we can enter an interface prompt in nmcli to change more than one setting. As an example, let's say we will edit eth0. Notice that after you run the command, it will return a new prompt.
$ sudo nmcli connection edit <adapter-name>

nmcli>
To change the settings:
nmcli> set ipv4.method manual
nmcli> set ipv4.addr 10.0.0.5/24
nmcli> set ipv4.dns 8.8.8.8
nmcli> set ipv4.gateway 10.0.0.10
To save the settings temporarily (it will not persist after reboot):
nmcli> save temporary
To make the changes persistent:
nmcli> save persistent
To apply the changes, we can reboot.
reboot
We can also restart NetworkManager but note that this will restart your entire network stack. This means even if you change and restart just one adapter, this will restart the rest of the other adapters as well.
sudo systemctl restart NetworKManager
Similarly, the command below also reloads all adapter configurations. But with this command, the adapters doesn't go offline.
sudo nmcli connection reload
The best approach is to reload just the connection we changed.
sudo nmcli connection down <conn-name>
sudo nmcli connection up <conn-name>
nmtui�
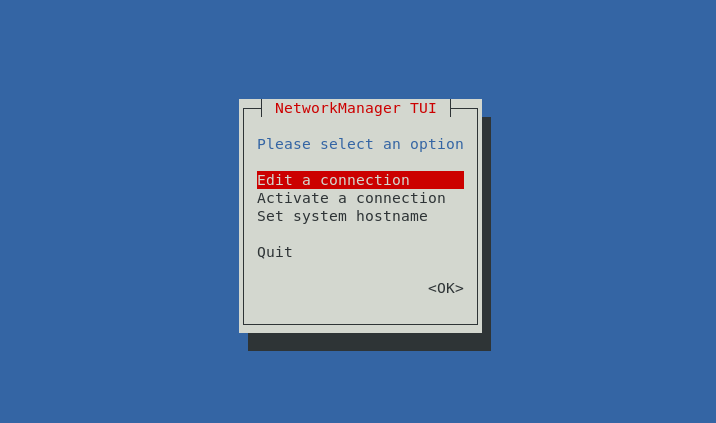
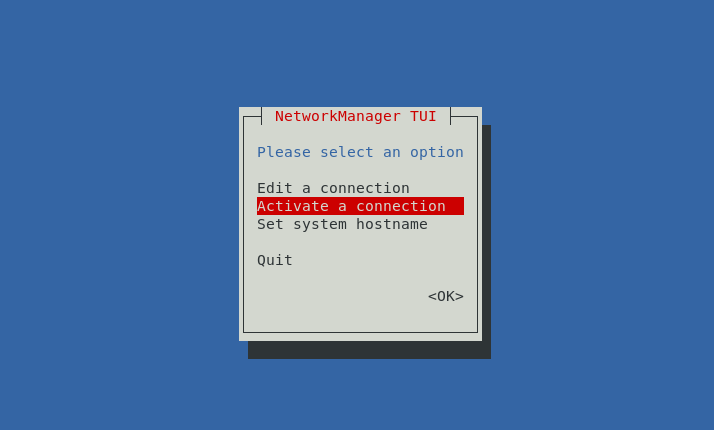
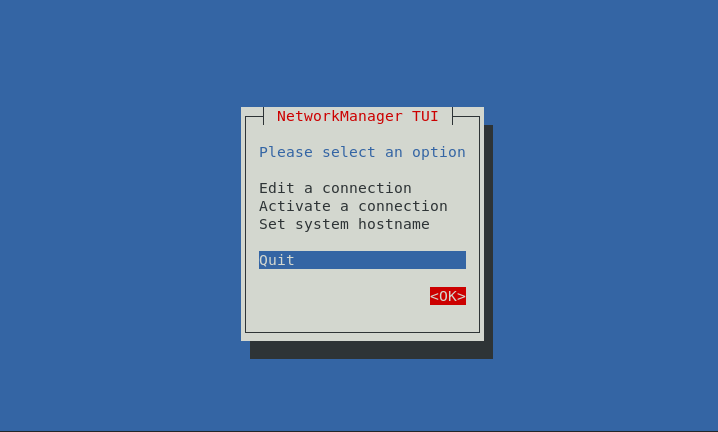
nmtui is a text user interface for Network Manager, providing a simple and intuitive way to configure network settings from the terminal.
$ nmtui

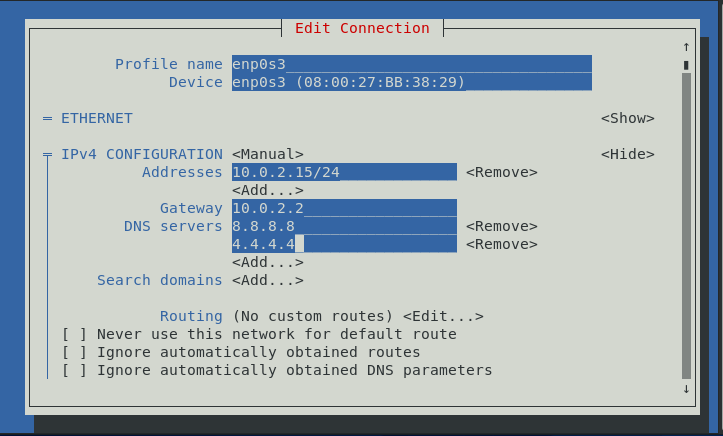
Editing a Connection
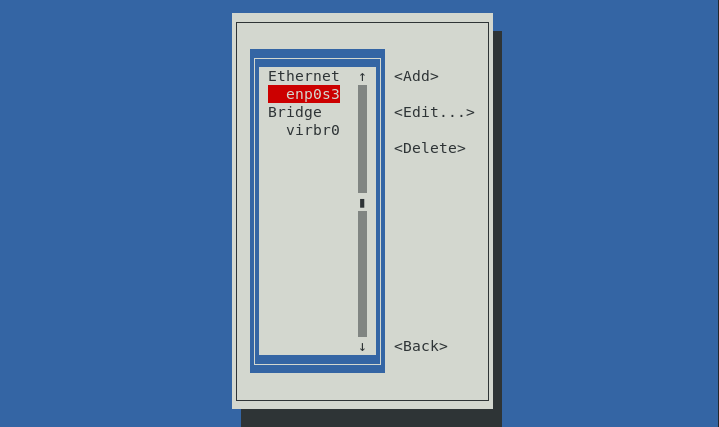
To edit a connection, use the arrow keys to navigate and select Edit a connection > OK > select the interface
In this case, we want to edit enp0s3 > Edit...
We want to change the following:
| Settings | old | new |
|---|---|---|
| ipv4 address | 10.0.2.17 | 10.0.2.15 |
| gateway | 10.0.2.4 | 10.0.2.2 |
| DNS servers | 8.8.8.8 | 8.8.8.8, 4.4.4.4 |
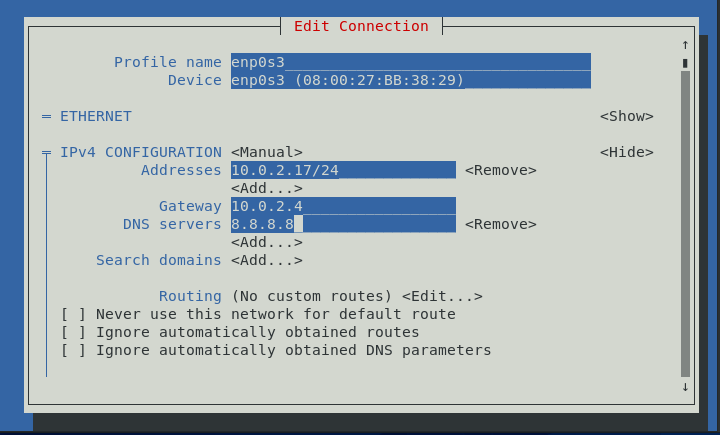
Go down to the bottom and hit OK.
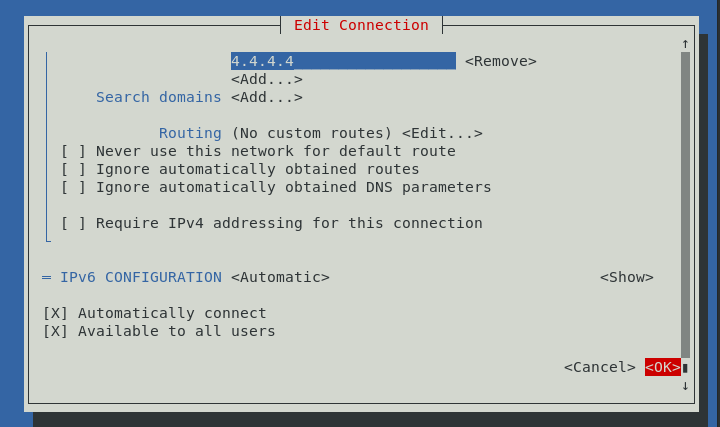
It will return to the interface page. Hit Back to return to the first page.
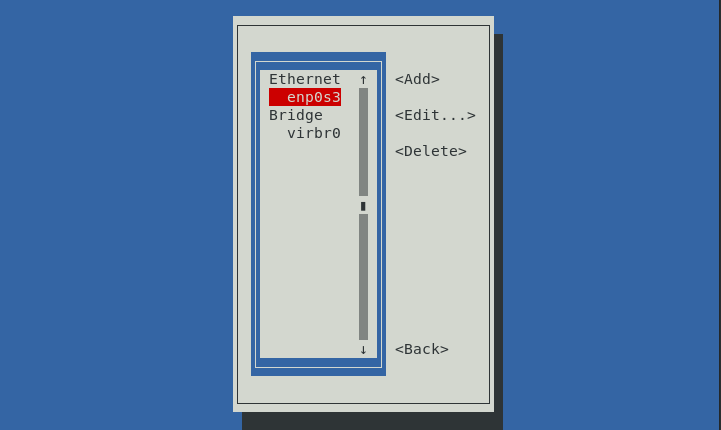
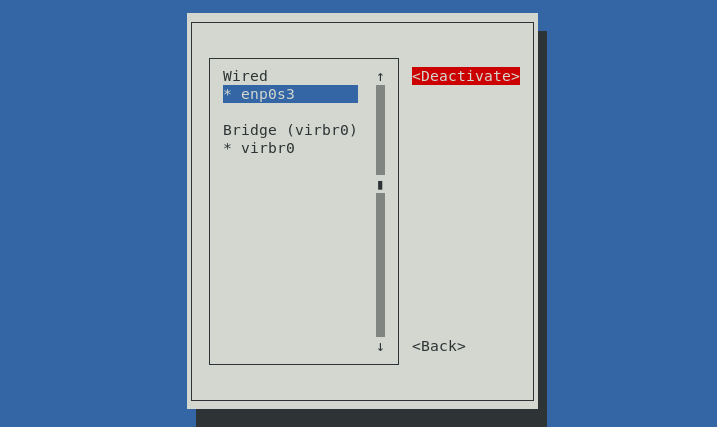
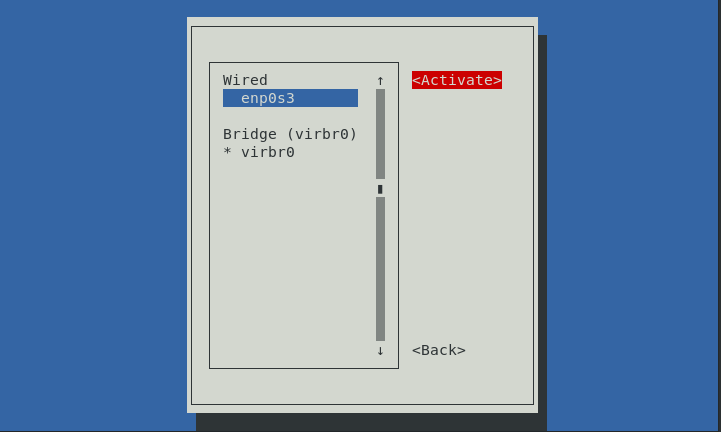
To apply the changes, select Activate a connection > OK
On the next page, press enter on Deactivate to deactivate the connection. Once it changes to Activate, press enter to load the connection back up. Hit Back afterwards.
On the main page, hit OK to exit out of nmtui.
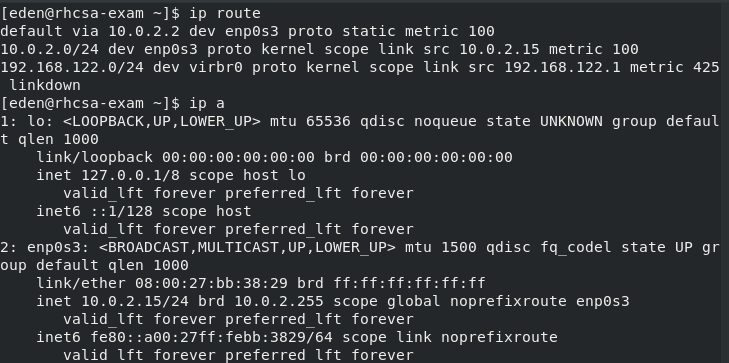
Verify.
Testing Network Connections
Testing network connections is essential to ensure proper connectivity and diagnose issues.
pingis used to test connectivity,ip addr showshows current configuration.ip route showshows current routing table.digcan test DNS nameserver working.
Utilities Not Found
If network utilities such as dig and nslookup are not found, you can install them using the bind-utils package. Follow the instructions in this link: How Do You Install dig and nslookup on a CentOS/RHEL/Fedora Server?
To install bind-utils, run:
sudo yum -y install bind-utils
dig
dig is a network administration command-line tool for querying the Domain Name System (DNS).
To query DNS for the domain google.com:
$ dig google.com

; <<>> DiG 9.11.26-RedHat-9.11.26-6.el8 <<>> google.com
;; global options: +cmd
;; Got answer:
;; ->>HEADER<<- opcode: QUERY, status: NOERROR, id: 44609
;; flags: qr rd ra; QUERY: 1, ANSWER: 6, AUTHORITY: 0, ADDITIONAL: 1

;; OPT PSEUDOSECTION:
; EDNS: version: 0, flags:; udp: 4096
;; QUESTION SECTION:
;google.com.                    IN      A

;; ANSWER SECTION:
google.com.             184     IN      A       142.251.12.138
google.com.             184     IN      A       142.251.12.139
google.com.             184     IN      A       142.251.12.100
google.com.             184     IN      A       142.251.12.101
google.com.             184     IN      A       142.251.12.102
google.com.             184     IN      A       142.251.12.113

;; Query time: 0 msec
;; SERVER: 172.31.0.2#53(172.31.0.2)
;; WHEN: Sat Dec 25 16:27:12 PST 2021
;; MSG SIZE  rcvd: 135
If we query a non-existent domain:
$ dig jkljjk.kl

; <<>> DiG 9.11.26-RedHat-9.11.26-6.el8 <<>> jkljjk.kl
;; global options: +cmd
;; Got answer:
;; ->>HEADER<<- opcode: QUERY, status: NXDOMAIN, id: 58161
;; flags: qr rd ra; QUERY: 1, ANSWER: 0, AUTHORITY: 1, ADDITIONAL: 1

;; OPT PSEUDOSECTION:
; EDNS: version: 0, flags:; udp: 4096
;; QUESTION SECTION:
;jkljjk.kl.                     IN      A

;; AUTHORITY SECTION:
.                       300     IN      SOA     a.root-servers.net. nstld.verisign-grs.com. 2021122500 1800 900 604800 86400

;; Query time: 53 msec
;; SERVER: 172.31.0.2#53(172.31.0.2)
;; WHEN: Sat Dec 25 16:29:04 PST 2021
;; MSG SIZE  rcvd: 113
dig output
Let's use the same example from above:
$ dig google.com

; <<>> DiG 9.11.26-RedHat-9.11.26-6.el8 <<>> google.com
;; global options: +cmd
;; Got answer:
;; ->>HEADER<<- opcode: QUERY, status: NOERROR, id: 44609
;; flags: qr rd ra; QUERY: 1, ANSWER: 6, AUTHORITY: 0, ADDITIONAL: 1

;; OPT PSEUDOSECTION:
; EDNS: version: 0, flags:; udp: 4096
;; QUESTION SECTION:
;google.com.                    IN      A

;; ANSWER SECTION:
google.com.             184     IN      A       142.251.12.138
google.com.             184     IN      A       142.251.12.139
google.com.             184     IN      A       142.251.12.100
google.com.             184     IN      A       142.251.12.101
google.com.             184     IN      A       142.251.12.102
google.com.             184     IN      A       142.251.12.113

;; Query time: 0 msec
;; SERVER: 172.31.0.2#53(172.31.0.2)
;; WHEN: Sat Dec 25 16:27:12 PST 2021
;; MSG SIZE  rcvd: 135
Explanation:
-
This indicates the version of
digbeing used and the query target (google.com):; <<>> DiG 9.11.26-RedHat-9.11.26-6.el8 <<>> google.com -
Shows global options set for the
digcommand:;; global options: +cmd -
Indicates that an answer was received:
;; Got answer: -
This header shows the query type, the status (
NOERRORmeaning no error), and the unique query ID:;; ->>HEADER<<- opcode: QUERY, status: NOERROR, id: 44609 -
These flags indicate various details about the query and response:
;; flags: qr rd ra; QUERY: 1, ANSWER: 6, AUTHORITY: 0, ADDITIONAL: 1Where:
qr: query response.rd: recursion desired.ra: recursion available.QUERY: 1: One query was made.ANSWER: 6: Six answers were returned.AUTHORITY: 0: No authority records were returned.ADDITIONAL: 1: One additional record was returned:
-
This section shows the EDNS (Extension mechanisms for DNS) version and UDP payload size:
;; OPT PSEUDOSECTION:; EDNS: version: 0, flags:; udp: 4096 -
This section shows the question asked:
;; QUESTION SECTION:;google.com. IN A -
This section shows the answer to the query, listing the IP addresses associated with
google.com:;; ANSWER SECTION:google.com. 184 IN A 142.251.12.138google.com. 184 IN A 142.251.12.139google.com. 184 IN A 142.251.12.100google.com. 184 IN A 142.251.12.101google.com. 184 IN A 142.251.12.102google.com. 184 IN A 142.251.12.113 -
The query took 0 milliseconds:
;; Query time: 0 msec -
The DNS server used for the query:
;; SERVER: 172.31.0.2#53(172.31.0.2) -
The date and time when the query was made:
;; WHEN: Sat Dec 25 16:27:12 PST 2021 -
The size of the response message:
;; MSG SIZE rcvd: 135
ping
The ping command is a basic networking utility used to test the reachability of a host on an IP network. It works by sending ICMP Echo Request packets to the target host and waiting for ICMP Echo Reply packets in response.
When you run the ping command, it typically produces output similar to the following:
PING google.com (142.250.183.206) 56(84) bytes of data.
64 bytes from 142.250.183.206: icmp_seq=1 ttl=116 time=12.3 ms
64 bytes from 142.250.183.206: icmp_seq=2 ttl=116 time=11.8 ms
64 bytes from 142.250.183.206: icmp_seq=3 ttl=116 time=11.9 ms
64 bytes from 142.250.183.206: icmp_seq=4 ttl=116 time=12.1 ms
64 bytes from 142.250.183.206: icmp_seq=5 ttl=116 time=11.8 ms

--- google.com ping statistics ---
5 packets transmitted, 5 received, 0% packet loss, time 4002ms
rtt min/avg/max/mdev = 11.824/11.984/12.338/0.205 ms
Where:
64 bytes from 142.250.183.206: Packet size and source IP.icmp_seq=1: Sequence number of the ICMP packet.ttl=116: Time-to-Live value of the packet.time=12.3 ms: Round-trip time (RTT) for the packet.5 packets transmitted, 5 received: Number of packets sent and received.0% packet loss: Percentage of packets lost during transmission.time 4002ms: Total time taken for the ping operation.
Monitor Network Performance
netstat and ss
Both netstat and ss are command-line tools used to display network connections, routing tables, interface statistics, masquerade connections, and multicast memberships. They provide insights into network activity and configuration on a system.
The older distributions use netstat (network statistics) but most modern ones start to use ss (socket statistics).
Examples:
-
List the various in-use ports and the process using it:
sudo netstat -pan | grep LISTEN -
Checks all tcp ports that are open:
$ ss -t -aState Recv-Q Send-Q Local Address:Port Peer Address:Port ProcessLISTEN 0 128 0.0.0.0:sunrpc 0.0.0.0:*LISTEN 0 128 0.0.0.0:ssh 0.0.0.0:*ESTAB 0 64 172.31.3.65:ssh 180.190.56.162:54565LISTEN 0 128 [::]:sunrpc [::]:*LISTEN 0 128 [::]:ssh [::]:* -
Displays the number of seconds that the next expected probe will be sent.
$ ss -t -oState Recv-Q Send-Q Local Address:Port Peer Address:Port ProcessESTAB 0 64 172.31.3.65:ssh 180.190.56.162:54565 timer:(on,344ms,0) -
Filter by socket/port:
$ ss -tn sport :22State Recv-Q Send-Q Local Address:Port Peer Address:Port ProcessESTAB 0 64 172.31.3.65:22 180.190.56.162:54565
nmap
nmap (Network Mapper) is a powerful open-source tool used for network exploration and security auditing. It scans hosts and services on a network, discovering vulnerabilities and generating useful network maps.
Examples:
-
Scans the OS and provides a traceroute of everything that's running on the system:
$ nmap -A localhostStarting Nmap 7.70 ( https://nmap.org ) at 2021-11-29 04:00 UTCNmap scan report for localhost (127.0.0.1)Host is up (0.00078s latency).Other addresses for localhost (not scanned): ::1Not shown: 997 closed portsPORT STATE SERVICE VERSION22/tcp open ssh OpenSSH 8.0 (protocol 2.0)| ssh-hostkey:| 3072 ec:2e:91:af:0b:dc:ac:3d:b2:75:86:6f:2d:93:fb:cc (RSA)| 256 5d:a0:e8:60:81:d3:05:56:f8:3d:22:fe:c2:9c:aa:16 (ECDSA)|_ 256 7c:08:2d:69:6d:38:21:dc:0d:da:a9:20:1b:cd:02:74 (ED25519)80/tcp filtered http111/tcp open rpcbind 2-4 (RPC #100000)| rpcinfo:| program version port/proto service| 100000 2,3,4 111/tcp rpcbind|_ 100000 2,3,4 111/udp rpcbindService detection performed. Please report any incorrect results at https://nmap.org/submit/ .Nmap done: 1 IP address (1 host up) scanned in 7.77 seconds -
Scan without leaving any trace:
$ nmap -A -sS localhostYou requested a scan type which requires root privileges.QUITTING!$$ sudo nmap -A -sS localhostStarting Nmap 7.70 ( https://nmap.org ) at 2021-11-29 04:05 UTCNmap scan report for localhost (127.0.0.1)Host is up (0.000011s latency).Other addresses for localhost (not scanned): ::1Not shown: 997 closed portsPORT STATE SERVICE VERSION22/tcp open ssh OpenSSH 8.0 (protocol 2.0)| ssh-hostkey:| 3072 ec:2e:91:af:0b:dc:ac:3d:b2:75:86:6f:2d:93:fb:cc (RSA)| 256 5d:a0:e8:60:81:d3:05:56:f8:3d:22:fe:c2:9c:aa:16 (ECDSA)|_ 256 7c:08:2d:69:6d:38:21:dc:0d:da:a9:20:1b:cd:02:74 (ED25519)80/tcp filtered http111/tcp open rpcbind 2-4 (RPC #100000)| rpcinfo:| program version port/proto service| 100000 2,3,4 111/tcp rpcbind|_ 100000 2,3,4 111/udp rpcbindDevice type: general purposeRunning: Linux 3.XOS CPE: cpe:/o:linux:linux_kernel:3OS details: Linux 3.7 - 3.10Network Distance: 0 hopsOS and Service detection performed. Please report any incorrect results at https://nmap.org/submit/ .Nmap done: 1 IP address (1 host up) scanned in 10.59 seconds
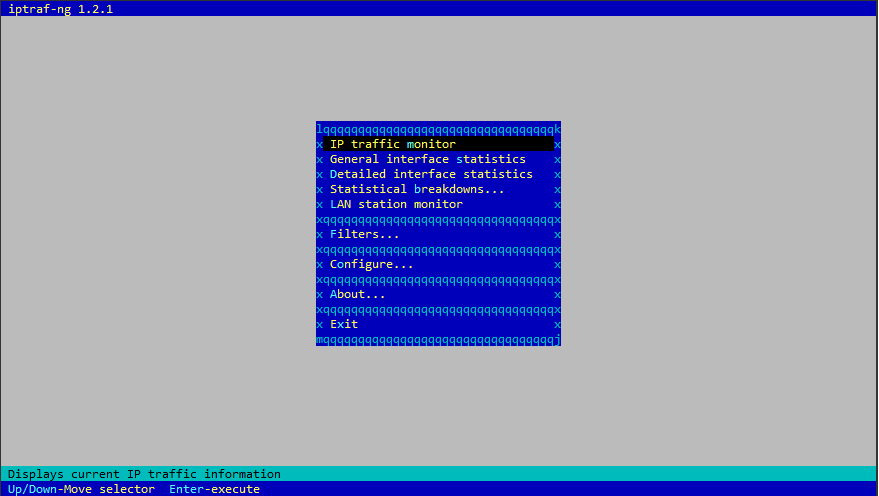
iptraf
iptraf (IP Traffic Monitor) is a console-based network monitoring tool for monitoring network traffic in real-time. It captures and displays various IP traffic statistics, including TCP info, UDP counts, ICMP, OSPF information, and more.
To install:
sudo yum install -y iptraf
Run:
sudo iptraf-ng
Capture and display real-time network traffic statistics in interactive mode:
sudo iptraf-ng -i all

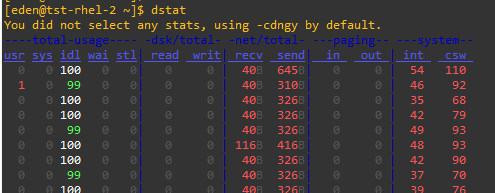
dstat
dstat is used to retrieve information or statistics form components of the system such as network connections, IO devices, or CPU, etc. It is generally used by system administrators to retrieve a handful of information about the above-mentioned components of the system.
To install:
sudo yum install -y dstat
Run:
dstat
Examples:
-
To monitor CPU statistics including system, user, idle, and wait times in real-time:
dstat --cpu -
To monitor read and write operations per second on all disks:
dstat --disk -
To monitor network traffic:
dstat --net -
To monitor memory statistics including used, free, buffered, and cached memory:
dstat --mem -
To display system load average over 1, 5, and 15 minutes:
dstat --load -
To monitor process-related statistics:
dstat --top-cpu --top-bio -
To specify custom interval and count:
## Runs `dstat` every 5 seconds (`-cd 5`) for a total of 10 times (`10`)dstat -tcd 5 10