Alertmanager
Overview
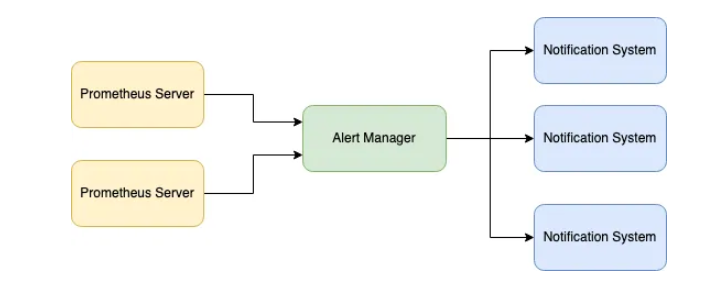
Alertmanager is a component of the Prometheus ecosystem responsible for managing alerts. It receives alerts from Prometheus, groups them, and sends notifications to various channels like email, Slack, SSN, or webhooks.
- Alertmanager manages, groups, and sends alerts to various channels.
- It routes notifications based on predefined rules.
- It can receive alerts from multiple Prometheus servers.
How it works
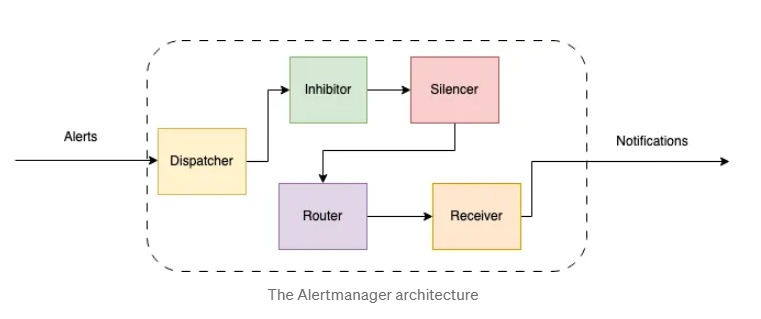
The Prometheus server sends alerts to the Alertmanager API. From there, it goes through several stages:
- Dispatcher: Receives and routes alerts.
- Inhibition: Prevents unnecessary alerts by suppressing certain notifications.
- Silencing: Temporarily disables alerts for specified conditions.
- Routing: Directs alerts to the appropriate receivers based on configuration.
- Notifications: Sends alerts via channels like email, Slack, or others.
Installing Alertmanager
Login to the Prometheus server as root user and follow the steps below:
-
Download Alertmanager from the official download page using
wgetorcurl.wget https://github.com/prometheus/alertmanager/releases/download/v0.21.0/alertmanager-0.21.0.linux-amd64.tar.gz -
After downloading, extract the files:
tar xzf alertmanager-0.21.0.linux-amd64.tar.gzcd alertmanager-0.21.0.linux-amd64/ -
Add a dedicated user for the Alertmanager service.
groupadd -f alertmanageruseradd --no-create-home --shell /bin/false -g alertmanager alertmanager -
Create the directory where the Alertmanager data will be stored.
mkdir /var/lib/alertmanagermkdir -p /etc/alertmanager/templates -
Copy over the required files and change the permissions.
cp alertmanager.yml /etc/alertmanagercp alertmanager /usr/bincp amtool /usr/binchown -R alertmanager:alertmanager /etc/alertmanagerchown -R alertmanager:alertmanager /var/lib/alertmanagerchown alertmanager:alertmanager /usr/bin/alertmanagerchown alertmanager:alertmanager /usr/bin/amtool -
Start Alertmanager by running the command below.
alertmanagerBy default, Alertmanager will start listening on port
9093.level=info ts=2024-12-14T08:41:15.448Z caller=main.go:216 msg="Starting Alertmanager" version="(version=0.21.0, branch=HEAD, revision=4c6c03ebfe21009c546e4d1e9b92c371d67c021d)"level=info ts=2024-12-14T08:41:15.448Z caller=main.go:217 build_context="(go=go1.14.4, user=root@dee35927357f, date=20200617-08:54:02)"level=info ts=2024-12-14T08:41:15.452Z caller=cluster.go:161 component=cluster msg="setting advertise address explicitly" addr=192.168.81.10 port=9094level=info ts=2024-12-14T08:41:15.453Z caller=cluster.go:623 component=cluster msg="Waiting for gossip to settle..." interval=2slevel=info ts=2024-12-14T08:41:15.478Z caller=coordinator.go:119 component=configuration msg="Loading configuration file" file=alertmanager.ymllevel=info ts=2024-12-14T08:41:15.478Z caller=coordinator.go:131 component=configuration msg="Completed loading of configuration file" file=alertmanager.ymllevel=info ts=2024-12-14T08:41:15.480Z caller=main.go:485 msg=Listening address=:9093level=info ts=2024-12-14T08:41:17.453Z caller=cluster.go:648 component=cluster msg="gossip not settled" polls=0 before=0 now=1 elapsed=2.000108213s -
Open a browser or use
curlto verify that Alertmanager is running:http://localhost:9093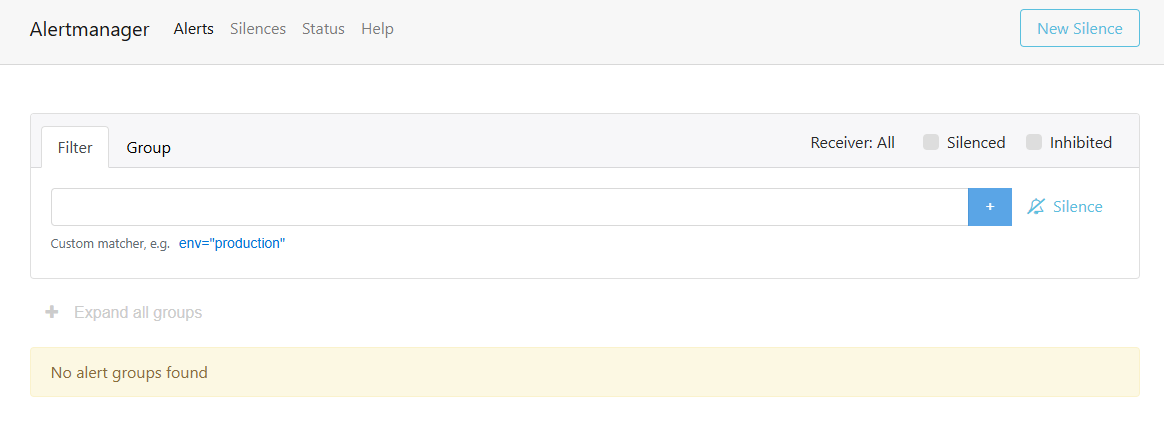
-
To run Alertmanager as a service, create a systemd unit file in
/etc/systemd/system/alertmanager.service:[Unit]Description=AlertmanagerWants=network-online.targetAfter=network-online.target[Service]User=alertmanagerGroup=alertmanagerType=simpleExecStart=/usr/bin/alertmanager \--config.file=/etc/alertmanager/alertmanager.yml \--storage.path=/var/lib/alertmanager \--log.level=infoRestart=always[Install]WantedBy=multi-user.target -
Update permissions of the systemd unit file.
chmod 664 /etc/systemd/system/alertmanager.service -
Enable and start the Alertmanager service.
systemctl daemon-reloadsystemctl enable --now alertmanagersystemctl status alertmanager -
Verify that the Alertmanager server is running.
$ curl localhost:9093 -
Go back to the Alertmanager console and append the
/metricsto the site URL.http:localhost:9091/metrics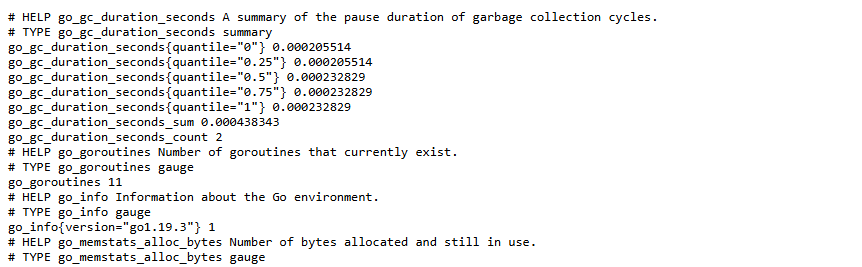
Configure Prometheus
After Alertmanager is installed and running, you need to configure Prometheus to use it.
# Global configuration
global:
  scrape_interval: 15s
  evaluation_interval: 15s

# Alerting configuration
alerting:
  alertmanagers:
    - static_configs:
        - targets:
            - localhost:9093

# Scrape configurations
scrape_configs:
  - job_name: 'prometheus'
    scrape_interval: 15s
    scrape_timeout: 5s
    sample_limit: 1000
    static_configs:
      - targets: ['localhost:9090']
If you have multiple Alertmanagers:
alerting:
  alertmanagers:
    - static_configs:
        - targets:
            - alertmanager1-ip:9093
            - alertmanager2-ip:9093
            - alertmanager3-ip:9093
Restart Prometheus:
systemctl restart prometheus
systemctl status prometheus