Testing Alerts
Overview
In this lab, we will test an alert by setting up the rules file and Alertmanager configuration file. The lab environment includes the following nodes:
| Node | Name | Role |
|---|---|---|
| Node1 | project-web | Web Server |
| Node2 | project-app | App Server |
| Node3 | project-db | Database Server |
| Node4 | prometheus | Prometheus Server |
In Node4, the following components are installed
- Prometheus
- Alertmanager
Pre-requisites
- Setup Prometheus on Node4
- Setup Alertmanager on Node4
- Setup Node Exporter on Node1, Node2, and Node3
Test Prometheus Components
Make sure that you have set up the Prometheus components on Node4.
Prometheus:
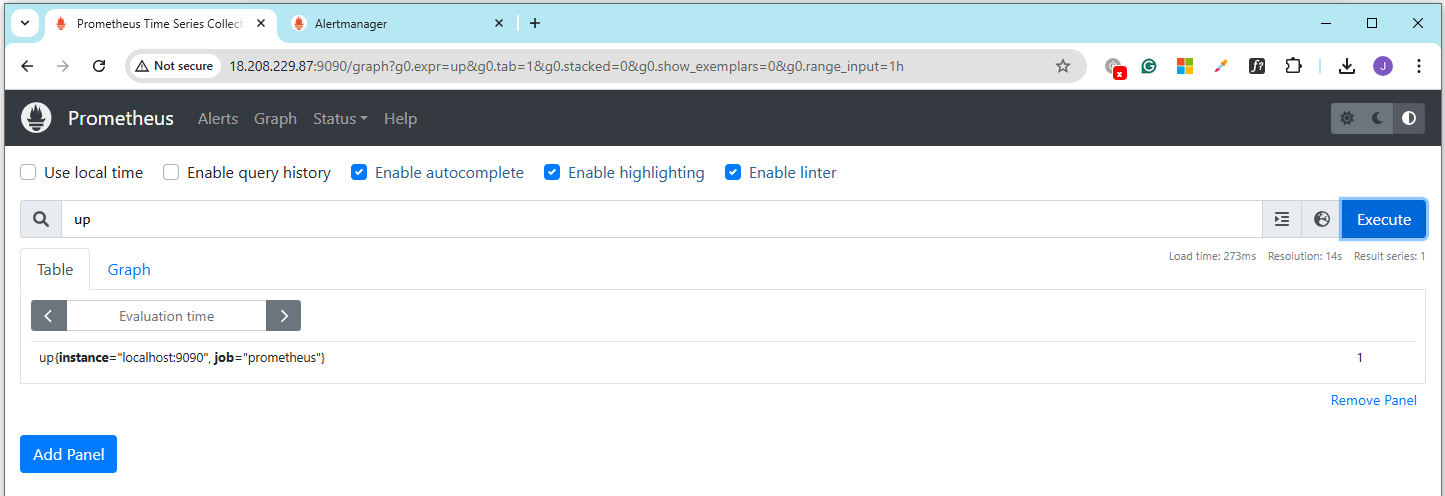
Alertmanager:
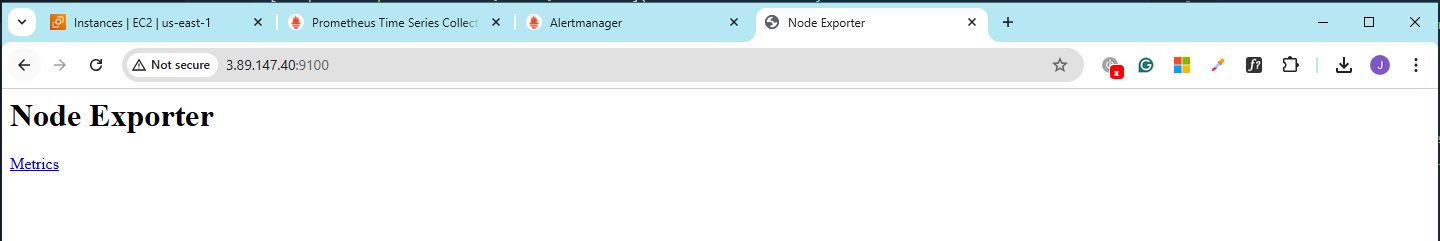
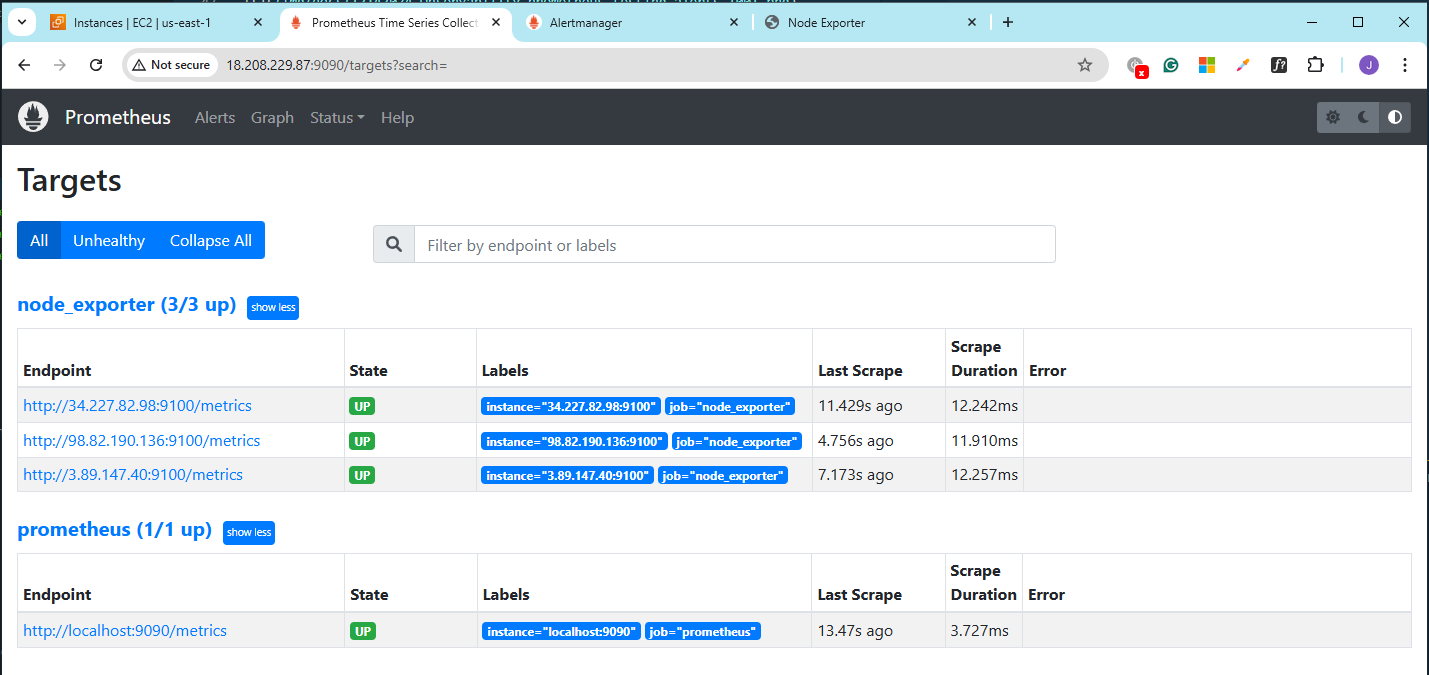
On Nodes 1,2, and 3, make sure that the Node Exporter is set up and running. To confirm this, open a browser and navigate to the URLs below. Do this for all three nodes.
http://node1-ip:9100/
Another way is to access the Prometheus console and go to Status > Targets
Create the Disk Space Rule
Create the rules directory.
mkdir /etc/prometheus/rules/
chown -R prometheus:prometheus /etc/prometheus/rules/
Next, create the /etc/prometheus/rules/rules-diskspace.yml. This rule will calculate when any filesystem has less than 50% free space. We set the threshold high to immeidately trigger it later
groups:
  - name: node
    rules:
      - alert: LowDiskSpace
        expr: 100 * node_filesystem_free_bytes{job="node_exporter"} / node_filesystem_size_bytes{job="node_exporter"} < 50
        labels:
          severity: warning
          environment: prod
The job name should match the job name that is specified as targets in the prometheus.yml file.
Reference the rules directory in the /etc/prometheus/prometheus.yml:
rule_files:
  # - "first_rules.yml"
  # - "second_rules.yml"
  - /etc/prometheus/rules/*.yml
Restart the Prometheus service.
sudo systemctl restart prometheus
sudo systemctl status prometheus
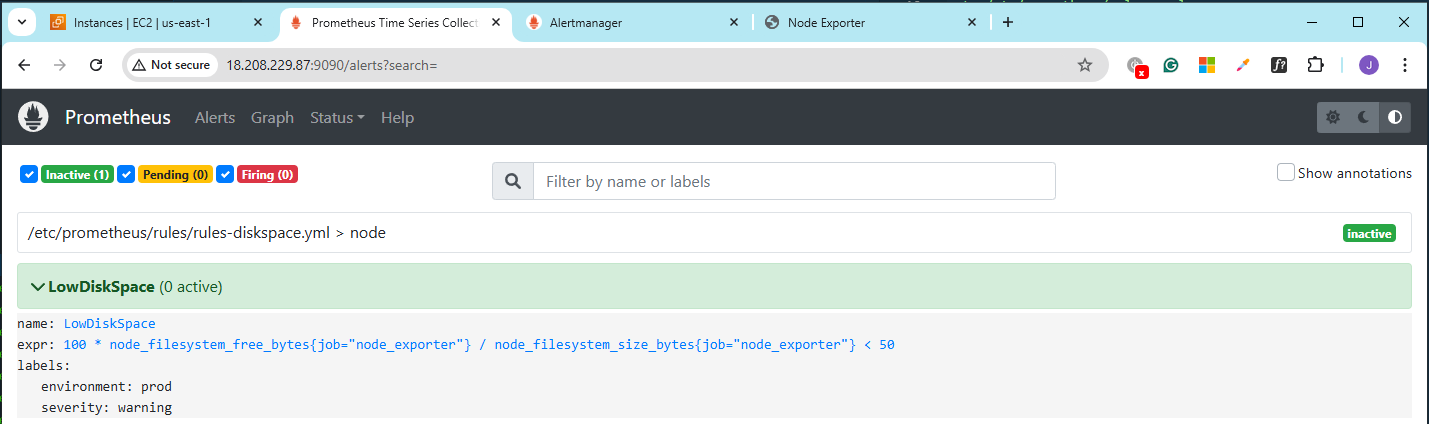
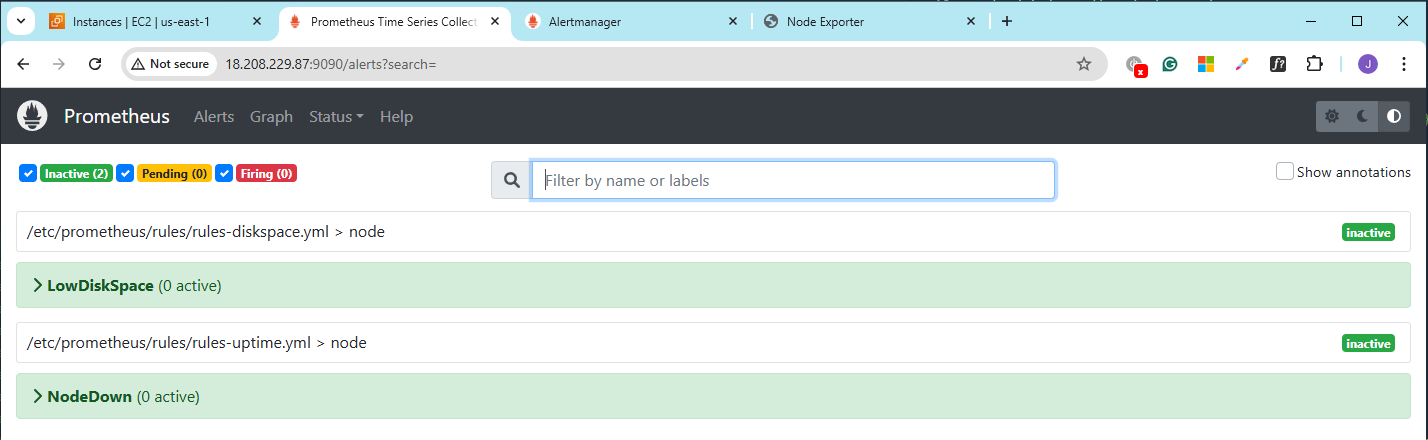
Go back to the Prometheus console and go to Status > Rules.
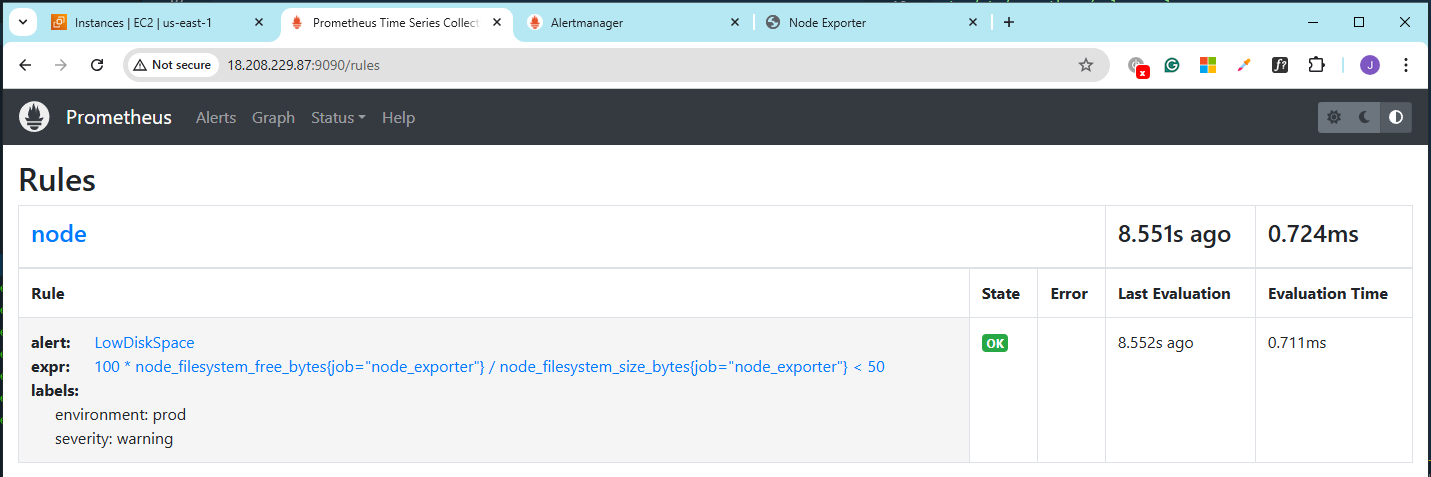
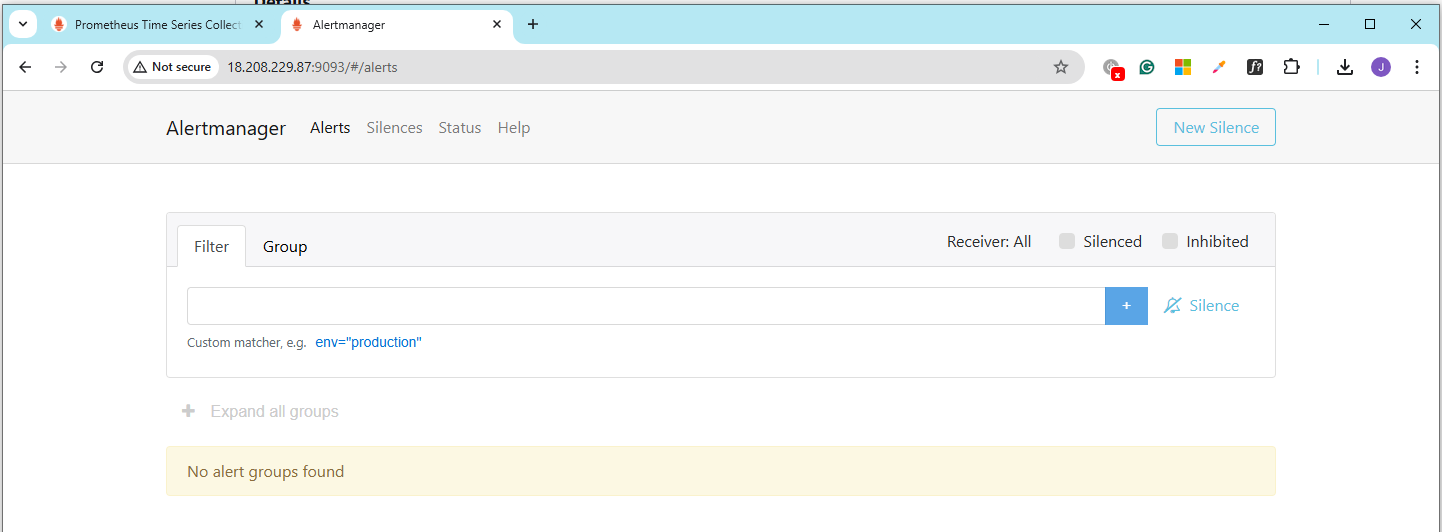
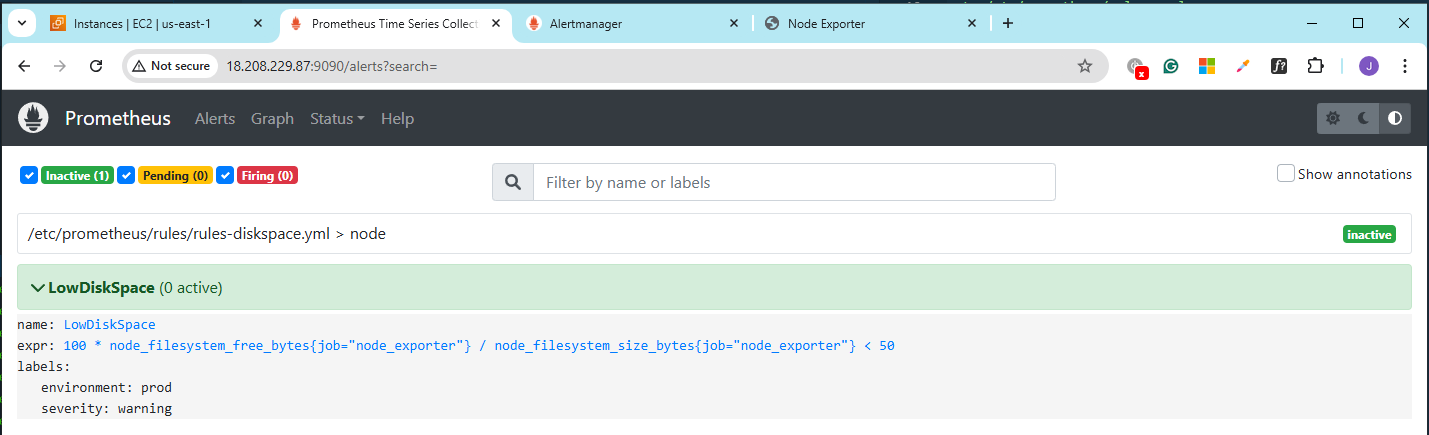
Click Alerts. At the moment, there are still no alerts.
Trigger the Disk Space Rule
Login to node1 and check the filesystem:
$ df -h

Filesystem      Size  Used Avail Use% Mounted on
devtmpfs        4.0M     0  4.0M   0% /dev
tmpfs           383M     0  383M   0% /dev/shm
tmpfs           154M  4.4M  149M   3% /run
/dev/xvda4      8.8G  1.6G  7.2G  19% /
/dev/xvda3      960M  168M  793M  18% /boot
/dev/xvda2      200M  7.1M  193M   4% /boot/efi
tmpfs            77M     0   77M   0% /run/user/1000
To trigger the alert, use dd to generate large dummy files. For example, to create a 5GB dummy file:
dd if=/dev/zero of=/tmp/dummyfile bs=1M count=5000
Now check the available disk space again.
$ df -h

Filesystem      Size  Used Avail Use% Mounted on
devtmpfs        4.0M     0  4.0M   0% /dev
tmpfs           383M     0  383M   0% /dev/shm
tmpfs           154M  4.4M  149M   3% /run
/dev/xvda4      8.8G  6.5G  2.3G  74% /
/dev/xvda3      960M  168M  793M  18% /boot
/dev/xvda2      200M  7.1M  193M   4% /boot/efi
tmpfs            77M     0   77M   0% /run/user/1000
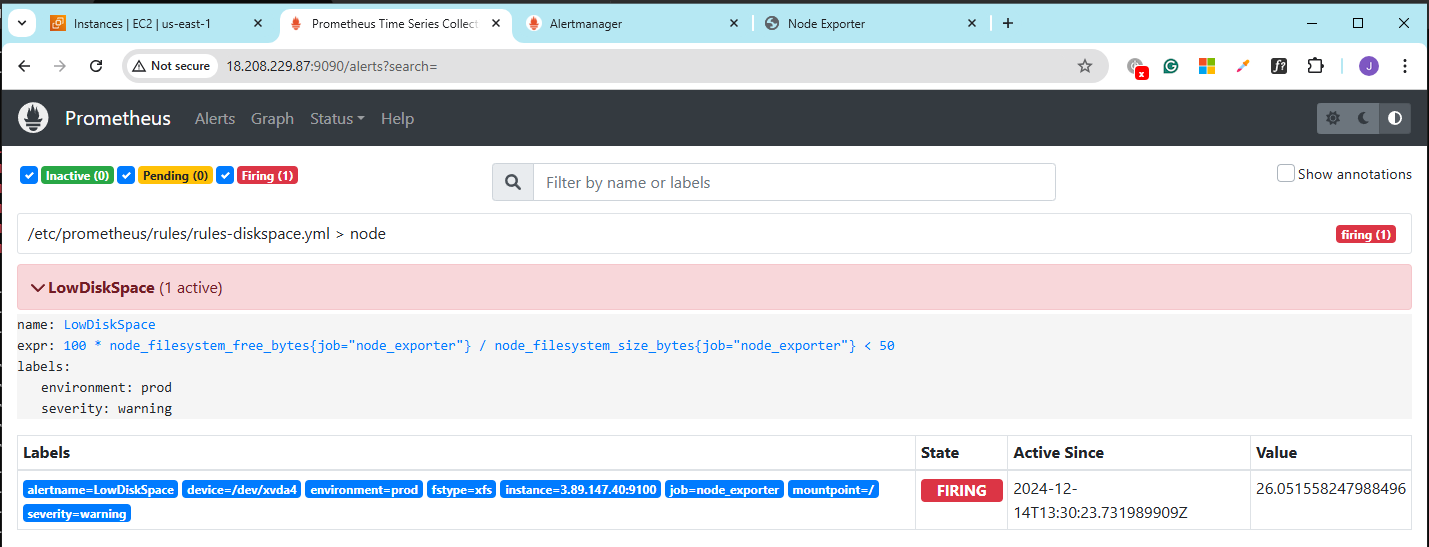
Now go back to the Prometheus console and check the Alerts again. The alert should now change from Inactive to Firing.
Clear the Disk Space Alert
To clear the alert, we need to resolve the issue. The dd command from the previous section generated a 5GB file in /tmp directory.
$  ll /tmp/

total 5120000
-rw-r--r--. 1 root root 5242880000 Dec 14 13:30 dummyfile
drwx------. 3 root root         17 Dec 14 11:33 systemd-private-b9a8aa9cc4e34627990ad1928bec10a3-chronyd.service-bQtk6d
drwx------. 3 root root         17 Dec 14 11:33 systemd-private-b9a8aa9cc4e34627990ad1928bec10a3-dbus-broker.service-FBCMcE
drwx------. 3 root root         17 Dec 14 11:33 systemd-private-b9a8aa9cc4e34627990ad1928bec10a3-kdump.service-NjWS7M
drwx------. 3 root root         17 Dec 14 11:33 systemd-private-b9a8aa9cc4e34627990ad1928bec10a3-systemd-logind.service-BKZu0J
To free up disk space, delete the large dummy file and recheck the disk usage:
rm -f /tmp/dummyfile
Once deleted, the disk space usage should decrease significantly.
$ df -h

Filesystem      Size  Used Avail Use% Mounted on
devtmpfs        4.0M     0  4.0M   0% /dev
tmpfs           383M     0  383M   0% /dev/shm
tmpfs           154M  4.4M  149M   3% /run
/dev/xvda4      8.8G  1.6G  7.2G  19% /
/dev/xvda3      960M  168M  793M  18% /boot
/dev/xvda2      200M  7.1M  193M   4% /boot/efi
tmpfs            77M     0   77M   0% /run/user/1000
Check the alerts again in the Prometheus console.
Verify Alerting Configuration
After you install Alertmanager in the Prometheus server, make sure you also set the alerting configuration in the /etc/prometheus/prometheus.yml:
alerting:
  alertmanagers:
    - static_configs:
        - targets:
          - localhost:9093
Restart Prometheus:
systemctl restart prometheus
systemctl status prometheus
Create the Uptime Rules
Create another rule file: /etc/prometheus/rules/rules-uptime.yml.
groups:
  - name: node
    rules:
      - alert: NodeDown
        expr: up{job="node_exporter"} == 0
        for: 10s
        labels:
          severity: critical
        annotations:
          message: "node {{.Labels.instance}} is down"
The job name should match the job name that is specified as targets in the prometheus.yml file.
Go to the Prometheus console > Status > Rules.
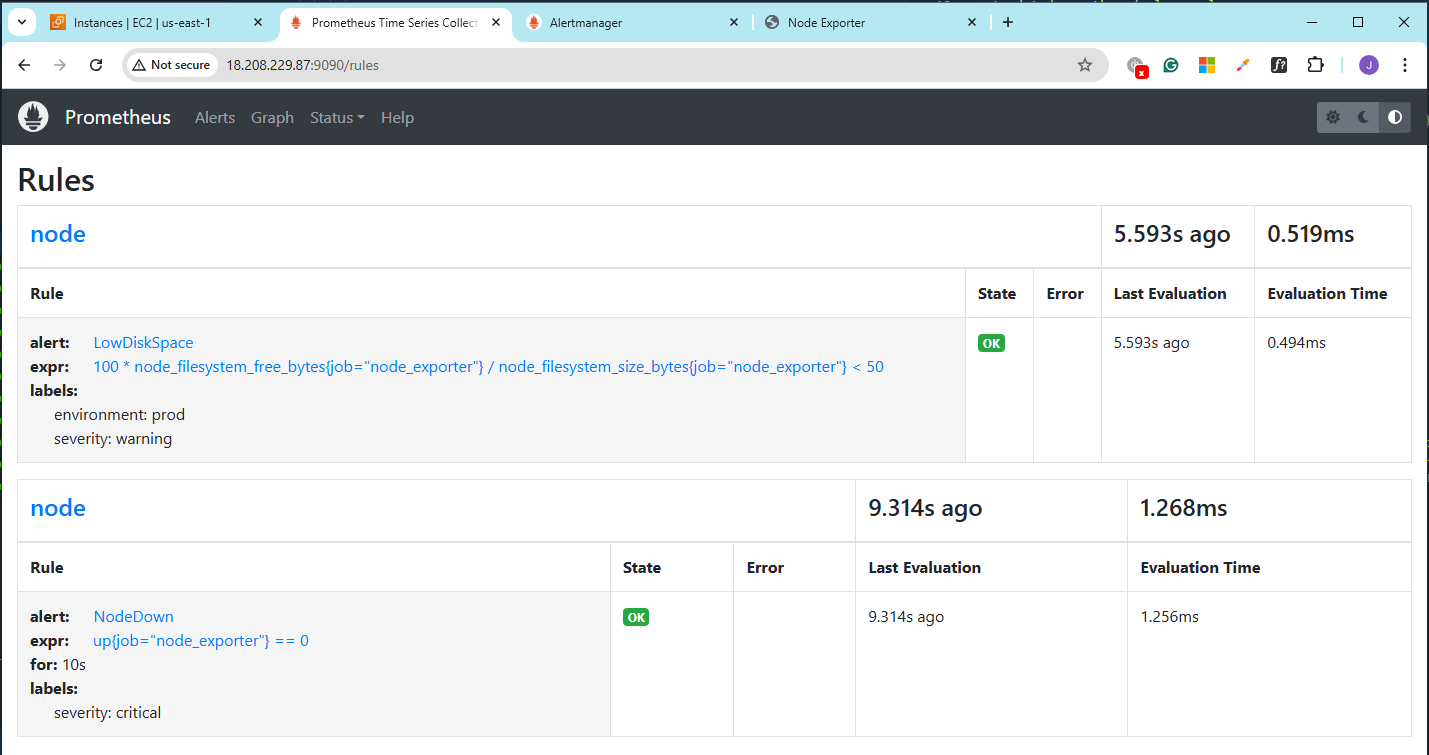
Check the Alert. So far so good.
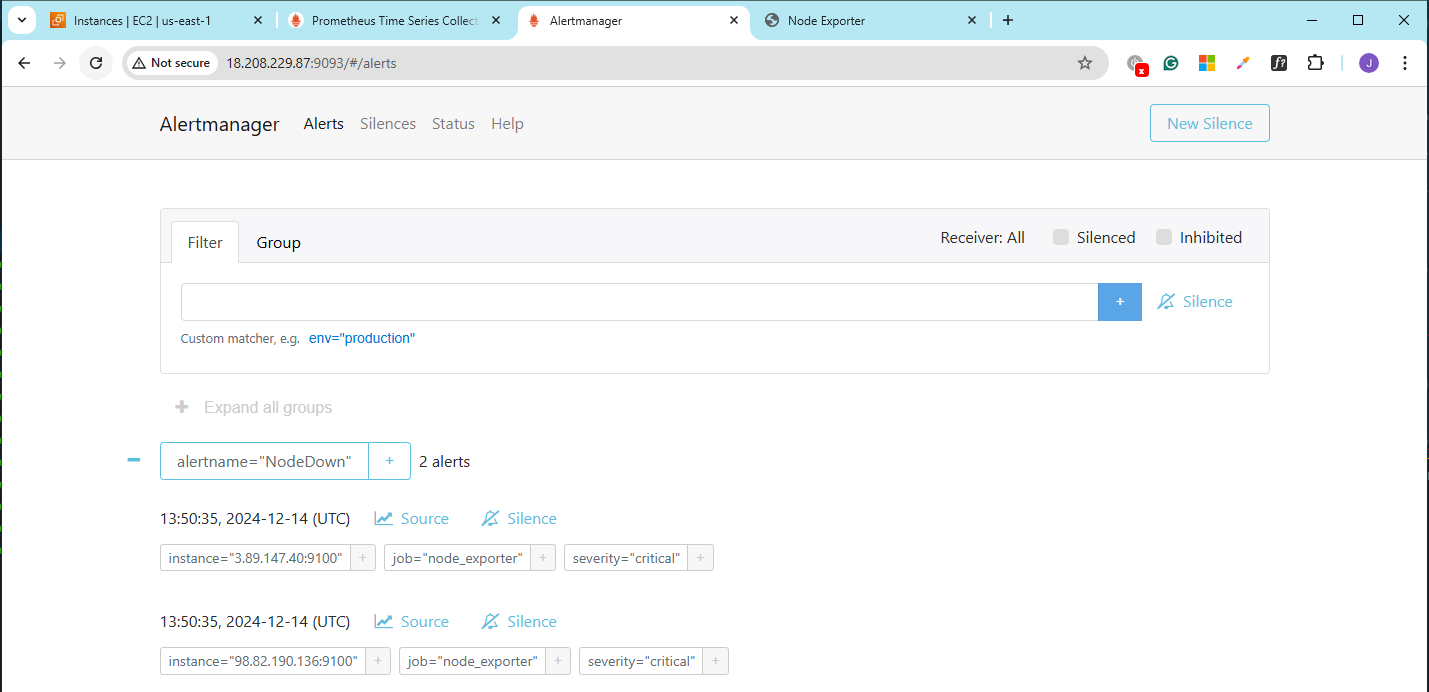
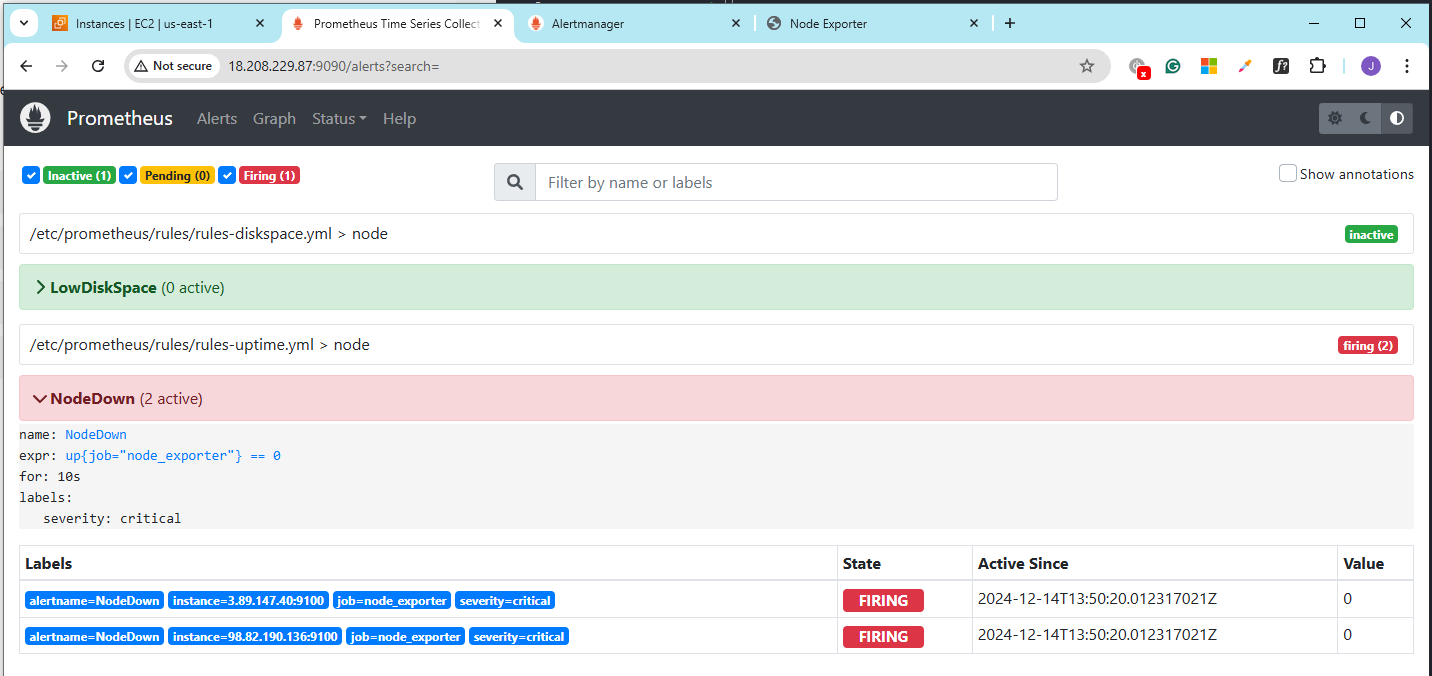
Trigger the Uptime Rule
Turn off Node1 and Node3. Prometheus should not be able to reach the two targets.
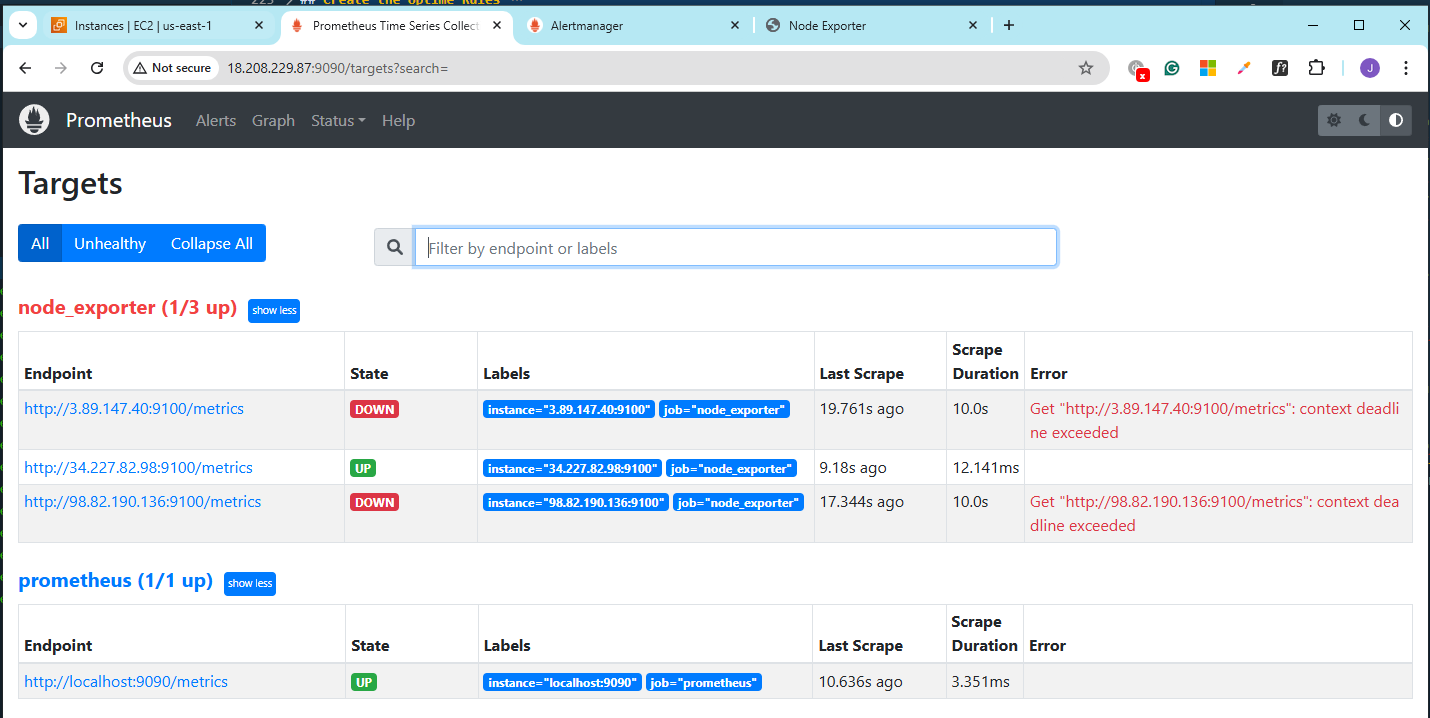
Then check the alerts again in the Prometheus console.
Check the Alertmanager console. You might need to refresh it a few times.