Alerts
Overview
Prometheus alerting allows you to define conditions for monitoring metrics and send notifications when thresholds are breached. Alerts are configured in rule files and can be sent to external systems like Slack, email, or PagerDuty using Alertmanager.
- Each rule specifies the condition, duration, and labels for the alert.
- Note that Prometheus only trigger alerts, NOT send alerts.
- Alertmanager processes alerts and routes them to defined notification channels.
- One Alertmanager can support multiple Prometheus servers
Alerting Rules
Alerting Rules in Prometheus are similar to Recording Rules but are specifically designed to trigger notifications when certain conditions are met. Both rules can be configured in the same YAML file under a single rule group or separate groups, depending on your configuration needs.
groups:
  - name: example-rules
    rules:
      # Recording Rule
      - record: job:cpu_usage:avg_rate
        expr: avg(rate(cpu_usage_seconds_total[5m])) by (job)

      # Alerting Rule
      - alert: HighCPUUsage
        expr: avg(rate(cpu_usage_seconds_total[5m])) by (instance) > 0.8
        for: 10m
        labels:
          severity: critical
        annotations:
          summary: "High CPU usage detected"
          description: "Instance {{ $labels.instance }} has exceeded 80% CPU usage for over 10 minutes."
Explanation:
-
Recording Rule:
- Computes the average CPU usage rate grouped by
jobover the last 5 minutes. - Stores the result as
job:cpu_usage:avg_rate.
- Computes the average CPU usage rate grouped by
-
Alerting Rule:
- Triggers an alert when average CPU usage exceeds 80% for a specific
instancefor more than 10 minutes. - Includes labels and annotations for alert categorization and detailed information.
- Triggers an alert when average CPU usage exceeds 80% for a specific
The for Clause
The for clause specifies the duration a condition must be true before an alert is triggered. This helps prevent false alarms by ensuring the issue persists over the defined period.
groups:
  - name: example-rules
    rules:
      # Recording Rule
      - record: job:cpu_usage:avg_rate
        expr: avg(rate(cpu_usage_seconds_total[5m])) by (job)

      # Alerting Rule
      - alert: HighCPUUsage
        expr: avg(rate(cpu_usage_seconds_total[5m])) by (instance) > 0.8
        for: 10m
        labels:
          severity: critical
        annotations:
          summary: "High CPU usage detected"
          description: "Instance {{ $labels.instance }} has exceeded 80% CPU usage for over 10 minutes."
In th example above, the HighCPUUsage alert will only fire if the average CPU usage remains above 80% for 10 minutes continuously. This duration ensures that temporary spikes in CPU usage do not trigger unnecessary alerts and provides a more reliable and meaningful notifications.
Including the for clause in alerting rules prevents race conditions and mitigates the impact of transient issues, such as scrape timeouts or temporary network disruptions. These problems might cause individual scrapes to fail, leading to false-positive alerts.
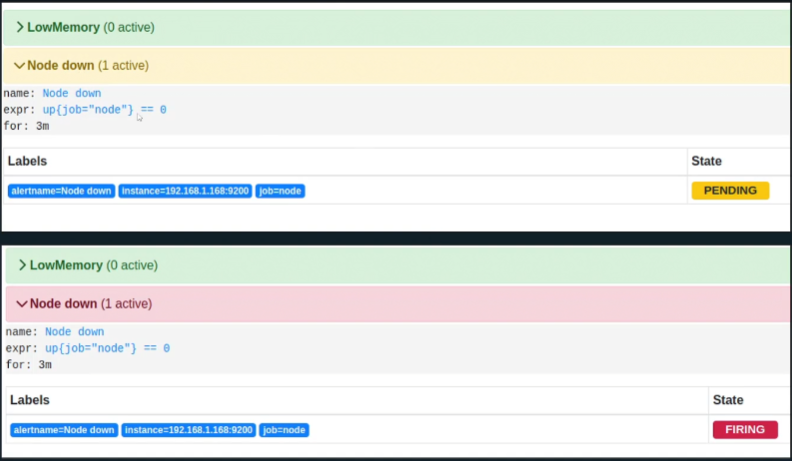
Alert States
Alerts in Prometheus can exist in one of three states, depending on their evaluation results over time. These states help track the lifecycle of an alert.
-
Inactive: The alert condition is not met, and the alert remains dormant.
-
Pending: The alert condition is met, but the
forclause duration has not yet elapsed. -
Firing: The alert condition has been met continuously for the
forclause duration, and the alert is now active.
Labels
Labels can be added to alerts to classify and provide context, making them easier to organize and filter. They are also used by Alertmanager to group, match, and route specific alerts for notification or silencing.
groups:
  - name: example-rules
    rules:
      - alert: HighCPUUsage
        expr: avg(rate(cpu_usage_seconds_total[5m])) by (instance) > 0.8
        for: 10m
        labels:
          severity: critical
        annotations:
          summary: "High CPU usage detected"
          description: "Instance {{ .Labels.instance }} has exceeded 80% CPU usage for over 10 minutes."
Annotations
Annotations can be used to provide additional context for alerts, such as descriptions or helpful links. These are primarily used to include detailed information in alert notifications sent by Alertmanager. Unlike labels, annotations cannot be used to classify or match alerts for triggering notifications.
Annotations are templated using Go templating language:
-
To get alert label:
{{.Labels}} -
To get instance label:
{{.Labels.instance}) -
To get the firing sample value:
{{.Value})
In the example below, thes rule triggers an alert called HighMemoryUsage when the average memory usage (memory_usage_bytes) over the last 5 minutes exceeds 80 bytes for an instance and persists for 10 minutes.
groups:
  - name: example-rules
    rules:
      - alert: HighMemoryUsage
        expr: avg(rate(memory_usage_bytes[5m])) by (instance) > 80
        for: 10m
        labels:
          severity: warning
        annotations:
          summary: "High Memory Usage Alert"
          description: "Instance {{ .Labels.instance }} is using {{ .Value }} bytes of memory, which exceeds the threshold."
          details: "Check logs and performance metrics for {{ .Labels.instance }} to diagnose the issue."