Recording Rules
Overview
Recording rules allow you to precompute frequently used queries and store the results as new time series, which then improves query performance. They are useful for reducing query complexity and optimizing system performance.
- Store the results of a complex query as a new time series.
- Can reduce computational load during frequent queries.
- Help improve performance and speed up dashboarding and alerting.
With Recording Rules, you don't have to evaluate the expressions on the fly since they are stored in the database.
Rules Configuration
Recording rules are stored in a rules.yml file, which is then referenced in the main prometheus.yml file.
groups:
  - name: <group name 1>
    rules:
      - interval: <evaluation interval>
        record: <rule name 1>
        expr: <promql expression 1>
        labels:
          <label name>: <label value>
      - record: <rule name 2>
        expr: <promql expression 2>
        labels:

  - name: <group name 2>
    rules:
      # Additional rules for group 2, if any
Each file defines one or more rule groups under the groups key. If the evaluation interval is not defined, it will default to the value set in the Prometheus configuration.
recordspecifies the rule name, which is defined in theexpr.- Use
labelsto add or remove labels before storing the results. - Rules are evaluated in the order in which they are declared.
Calling the Rules File
To reference the rules file in the Prometheus config file:
global:
  scrape_interval: 15s
  evaluation_interval: 15s
rules_files:
  - rules.yml
scrape_configs:
  - job_name: 'prometheus'
    scrape_interval: 15s
    scrape_timeout: 5s
    sample_limit: 1000
    static_configs:
      - targets: ['localhost:9090']
Alternatively, you can use globbing to specify multiple rules files:
rules_files:
  - /etc/prometheus/rules/*.yml
Remember, after making changes to a rule file, you need to restart the Prometheus service:
sudo systemctl restart prometheus
sudo systemctl status prometheus
Record Rule Naming
A good naming scheme allows for easy identification and management of rules. The recommended format is:
level:metric:operations
Where:
-
Level
- Indicates the aggregation level of the metric based on its labels.
- Always include the
joblabel, along with any other relevant target labels.
-
Metric
- Refers to the metric or time series name being measured.
-
Operations
- Describes the functions and aggregators applied to the metric.
- Examples:
sum,avg,max.
Example Naming:
-
This represents the rate of a metric for the
api-serverjob.job:api-server:rate -
This could represent the maximum value of a metric collected by the
node-exporterinstance.instance:node-exporter:max
Organizing Recording Rules by Job
In addition to a good naming convention, all the rules for a specific job should be contained in the same group to ensure organization and clarity.
In the sample rules.yml file below, all rules for the api-server job are placed within the same group, and similarly for the node-exporter job. This helps keep related rules organized.
groups:
  - name: api-server
    rules:
      - interval: 1m
        record: job:api-server:http_requests_rate_5m
        expr: rate(http_requests_total[5m])
        labels:
          job: 'api-server'
      - interval: 1m
        record: job:api-server:http_requests_rate_1m
        expr: rate(http_requests_total[1m])
        labels:
          job: 'api-server'
      - interval: 1m
        record: job:api-server:avg_response_time
        expr: avg(http_request_duration_seconds) by (job)
        labels:
          job: 'api-server'

  - name: node-exporter
    rules:
      - interval: 1m
        record: instance:node-exporter:avg_memory_usage
        expr: avg(node_memory_MemAvailable_bytes / node_memory_MemTotal_bytes) by (instance)
        labels:
          job: 'node-exporter'
      - interval: 1m
        record: instance:node-exporter:cpu_usage
        expr: avg(rate(node_cpu_seconds_total[5m])) by (instance)
        labels:
          job: 'node-exporter'
Example: Using Recording Rules
In the example below, we are using a recording rule to store the result of a rate calculation for HTTP requests over a 5-minute period.
groups:

  - name: http_requests
    rules:
      - interval: 1m
        record: http_requests_rate_5m
        expr: rate(http_requests_total[5m])
        labels:
          job: 'api-server'

      - interval: 1m
        record: http_requests_rate_1m
        expr: rate(http_requests_total[1m])
        labels:
          job: 'api-server'

  - name: memory_usage
    rules:
      - interval: 1m
        record: avg_memory_usage
        expr: avg(node_memory_MemAvailable_bytes / node_memory_MemTotal_bytes) by (instance)
        labels:
          job: 'node-exporter'
Explanation:
-
http_requests_rate_5m:- Calculates the rate of HTTP requests over a 5-minute window.
- Stores the result as
http_requests_rate_5m.
-
http_requests_rate_1m:- Similar to the previous rule but for a 1-minute rate.
-
avg_memory_usage:- Calculates the average memory usage across instances.
- Shows the ratio of available memory to total memory.
These recording rules help optimize queries by precomputing, storing the results, and making it easier to retrieve them later.
Example: Recording Rules in Action
In this example, we're using recording rules that calculate network rates and average latency.
-
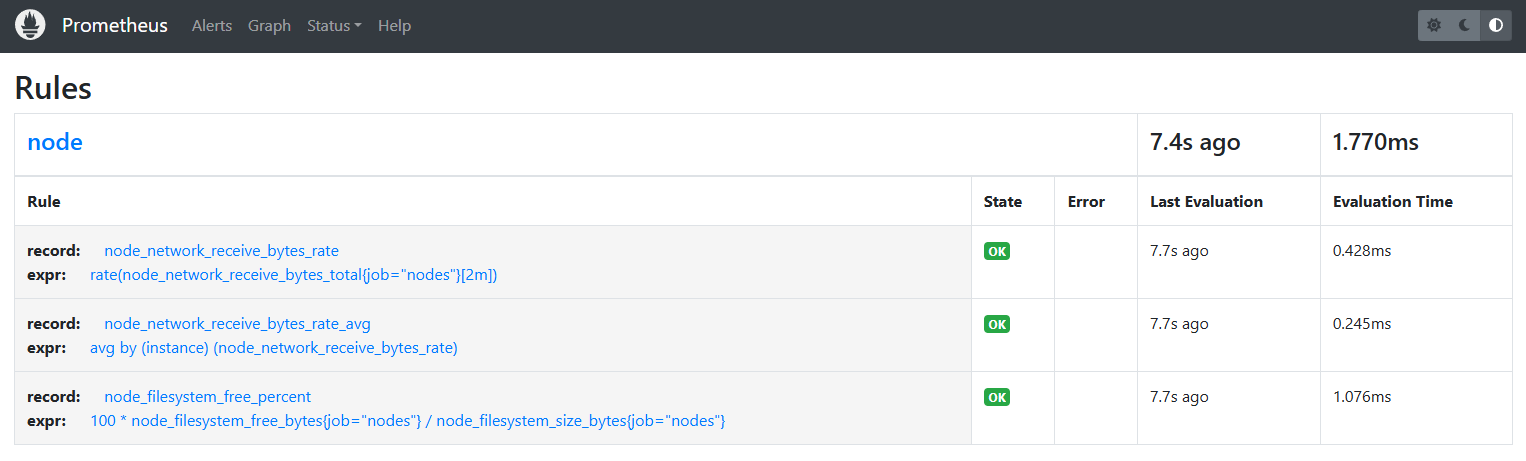
Create the
/etc/prometheus/api-rules.yamlrules file.groups:- name: nodeinterval: 15srules:- record: node_network_receive_bytes_rateexpr: rate(node_network_receive_bytes_total{job="nodes"}[2m])- record: node_network_receive_bytes_rate_avgexpr: avg by(instance) (node_network_receive_bytes_rate)- record: node_filesystem_free_percentexpr: 100 * node_filesystem_free_bytes{job="nodes"} / node_filesystem_size_bytes{job="nodes"} -
Reference them in the
/etc/prometheus/prometheus.ymlfile.rule_files:- "node-rules.yaml" -
Save the file and restart Prometheus service:
systemctl restart prometheussystemctl status prometheus -
To verify, login to the Prometheus console and go to Status > Rules.
-
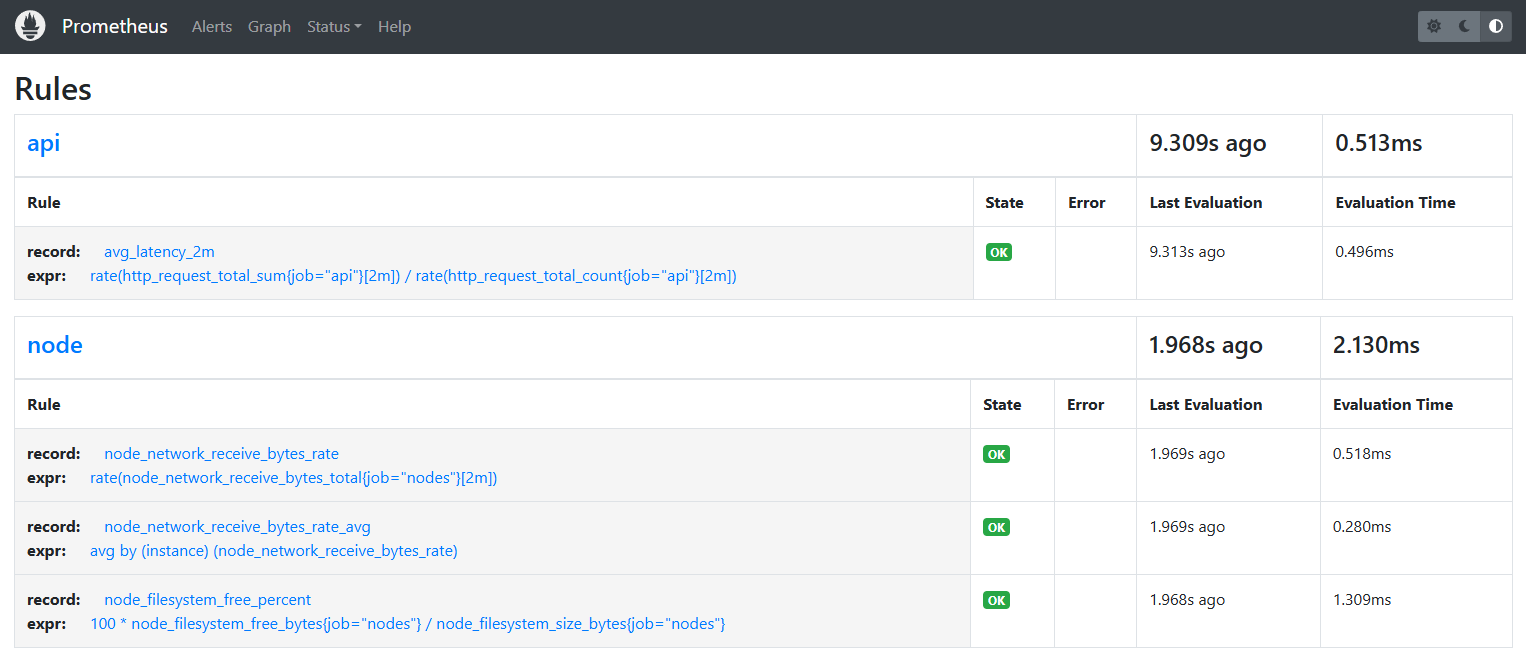
Create a second rule that will track the average latency for past 2 minutes:
cat > /etc/prometheus/api-rules.yamlAdd the rules:
groups:- name: apiinterval: 15srules:- record: avg_latency_2mexpr: rate(http_request_total_sum{job="api"}[2m]) / rate(http_request_total_count{job="api"}[2m]) -
Specify them in the Prometheus configuration file.
rule_files:- "node-rules.yaml"- "api-rules.yaml" -
Restart Prometheus service once again:
systemctl restart prometheussystemctl status prometheus -
Go back to the Prometheus console and verify that all the rule are showing
OK.