Calculated Fields
Overview
Calculated fields let you create new data using existing fields. This helps in transforming, categorizing, or performing calculations without altering the original dataset.
Examples:
- Currency Conversion – Convert sales from USD to Euros using a fixed exchange rate.
- Data Cleaning – Round gas prices or check if an email contains "@gmail.com".
- Date Extraction – Extract the year from a full date field for easier grouping.
- Custom Metrics – Calculate the price-to-earnings (P/E) ratio by dividing price by earnings.
Creating a Calculated Field
To create a new calculated field:
- Go to Analysis > Create Calculated Field
- Enter field name and the formula in the space below.
- Move the new field name to the Measure Values
- By default, Tableau will use
SUMon the new calculated field. - Change aggregation to use
AVERAGE.
See example below:
To edit a calculated field, click the dropdown > Edit. To see other functions, click the arrow.
Functions in Calculated Fields
Functions help perform operations inside calculated fields. They use parentheses to hold arguments, like this:
ROUND([Gas Price], 2)
There's no need to memorize all of the functions because Tableau has a built-in documentations.
Lab: Workbook
In the following examples, we'll use a Gapminder dataset on Mean Years of Schooling.
- Measures average years spent in school (primary to graduate).
- Useful for analyzing social and economic development.
- Data is split by gender and five age groups.
- Includes country, year, and 10 demographic columns.
This dataset is based on information from the Gapminder website, which collects and shares statistics on social, economic, and environmental development at local, national, and global levels.
Download the workbook here: 1_1_calculated_field_for_rounding.twbx
Example: ROUND
In this example, we need to create a calculated field to round data of the Women 25-34 measures.
Problem
Find the number of countries in 1976 that has women in the 25-34 age bracket that are spending, on average, 10 years or more in school.
Steps
-
Go to the Rounding worksheet.
-
Create the
Rounded Women 25-34calculated field. -
Use
ROUNDfunction to round the column to whole numbers (0 decimal point).ROUND([Women 25-34], 0) -
Drag the existing
Women 25-34out of the Marks shelf to remove it. -
Another way is to click the dropdown > Remove.
-
Drag the new
Rounded Women 25-34to the text in the Marks shelf. -
Remove the
Countryfilters. -
Add the
Yearsfield to the Filters shelf and filter for 1976. -
Add
Rounded Women 25-34to the Filters shelf and filter for "at least 10".
Solution
Findings
Based on the filtered results, we can see that there are 4 countries in 1976 that has women in the 25-34 age bracket that are spending, on average, 10 years or more in school.
Example: RATIO
Ratios help compare two values. In this example, we compare the average years of education between men and women. A ratio close to 1 means their education levels are nearly equal.
Problem
Find the ratio of men's and women's average years of education.
Steps
-
Go to the Ratio worksheet.
-
Create a calculated field called
Men:Women[25-34]. -
Set the funtion to calculate men:women ratio for years spent in school.
[Men 25-34]/[Women 25-34] -
Drag the new field to the text card in the Marks shelf.
-
Change the aggregation from
SUMtoAVG.
Solution
Findings
In Russia, the ratio is 0.9821, which means men have an average of 0.98 years of education for every year a woman is educated.
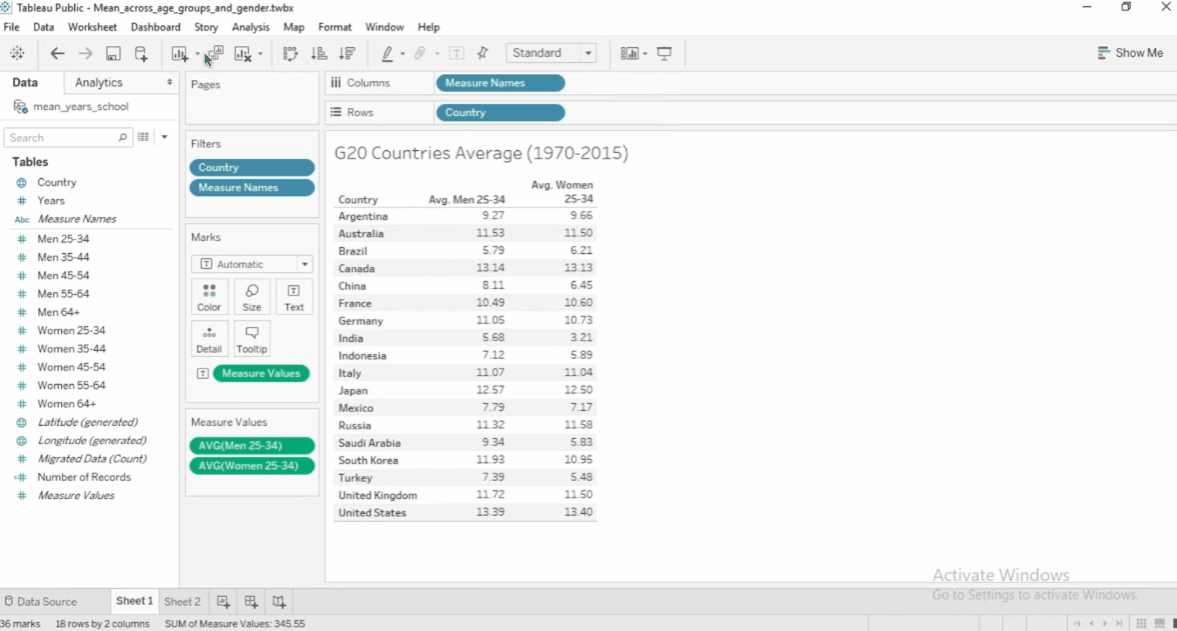
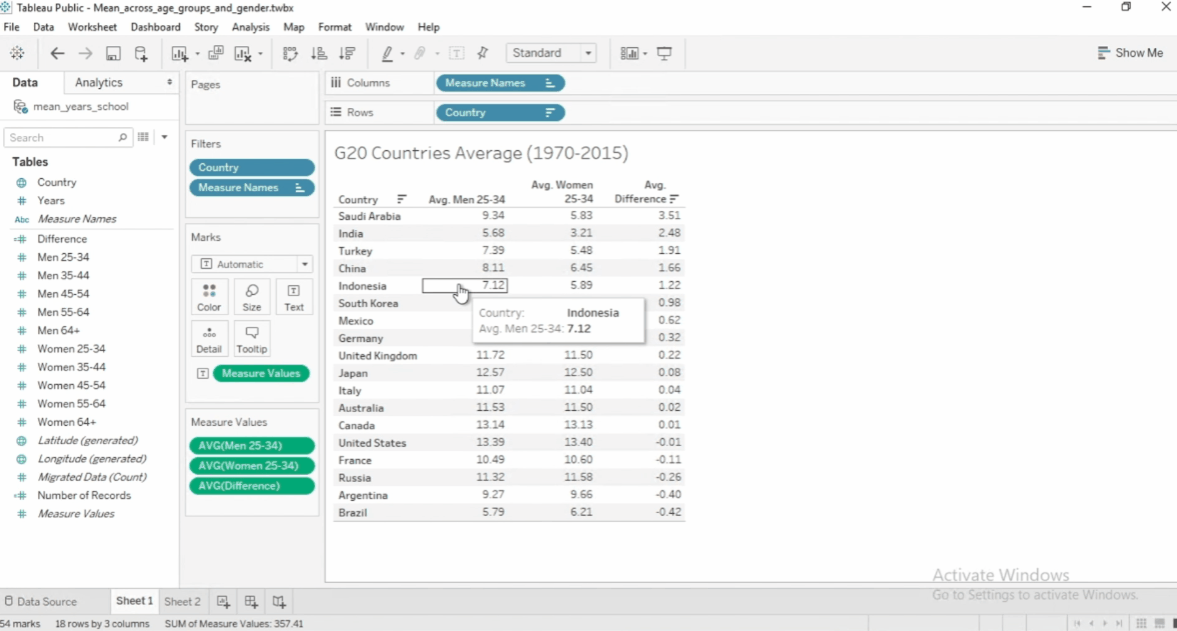
Example: AVERAGE
In this example, we'll create a calculated field for the average across women and men in the age group 25-34.
Problem
Find the country with the highest average in the 25-34 age group.
Steps
-
Go to the Average worksheet.
-
Create a calculated field called
25-34. -
Set the funtion to sum the values for men and women in the 25-34 age group and divide by 2 to get the average.
[Men 25-34]/[Women 25-34] -
Drag the new field to the text card in the Marks shelf.
-
Change the aggregation from
SUMtoAVG. -
Sort the data in descending order to get the highest average at the top.
Solution
Findings
The country with the highest average (13.397) is the United States.