Enhancing Visualizations
Overview
Reference lines, trend lines, and forecastsing provide context and help with data analysis.
Reference Lines
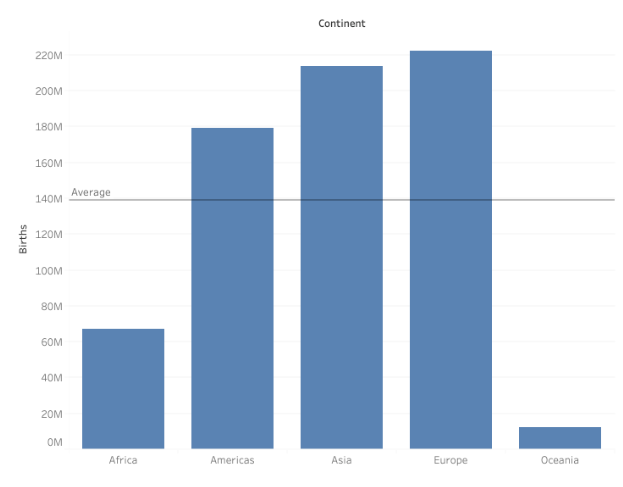
Reference lines are lines on the chart representing a key value (e.g., average). They help compare individual data points to a benchmark.
Trend Lines
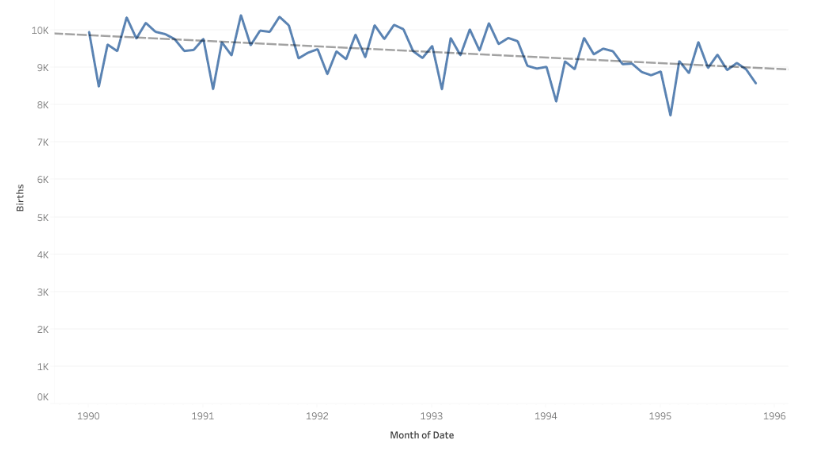
Trend line show overall movement in the data over time. This helps in identifying the increasing, decreasing, or stable trends.
Forecasting
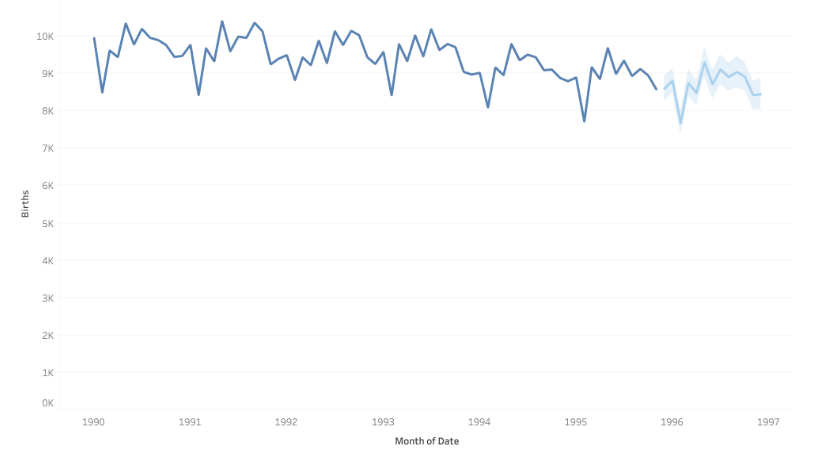
Forecasting predicts future values based on past trends. It uses mathematical models to extend trends forward.
Example: Birth Trends
In this example, we'll use UN Health Data to analyze birth trends in Portugal over five years with a line chart, adding reference lines, trend lines, and forecasts for deeper insights.
Download the workbook here: 3_1_UN_stats_yearly_data.twbx
Adding a Reference Line
Let's start with creating the line chart to see the trends.
- Drag
Dateto Columns. - Drag
Birthsto Rows. - Click the
YEAR(Date)and select the second "Month" on the list. - Make sure the
MONTH(Date)shows green, and not blue.
Add the filters:
- Drag
Countryto Filters and select a country (e.g., Portugal). - Drag
Dateto Filters > Years > Select 2014 to 2018.
Add the reference line to the line chart:
- Open the Analytics pane and drag Reference Line into the chart.
- Set it to show the average number of births across all months.
- Click OK to add the line.
The reference line helps visualize how Portuguese births compare to the overall average over time.
To remove the reference line, click the line and select Remove.
Adding a Trend Line
To determine if there is an upward or downward trend in the number of births over the part 5 years, add a trend line.
- In the Analytics pane, drag Trend Line into the chart.
- Choose Linear to see if births are increasing or decreasing.
Based on this, we can see that there is a slight upwards trend on the number of births.
To remove the trend line, click the line and deselect Show Trend Lines.
Forecasting Future Births
To get an estimate on the number of births the following year, use forecasting.
- Drag Forecast from the Analytics pane and drop it on the chart.
- Tableau will generate a prediction for the next year.
Forecasting helps predict future trends and allows for better decision-making.