Using Tableau
Overview
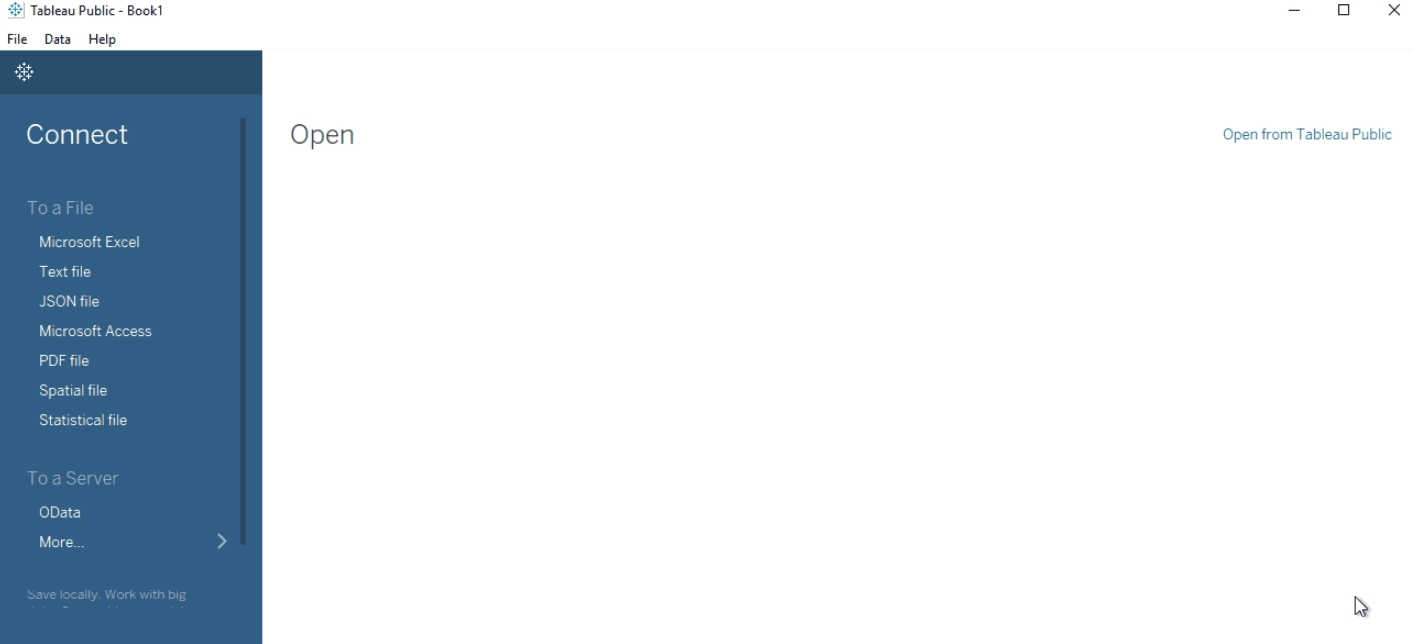
Before creating visualizations in Tableau, you need to connect to a data source. Tableau supports many data sources, depending on the version you are using:
- Tableau Public – Works with limited sources like CSV
- Tableau Desktop – Supports databases, cloud data, and more
Connecting to a CSV File
CSV (Comma-Separated Values) files store data in a simple format. To connect a CSV file in Tableau:
- Click Text File
- Select the CSV file (e.g.,
airbnb_listings.csv) - Tableau loads the data for preview
Exploring the Data
Once loaded, you can:
- Rename columns – Double-click a column name to edit
- Check data types – Icons indicate numbers, text, or locations
- Change data types – Click the icon to adjust if needed
Opening a Workbook
Tableau saves workbooks in different formats depending on the version and data storage needs. Two common file formats are Tableau Workbook (.twb) and Tableau Packaged Workbook (.twbx).
- On your computer, locate the workbook and double-click.
- Another way to open a file is to click File > Open > Select the Workbook.
See below:
Loading a CSV File
To load a CSV File, click "Text File" from the Tableau start page and then select the file.

Data Roles in Tableau
When you connect a data source, Tableau automatically separates fields into data roles: Dimensions and Measures.
- Dimensions group data into categories
- Measures provide numerical values for analysis
Tableau assigns data roles to fields automatically, but it's good practice to review and adjust them as needed.
For more information about dimension and measures, please see Data Properties.
Converting Data Types
-
Dimensions vs. Measures
- Convert fields between dimensions and measures
- Example: Convert "Number of Reviews per Month" to a measure to calculate averages
-
Discrete vs. Continuous
- Change fields between discrete and continuous
- Example: "Shoe Size" as a discrete measure vs. "Date" as a continuous dimension
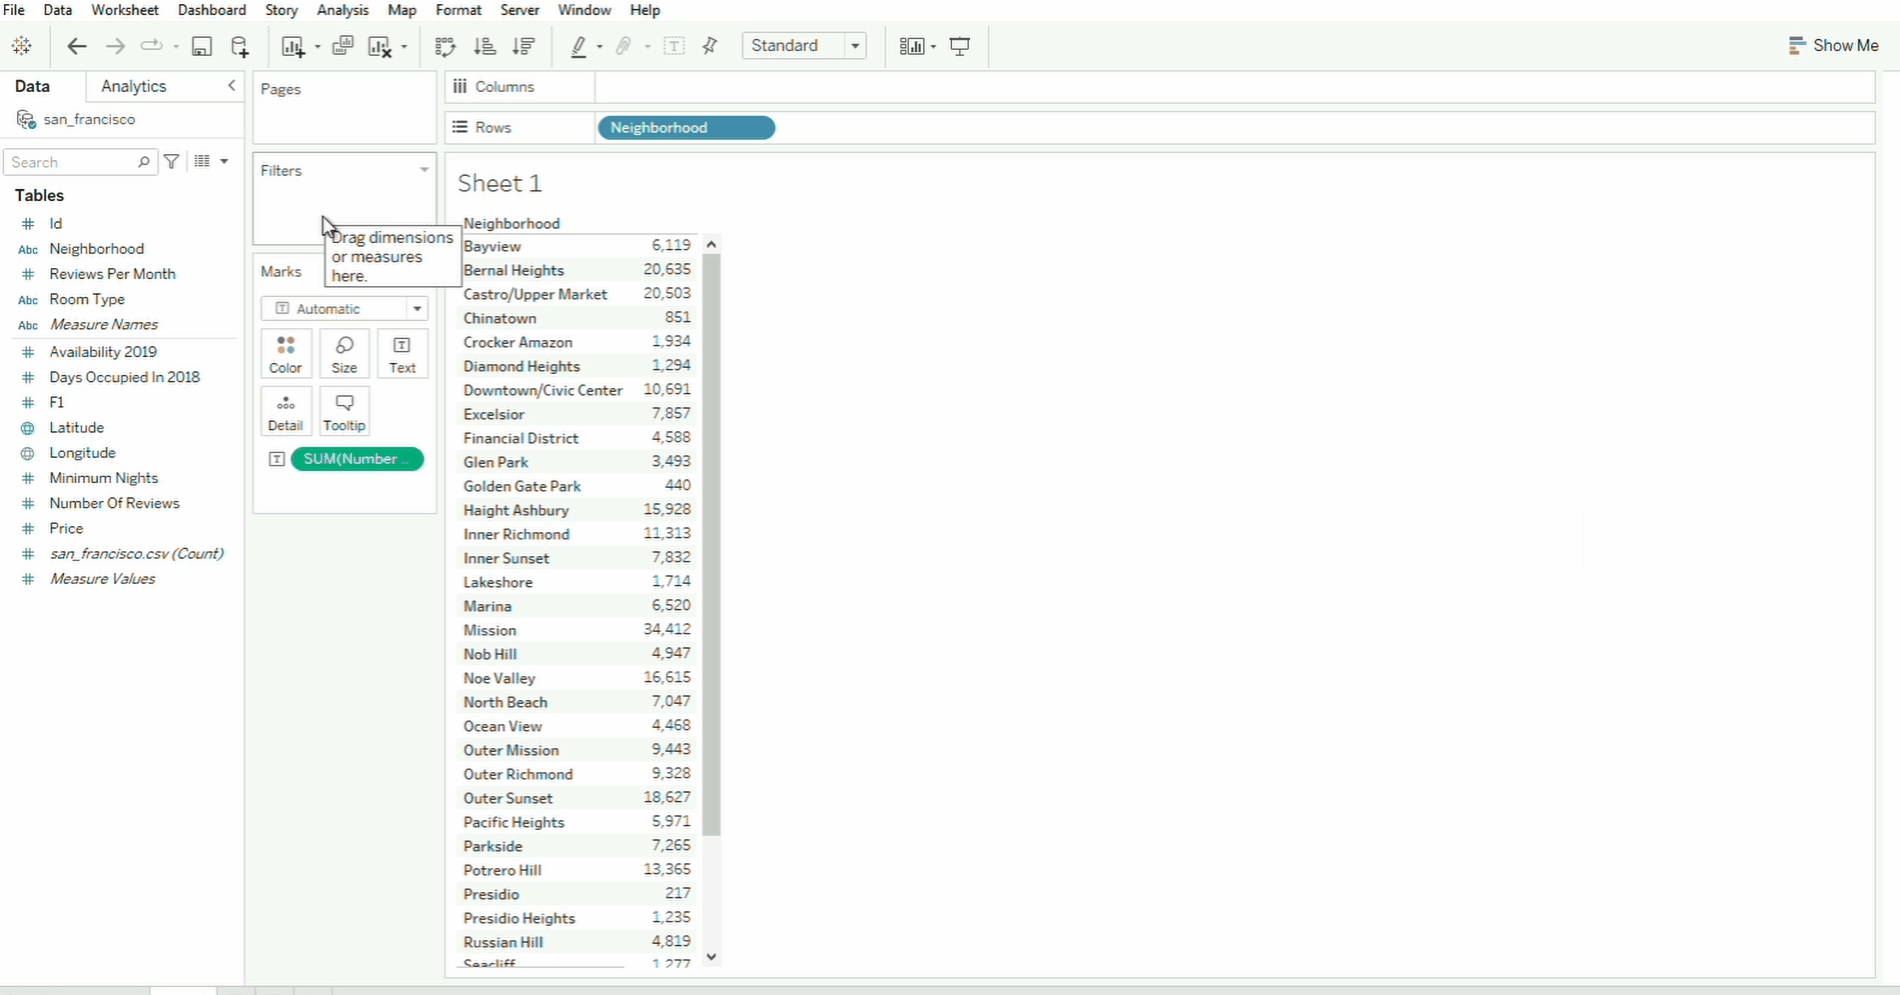
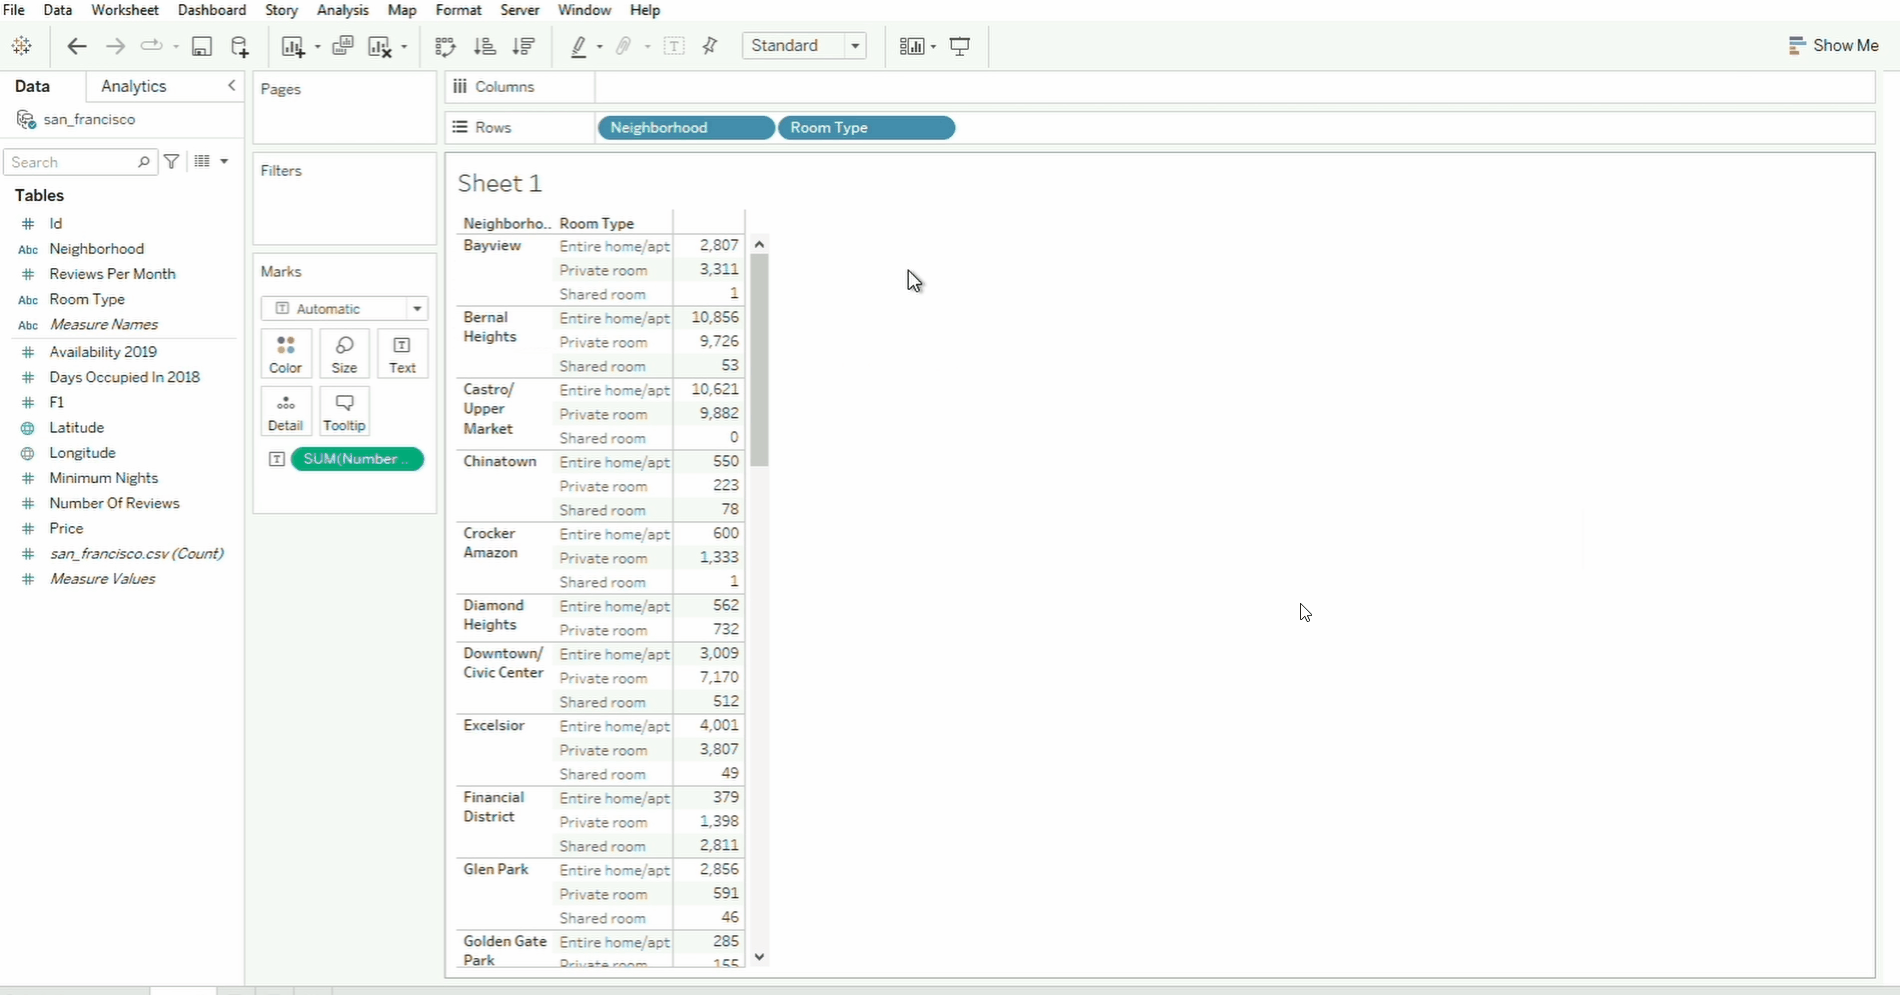
Drag and Drop
To build visualizations, simply drag and drop the fields to the canvas. When you drag the field, the sections/shelf where you can drop it will be outlined in orange. In the example below, the neighborhood field is dropped onto the Rows field while the `Number of Reviews is dropped to the text card inside Marks.
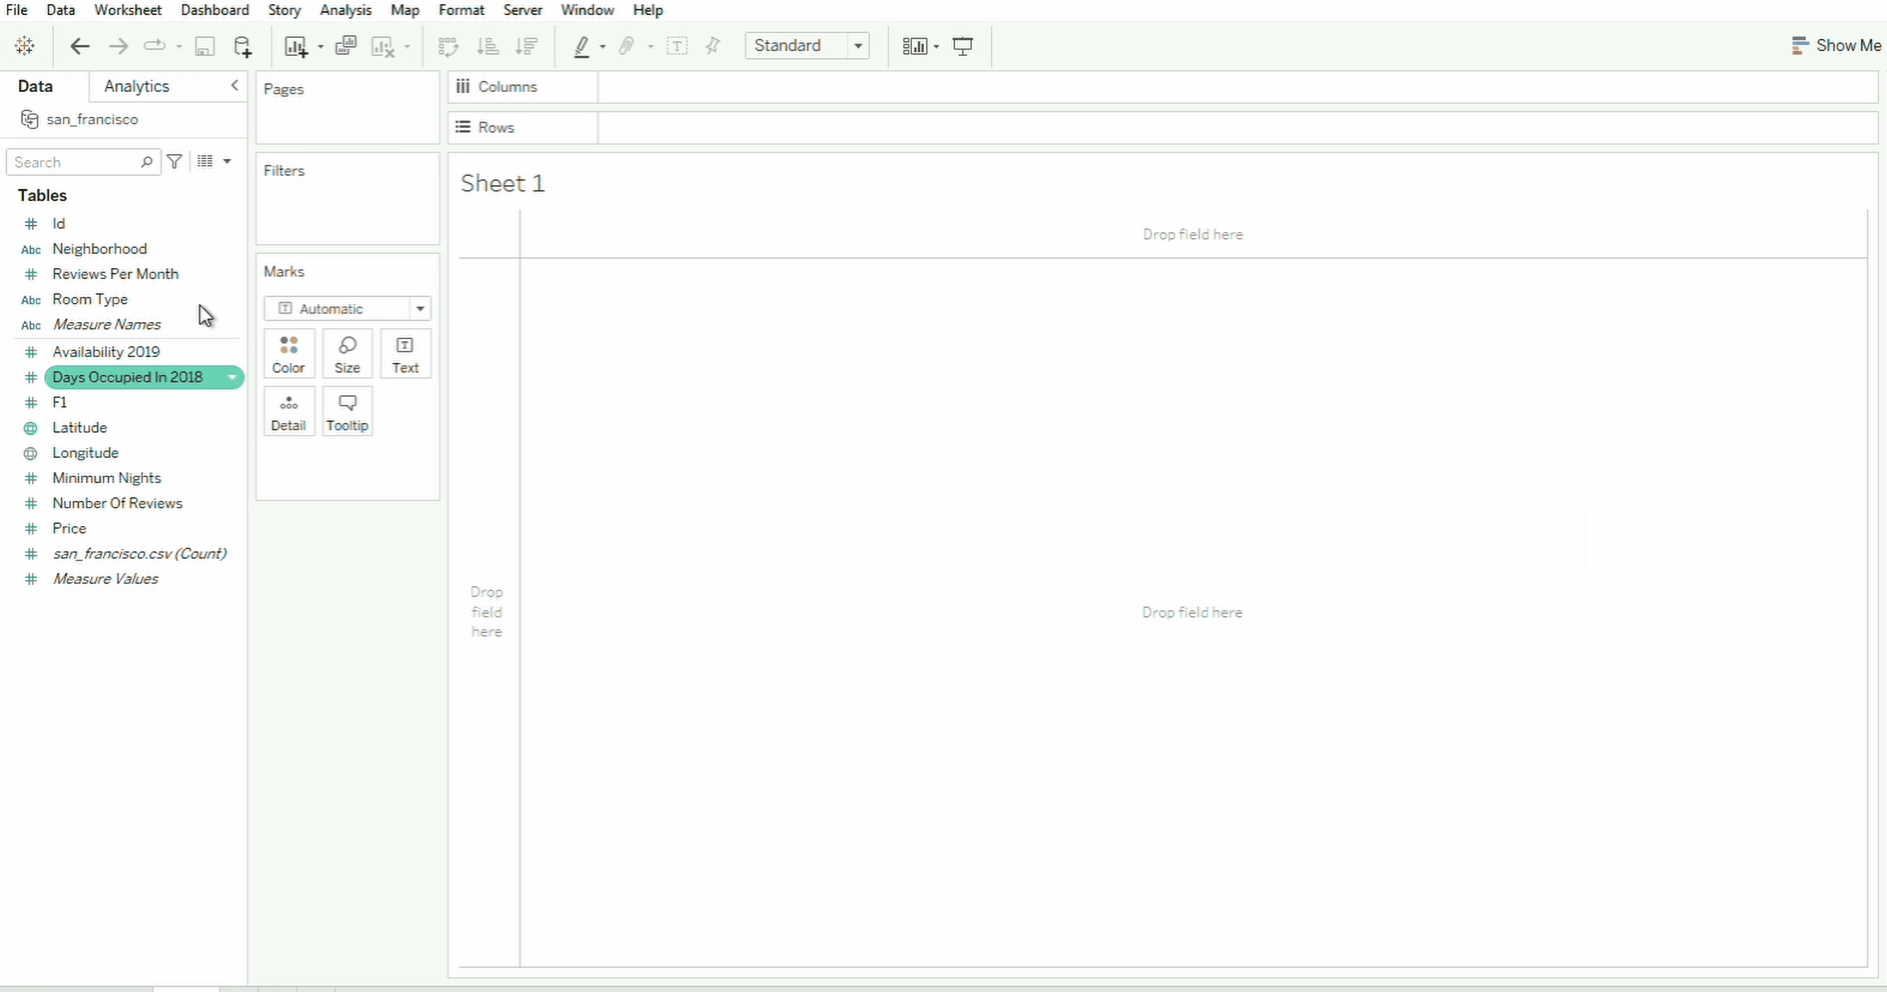
Tableau will take the sum of the data by default. You can also drag the field to Size and Color cards. To undo the changes, click the back arrow. To clear the changes, simply click the Clear Sheet icon.
Filters
Filter help you focus on specific data by including or excluding certain values.
In the example below, the Price field is dropped onto the Filters shelf, which will open a pop-up window.
- The range of price values are selected and applied.
- To remove a field, drag the field out of the shelf and drop it.
- To add another row, simply select another field and drop it onto the Rows.
Pages
The Pages shelf helps break down visualizations into multiple views based on a field.
In the example above, the Neighborhood field is moved from the Rows shelf to the Pages shelf. To navigate through the neighborhood page, we can use the selector on the box panel on the right, or simply select the specific neighborhood from the dropdown menu.