Dashboards and Stories
Dashboards
Dashboards combine multiple views into one interactive display. They help compare data and reveal insights.
- Automatically updates when worksheets change
- Allows filtering and interactive analysis
- Can connect views to act as filters
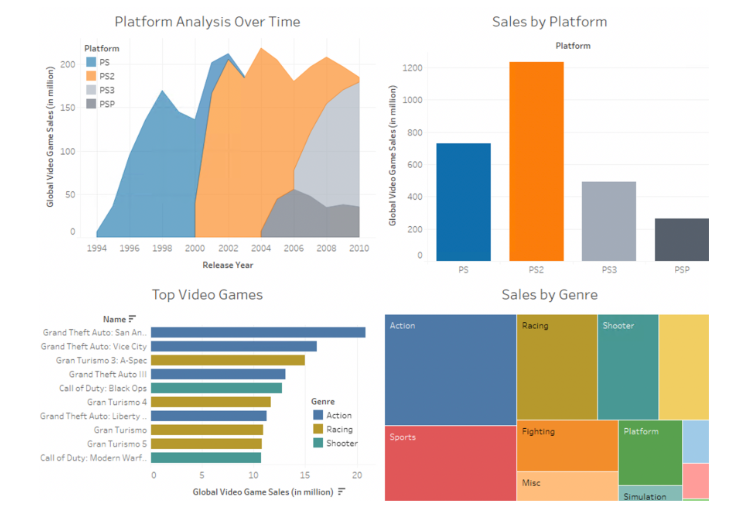
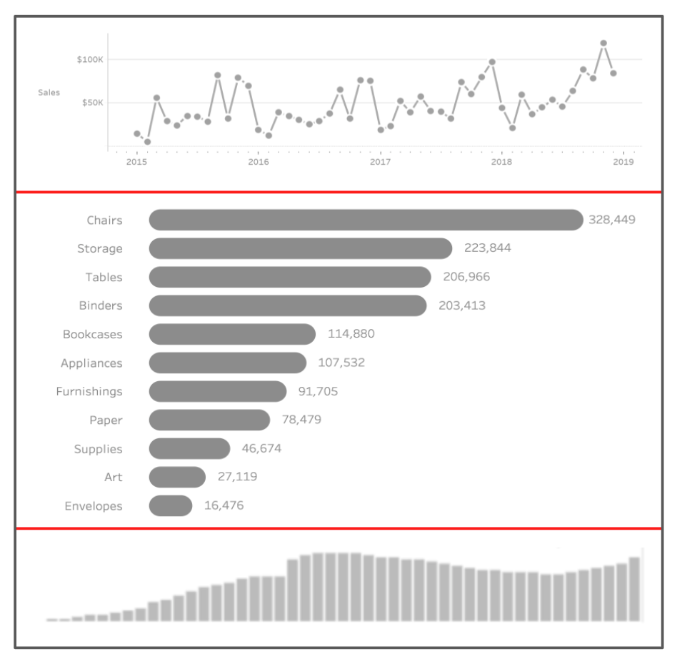
Dashboard Example
A dashboard on video game sales can show:
- Sales by platform
- Top video games
- Most popular genres
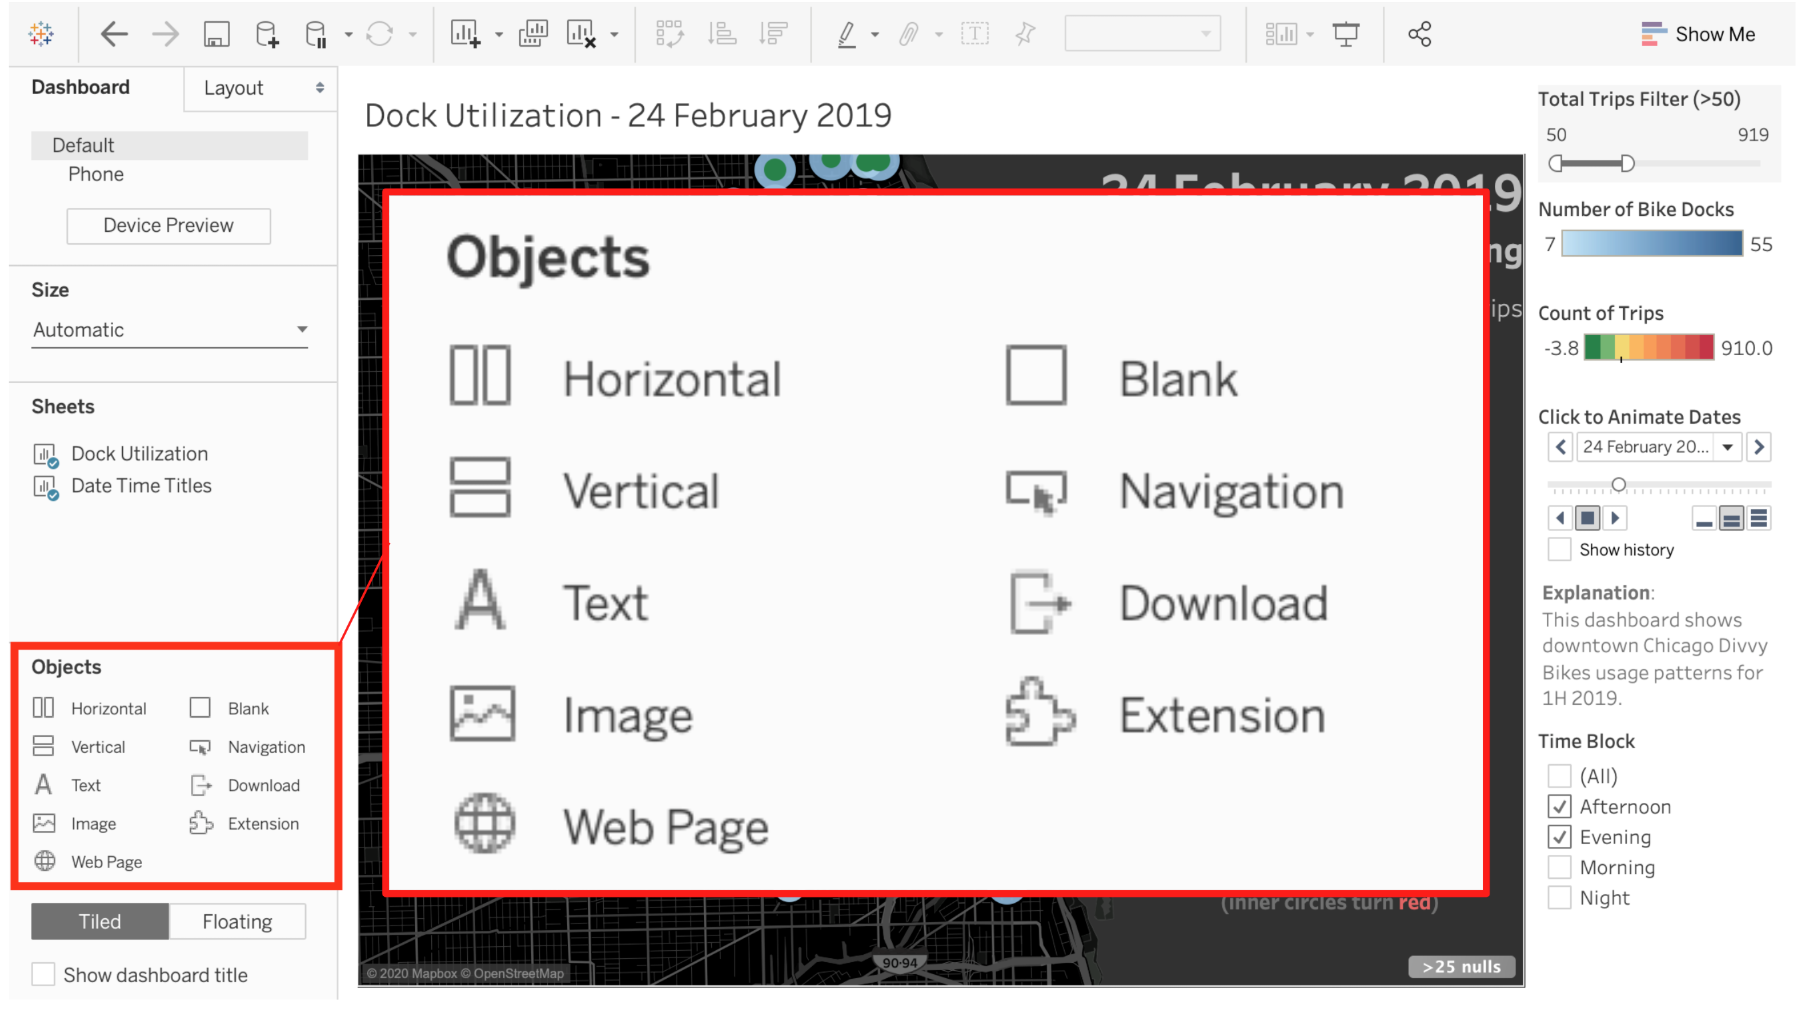
Dashboard Objects
Dashboard objects help structure and enhance the dashboard.
- Text Object: Adds text fields.
- Image Object: Inserts images, often used for logos.
- Containers: Groups dashboard elements for better layout.
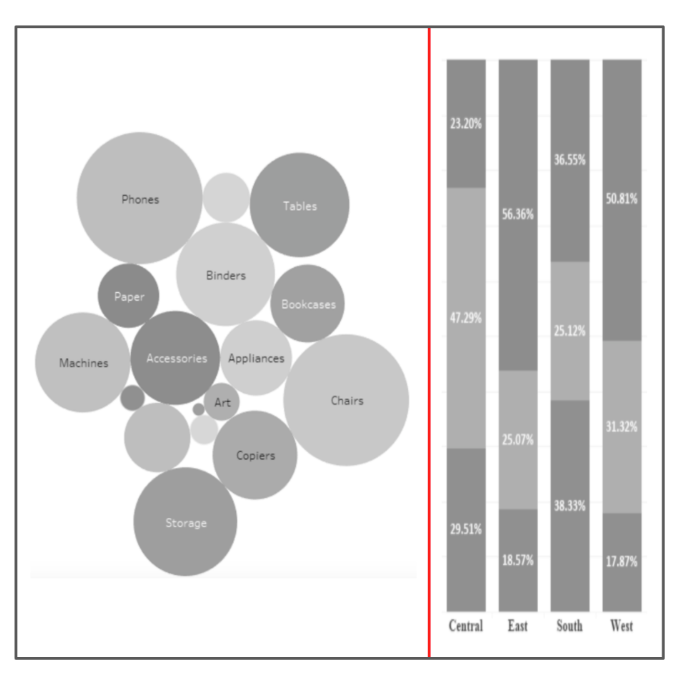
Containers
Containers organize multiple objects and adjust their sizes dynamically.
-
Horizontal Containers: Adjusts widths of objects inside.
-
Vertical Containers: Adjusts heights of objects inside.
-
Auto-Adjust: Items resize automatically when container size changes.
Dashboard Actions
Actions make dashboards interactive by linking data across worksheets.
- Filter Actions: Connect worksheets for interactive filtering.
- Data Context: Helps users focus on relevant information.
- Selection-Based Filtering: Updates visuals based on selected data.
Stories
Stories organize key insights into a sequence of visualizations, which makes it easier to understand trends.
- Helps present data as a narrative
- Bookmarks important findings
- Each step in a story is called a story point
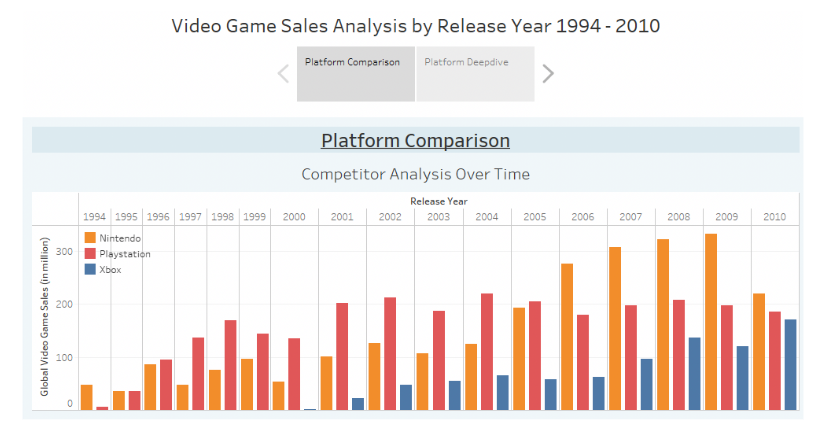
Stories Example
A video game sales story might include:
-
Platform Comparison – Compare Xbox, PlayStation, and Nintendo sales
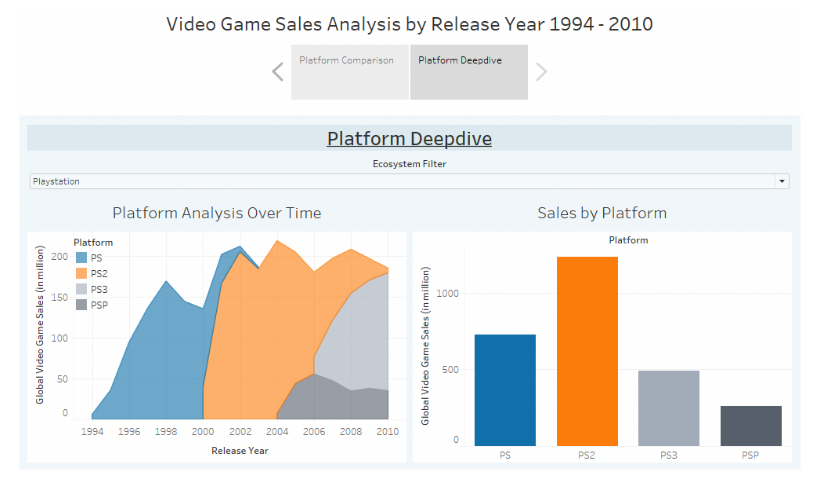
-
Deep Dive – Focus on PlayStation sales by platform
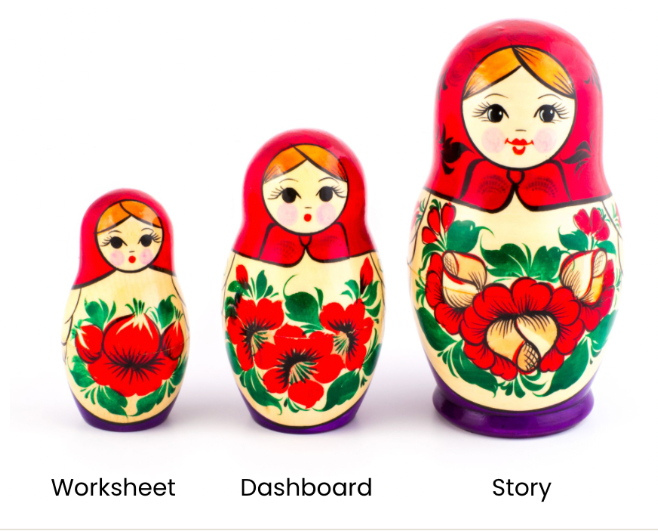
How Everything Fits
Think of worksheets, dashboards, and stories like Russian dolls.
- Worksheets go into dashboards
- Dashboards go into stories
- Sometimes, worksheets can go straight into a story
This structure keeps insights organized and easy to explore.