Sorting and Filtering
Overview
Filtering helps focus on relevant data by removing unnecessary information.
- Types of Filters – Filter by category, date, location, or numeric values
- Filter Order – Filters apply in a specific sequence, affecting results
- Dimension Filters – Used for categories, like filtering by room type
- Measure Filters – Used for numerical values, like filtering price ranges
Types of Filters
Order of Operations
Tableau processes filters in a specific order, which affects how data will be displayed:
| Filter Type | Description |
|---|---|
| Extract Filters | Filters data before extracting it from the source. |
| Data Source Filters | Filters data at the source level, applied to both live and extract connections. |
| Context Filters | Creates a temporary subset of data that other filters use. |
| Dimension Filters | Filters based on categorical fields like product type or region. |
| Measure Filters | Filters based on numerical values, such as sales or profit. |
| Table Calculation Filters | Applied last, after all other filters. |
Extract and data source filters occur when you are connecting and loading data sources, which usually happens when you're opening a worksheet.
Extract Filters
Extract filters are used to limit the data when using an extract connection.
- Available only when using an extract instead of a live connection.
- Limits which rows get extracted from the data source.
Data Source Filters
Data source filters restrict data at the source level for both live and extract connections.
- Applied at the source level to restrict data in both live and extract connections.
- Useful for limiting what users can see when sharing workbooks.
Context Filters
Context filters set the stage for other filters by narrowing the data scope.
- Acts as a primary filter before other filters.
- Improves performance by reducing the data scope.
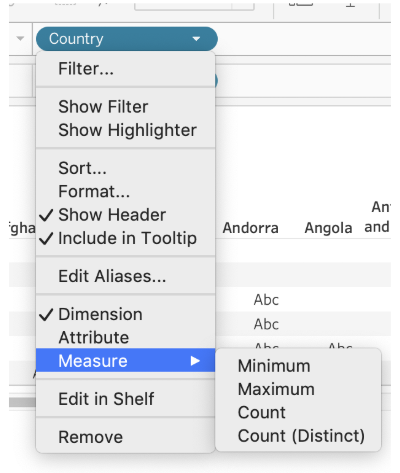
Dimension Filters (Blue)
Used for filtering categories.
- Include or exclude categories – Example: Filter by room type
- Wildcard filters – Find matches using characters
- Conditional filters – Filter based on other fields
- Top/Bottom filters – Show highest or lowest records
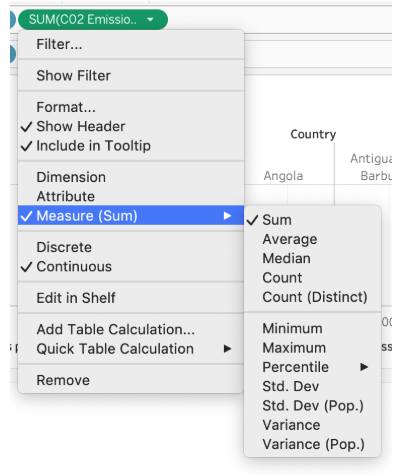
Measure Filters (Green)
Used for filtering numbers.
- Range filters – Set minimum and maximum values
- Null filters – Include or exclude missing values
Sorting
Sorting organizes data for better analysis.
- Default Sorting – Alphabetical order for categories
- Metric Sorting – Sort by numbers, like sorting products by profit
- Ascending/Descending – Arrange values from highest to lowest or vice versa
Filter Null Values
Null values can affect analysis, so filtering them out is useful.
- Exclude Nulls – Remove missing data from the view
- Show Only Nulls – Focus on incomplete data
- Replace Nulls – Fill missing values with a default value

Filter Top and Bottom Values
To filter just the top or bottom values, select the specific filter > Edit filter > Top > by field. Then specify the number and the dimension you want to filter.
Aggregation
Aggregation summarizes data for analysis, such as summing sales or averaging age.
-
Aggregating Measures
-
Tableau automatically aggregates measures using sum
-
Other options include average, count, and variance.
-
-
Aggregating Dimensions
-
Less common, but possible
-
Options like minimum, maximum, count, and distinct count.
-
Standard Deviation
Standard deviation measures how spread out data is from the average. It helps identify variability in datasets.
- Low standard deviation – Data points are close to the average.
- High standard deviation – Data points are more spread out.