Presenting Data
Overview
When creating a graph, it's important to focus on clarity and readability.
Formatting a Graph
Here's an example of a poorly formatted graph:
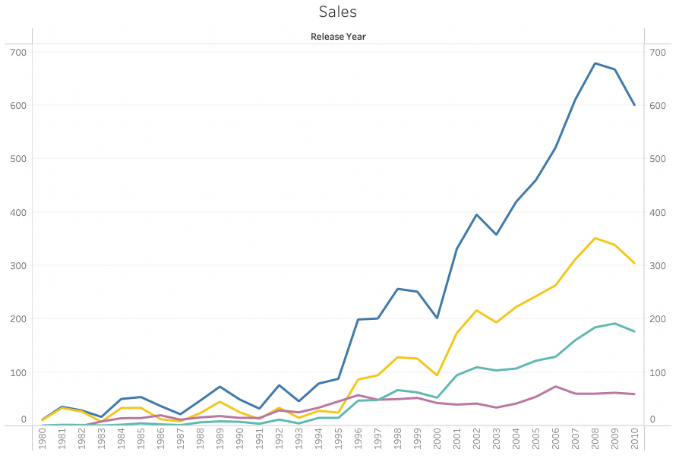
- Unclear title
- No legend
- Small font size
- Missing axis titles
By improving these elements, the graph becomes much clearer.
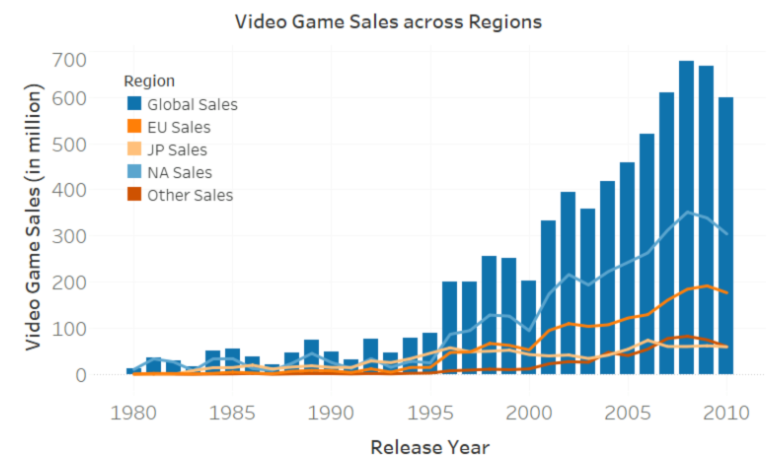
Changes made:
- Replaced one line with a bar chart to show global sales separately.
- Added a clear title and increased the font size for better readability.
- Labeled the axes and included a legend for easy interpretation.
- The graph now shows video game sales by release year and region, with 2008 being the highest-selling year.
Formatting Tips
To improve your visualizations, use these techniques:
- Informative titles: Clearly explain what the graph shows.
- Legible fonts and colors: Make sure the text is large enough and the colors are easy to distinguish.
- Legends: Help viewers understand what different colors represent.
- Axes titles: Label your axes to make them clear.
- Tooltips: Add tooltips so users can learn more by hovering over the graph.
Tableau provides default formatting options that are easy to adjust if needed.
Workbook vs. Sheet Formatting
You can format both at the workbook and sheet level.
-
Workbook
- This is like an entire Excel file.
- It contains multiple sheets.
- Used to organize, save, share, and publish results.
-
Sheet
-
A single tab in the workbook, similar to an Excel tab.
-
There are three types of sheets:
- Worksheets (used for creating visualizations)
- Dashboards
- Stories
-
Normalizing Graphs
When comparing multiple graphs, it's important to use the same scale to prevent misleading differences.
In the example below, the left chart looks similar in peak to the right one, but it actually reaches much higher. This is because the left graph’s y-axis goes up to about 34,000, while the right graph’s y-axis only goes to about 8,000.
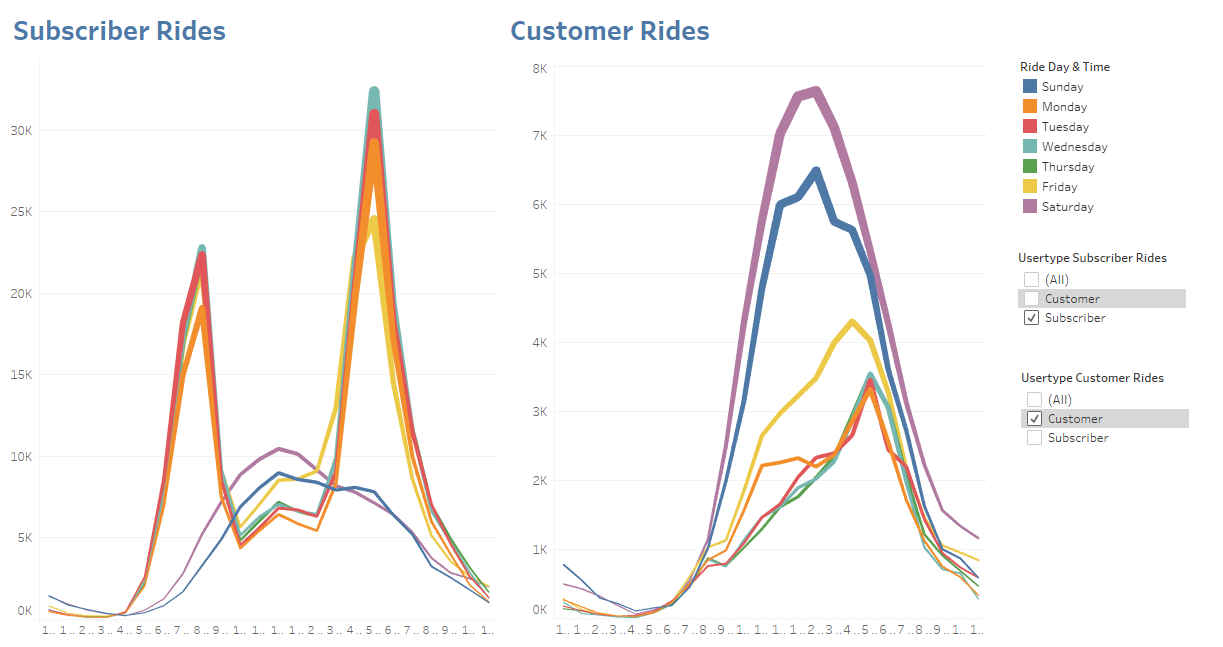
To fix this, manually set both axes to the same range:
- Right-click the axis on the first line chart.
- Select Edit Axis.
- Set Range to Custom and set the fixed end to 35,000.
- Repeat the same steps for the second chart.
See below:
Highlighter Filter Pen
The highlighter pen lets you focus on specific data by dimming everything else instead of hiding it. In the example below, multiple lines overlap.
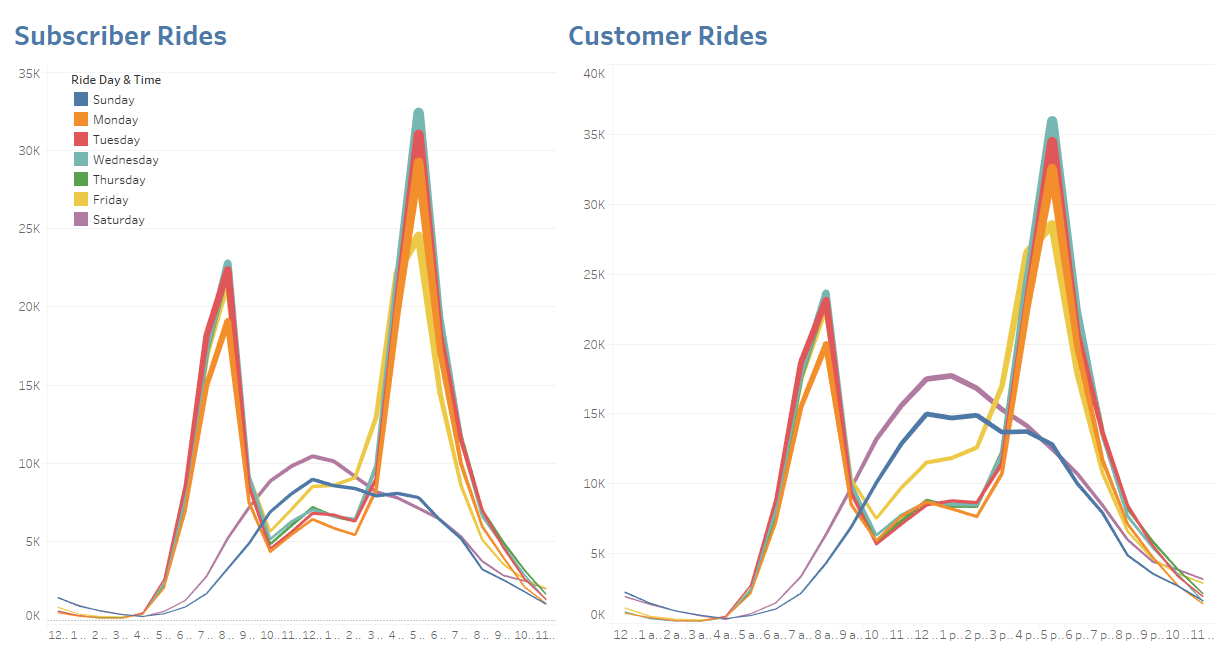
To highlight only the weekend data:
- Hover over the legend.
- Click the pencil icon in the top right.
- A horizontal pen icon will appear below it.
- Click and hold Saturday and Sunday to highlight them.
If no line appears under the pencil icon, the highlighter isn't active, and you won’t be able to highlight the data.
Lab: Workbook
In the following examples, we'll use a dataset that tracks video game sales from 1980 to 2010.
Download the workbook here: 4_1_video_games_sales.twbx
Example: Dual-Axis Graph
In this example, we'll use the video game sales dataset to compare global and European sales of Atari over time.
Steps
- Set
Release Yearas the column andGlobal Salesas the row. - Drag
EU Salesto the right until a dotted line appears. - Right-click and select Synchronize Axis.
- Ensure both axes have aligned numbers.
- Right-click the right axis and uncheck Show Header.
- Change
Global Salesfrom Line to Bar chart in the Marks card. - Center the title.
- Rename the Y-axis to "Video Game Sales (in millions)".
- Drag
Publisherto Filters and select Atari only.
Solution
Insights
The graph shows Atari’s peak sales in the early 2000s, followed by a sharp decline, leading to bankruptcy in 2013.
Example: Filter by Genre
Using the previous dataset, we'll filter by genre to find the "Puzzle" video game sales in North America.
Steps
- Drag
Measure ValuesontoEU Salesin the rows. - This replaces
EU SaleswithMeasure Values. - Remove unnecessary measures from the Marks shelf:
Video Games (Count)(row count)Global Sales(already in the bar chart)
- Currently, you need to hover each bar in the stacked bar to see the sales for each region.
- To change this, update the tooltip to show all sales data:
- Select
SUM(EU Sales), hold Shift, and click the lastSUMon Marks. - Drag them to the Tooltip card.
- Select
- Hover over the graph. Sales for all regions should now appear in the tooltip.
- In the Filters shelf:
- Filter
Publisherto Nintendo. - Filter
Genreto Puzzle.
- Filter
Solution
Insights
The graph shows a major spike in 1989 due to Tetris, which made up almost 90% of puzzle game sales that year.
Example: Bar Charts and Colors
This example uses a different workbook: 4_2_video_games_sales_global.twbx
Create a bar chart and apply three different Dimensions to color.
Steps
- Drag
Global Salesto Rows, whileRelease Yearto Columns. - Center the graph title and change font size to 16.
- Drag
Nameto the Color card in the Marks shelf. - Ignore the warning and press "Add all members".
- Drag
Genreto the Color card to replaceName.
Solution
Insights
Based on the Color card, we can see the that the Genre is the only dimension that adds extra information to the graph.